Chapter 4:
Graduate Academic and Graduate Professional Students
Goals
The California “Master Plan for Higher Education” charges the University of California with the responsibility for preparing graduate academic and graduate professional students to help meet the workforce needs of California and the nation.
UC’s goals with respect to graduate education are to offer outstanding degree programs, to support research and undergraduate instruction, and to prepare a professional workforce across all disciplines. UC produces the teachers, artists, thinkers, innovators, scientists, inventors, professionals and leaders of the future; it creates an environment of exploration and discovery that stimulates innovation and invention; and it maintains the University of California’s tradition of world-class graduate instruction. In this way, UC serves to drive California’s economy, allowing it to grow, create jobs and offer its residents the standard of living for which the state is well-known.
Types of graduate degrees
UC awards both graduate academic degrees and graduate professional degrees.
Graduate academic degrees — These include academic doctoral, academic master’s and professional doctoral degrees in the physical sciences, social sciences, arts, humanities and engineering/computer science. The largest proportion of graduate academic degrees awarded at UC is in the STEM fields — science, technology, engineering and math. In 2013–14, 50 percent of UC graduate academic degrees awarded were in STEM.
Graduate professional degrees — UC’s professional degrees include professional master’s and professional practice degrees in fields such as law, medicine, business, education, architecture, public policy and the arts. The graduate professional category includes professional master’s degrees (e.g., M.B.A., M.Ed.) and professional practice degrees (e.g., J.D., M.D.). In the field of medicine, UC offers the nation’s largest instructional program in healthcare and health sciences.
Before 1994, graduate professional degree programs were supported in the same manner as were other graduate programs. 1994 saw the beginning of a marked decrease in state support and the University began charging professional degree supplemental tuition. Professional degree supplemental tuition is in addition to the base tuition paid by all students and allows professional schools to recruit and retain UC-quality faculty, provide an outstanding curriculum and attract high-caliber students. Since instituting professional degree supplemental tuition, both the number of professional degree programs that charge professional degree supplemental tuition and the amount of supplemental tuition charged have increased steadily.
Recruitment and support of graduate students
Graduate education at UC is ranked at the highest levels among the country’s leading universities. One of the keys to a successful graduate program is recruitment of outstanding students. Such recruitment is challenged by competition with peer institutions for qualified individuals and in the amount of financial support that UC can offer.
Academic graduate student financial support comes from a combination of fund sources, including fellowships (external to UC and UC-funded), on-campus appointments as a graduate student researcher (GSR) or teaching assistant (TA), other opportunities for earnings on or off campus, savings, family contributions and/or loans.
Full financial support throughout a doctoral program is the goal for both UC and its competitors. Increases in tuition and fees have challenged the University’s ability to offer competitive support packages to its graduate students and have placed additional strain on the dwindling fund sources that cover those costs.
UC’s financial support for its academic graduate students has lagged behind its competitors’ offers for the last several years, though the gap narrowed between 2010 and 2013 (see indicator 4.2.3.)
The competitiveness gap in financial support is of particular concern for international graduate students. Indicator 4.1.1 suggests that it has been difficult for departments to admit and enroll international students in numbers proportionate to their rising demand. Currently, domestic non-California resident graduate students can establish state residency after one year of enrollment at UC. This provides the departments supporting these graduate students with an exemption from the annual $15,000 nonresident supplemental tuition charge. International graduate students, however, cannot establish California residency and remain subject to the nonresident supplemental tuition charges.
Since 2006, UC has implemented a number of policies designed to mitigate the additional financial burden of supporting nonresident graduate students. Doctoral students qualify for a nonresident tuition exemption for up to three years after they advance to candidacy, which typically occurs after two to three years of enrollment. Individual campuses have also implemented varying funding programs and strategies to address the cost of supporting international and nonresident graduate students.
Whereas nearly all financial support received by graduate academic students is in the form of fellowships, research positions and teaching assistantships, students in professional degree programs rely primarily on loans for financing their education. Although fellowship support for professional degree students has increased — due in part to the one-third of tuition, fees and professional degree fees that are set aside for institutional aid — it has been outpaced by increases in student borrowing.
Looking ahead
In addition to providing competitive graduate financial support, the University continues to develop programs and benefits designed to enhance the graduate student experience. UC’s overall excellence rests on the strength and scope of its graduate programs. Unlike undergraduate enrollment planning, which is based on California’s “Master Plan,” graduate enrollment planning is based on a number of factors, including assessment of state and national needs, faculty expertise, program quality (which includes international competitiveness) and available financial support. Over the last 50 years, as the University accommodated California’s burgeoning number of high school graduates, undergraduate enrollment growth has far outpaced graduate enrollment growth. As a result, the proportion of graduate students to undergraduates on the general campuses has decreased from about 30 percent in the 1960s to about 16 percent today. Given the critical contributions of graduate students to the University’s teaching and research mission, a 16 percent proportion of graduate students places UC well below its peer institutions.
For more information
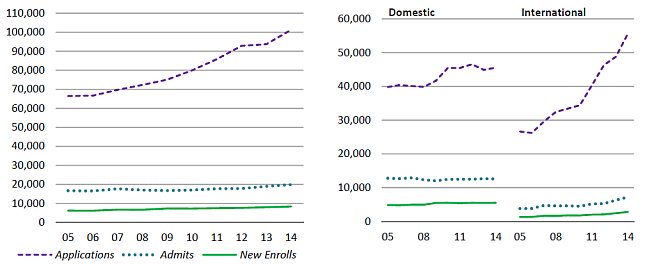
Universitywide graduate academic applications have increased substantially over the last ten years, while admits and new enrollments have remained relatively flat.
4.1.1 Graduate academic applications, admits and new enrollees, combined and by citizenship, Universitywide, Fall 2005–2014
Source: UC Corporate Student System
The demand for UC’s academic master’s and doctoral programs1 has increased steadily over the past ten years. During this time, applications2 for admission grew from 66,000 in 2005 to more than 100,000 in 2014 — a rate of 5 percent per year. Nearly all of this increased demand has come from prospective international students, whose applications grew from 26,000 to more than 55,000 — a rate of 11 percent per year. International students now submit more than half of all applications to UC’s academic master’s and doctoral programs, though the growth is primarily attributable to master’s and not doctoral programs.
Recent survey data compiled by the Council of Graduate Schools shows a similar nationwide trend, with applications from prospective international students growing at about 7 percent per year, on average, since 2005 — ranging from 2 to 12 percent per year. Engineering, physical sciences and computer science experienced the most robust growth in demand from international applicants, with double-digit growth in most years since 2010.3
Despite this more robust demand, new admits and enrollments to UC’s academic master’s and doctoral programs have remained relatively flat. Since 2005, new admits and enrollments have grown by only about 2 percent per year, with admits remaining at just below 20,000 per year and new enrollments at about 8,000 per year. Unlike applications, which are now predominantly from international students, both new admits and enrollments of domestic students are about double those of international students.
1 A small number of professional doctoral programs are also included in these data.
2 Universitywide applications and admits are duplicated in this report since students often apply to more than one campus. These are the numbers of applications and admits, not the number of applicants.
3 Findings from the 2014 CGS International Graduate Admissions Survey
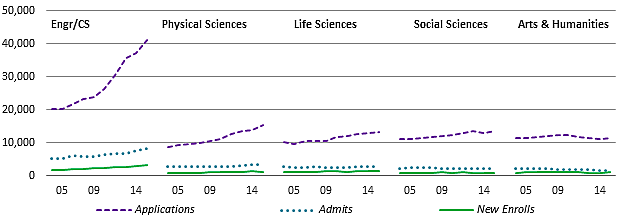
The increased demand for UC’s graduate academic programs has occurred predominantly in engineering and computer science.
4.1.2 Graduate academic applications, admits and new enrollees by discipline, Universitywide, Fall 2005–2014
Source: UCOP Corporate Student System
The increased demand for UC’s graduate academic programs has occurred predominantly in engineering and computer science. Applications to master’s and doctoral programs in engineering and computer science have grown by 10 percent per year since 2005, reaching 41,000 in 2014. Much of this increased demand has come from international applicants, who now submit 78 percent of the applications in these fields.
Other disciplines have experienced more modest demand increases. Applications in the physical sciences increased by about 8 percent per year from 2005 to 2014, from 8,500 to over 15,000; 3 percent per year in the life sciences, from 10,000 to over 13,000; and 2 percent per year in the social sciences, from 11,000 to 13,500. Arts and humanities experienced a slight decrease in demand of 2 percent per year over the last four years.
New enrollments increased from 2005 to 2014 in engineering and computer science by 9 percent per year and by 5 percent per year in the physical sciences, while remaining relatively flat in the other disciplines.
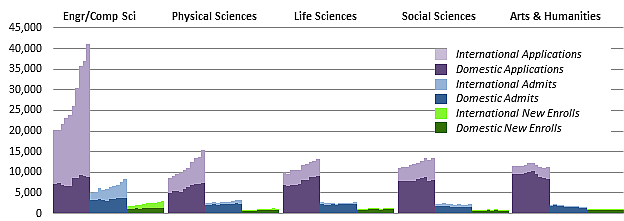
4.1.3 Graduate academic applications, admits and new enrollees by discipline and residency, Universitywide, Fall 2005–2014
Source: UCOP Corporate Student System
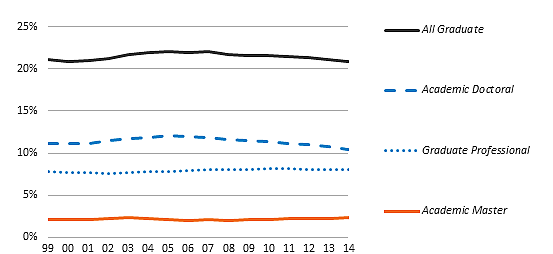
Graduate enrollment, as a share of UC’s total undergraduate and graduate enrollment, has remained relatively steady over the past 16 years.
4.2.1 Graduate enrollment share of total, Universitywide, Fall 1999 to fall 2014
Source: UCOP Corporate Student System
Academic master’s students include a small number of post-baccalaureate teaching credential students. The graduate professional category includes professional master’s (e.g., M.B.A., M.Ed.) and professional practice (e.g., J.D., M.D.) degrees. Growth at UC has been distributed fairly evenly across academic master’s, academic doctoral and graduate professional programs. With 21 percent graduate enrollment in 2012 including health science students, UC was lower than the average for non-UC AAU1 public institutions, at 27 percent, and the average for AAU private institutions, at 53 percent.
In fall 2014, the proportion of academic doctoral students varied across the general campuses, from 6 percent at Merced to 15 percent at Berkeley. At San Francisco, an exclusively graduate health-sciences campus, academic doctoral students made up 26 percent of fall 2014 enrollments. As shown in indicator 10.2.4, UC awards 29 percent of California’s graduate academic master’s degrees, 63 percent of its academic doctoral degrees and 23 percent of its graduate professional practice degrees.
Percent and number of fall 2014 students who are academic doctoral
| San Francisco |
26%
|
809
|
| Berkeley |
15%
|
5,536
|
| Los Angeles |
11%
|
4,562
|
| Davis |
10%
|
3,413
|
| San Diego |
10%
|
3,201
|
| Santa Barbara |
10%
|
2,234
|
| Irvine |
9%
|
2,634
|
| Riverside |
9%
|
1,880
|
| Santa Cruz |
7%
|
1,253
|
| Merced |
6%
|
348
|
|
|
|
| Universitywide |
10%
|
25,870
|
Source: UC Corporate Student System
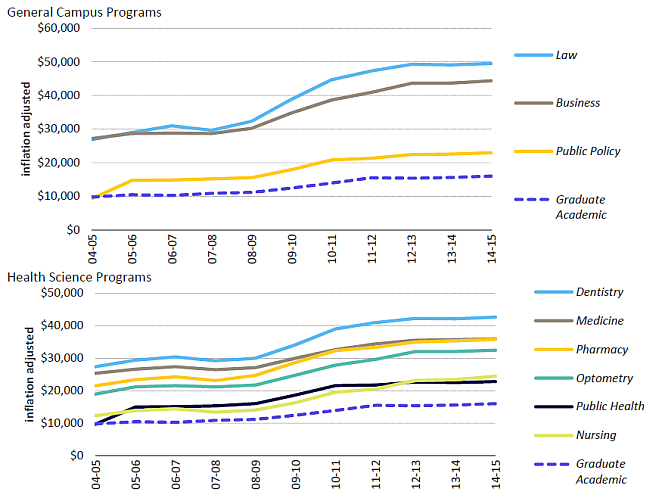
Fee amounts have grown considerably for students in professional degree programs.
4.2.2 Graduate academic and graduate professional average student charges, Universitywide, 2004–05 to 2014–15
Source: UC Budget Office and UC campuses
The Board of Regents approves professional degree supplemental tuition levels. Considerations in setting these rates include the articulated program need and proposed use of the additional fees, availability of financial aid, tuition level of peer programs and other factors. The full Regents’ policy on professional degree supplemental tuition is available at www.universityofcalifornia.edu/regents/policies/ 3103.html.
The graphs show the average total charges1 for selected professional degree programs. They also show the average charge, including health insurance, for a graduate academic student who does not pay professional degree supplemental tuition. Nonresident tuition is excluded.
1 Includes mandatory systemwide tuition, health insurance, campus-based fees, and professional degree and supplemental tuition charges. Not all programs are shown. Averages are simple averages based on campus amounts; the number of students in each program is not taken into account.
UC net stipends remain below competitive offers, but the gap decreased between 2010 and 2013.
4.2.3 Average net stipend offered to graduate academic doctoral students admitted to UC compared with their first-choice non-UC schools, Universitywide, 2007, 2010 and 2013
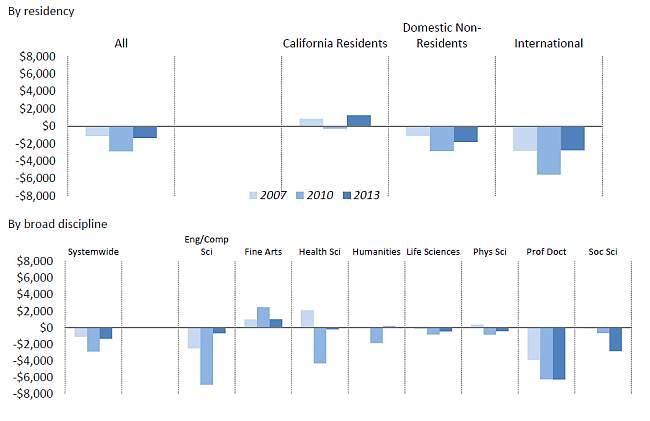
Source: UC Graduate Student Support Survey. Graduate academic professional doctoral programs include Ed.D., D.Env., D.Ph., D.P.T. and D.N.S.
Doctoral students are crucial to a university’s research enterprise and instructional programs. To attract the most highly qualified applicants, universities offer an aid package that includes the cost of tuition and stipends. Net stipend is the amount of aid that students have for living expenses after tuition and fees are paid. It is calculated by subtracting total tuition and fees from a student’s support package (which includes gift aid and teaching or research assistantships). It does not include loans that the student may be offered. The “stipend gap” varies by discipline as shown in the chart above.
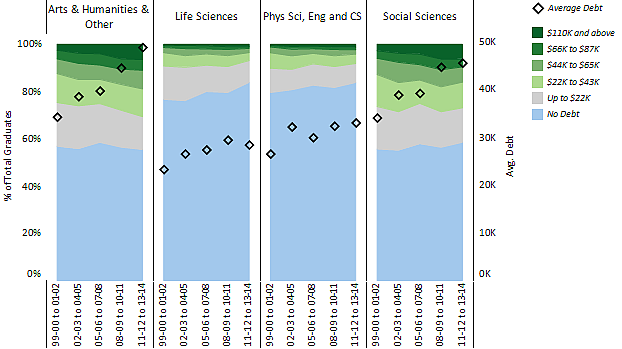
More than half of UC doctoral students graduate without debt. Doctoral students in the physical and life sciences have seen smaller increases in debt over the past 12 years, and graduate with less average loan debt than those in the social sciences and arts and humanities.
4.2.4 Academic doctoral students’ graduate debt at graduation, by discipline, domestic students, Universitywide, Graduating classes of 1999–2000 to 2013–14
Source: UC Corporate Student System1
Depending on the field of study, between 55 percent (social sciences) and 85 percent (life sciences) of UC doctoral students take on no additional debt during graduate school. Several factors account for the difference in debt burden between doctoral students in the physical and life sciences and those in other disciplines. Physical and life science students are more likely to be supported by research grants. Their programs take less time on average to complete than do programs in the social sciences or arts and humanities.
1 Debt categories are inflation-adjusted in 2013 dollars using CA CPI-W. “Other” includes interdisciplinary and professional fields. Life sciences include health sciences.
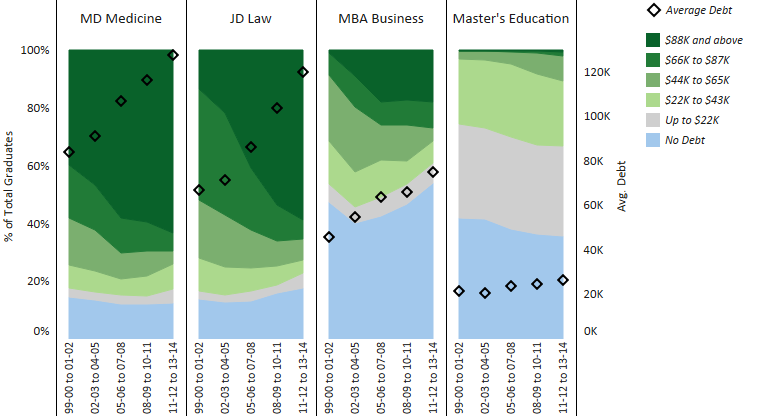
Graduates with the highest debt levels come from professional schools that charge higher supplemental tuition.
4.2.5 Graduate professional degree student debt at graduation, by discipline, domestic students, Universitywide, Graduating classes of 1999–2000 to 2013–14
Source: UC Corporate Student System1
On average, about two-thirds of the aid awarded to graduate professional degree students comes in the form of loans rather than as fellowships or grants. By comparison, loans constitute only 8 percent of the aid awarded to graduate academic students. Graduate funding models require greater reliance on loans for professional degree students as their programs are of shorter duration and many fields offer potential for higher incomes after graduation.
Most graduate professional degree students finance part of their education by borrowing. The increases since 1999–00 in average inflation-adjusted debt levels of graduating professional degree students vary considerably. Increases in graduate debt result from a combination of factors, including steady growth in tuition and greater student reliance on federal student loan programs.
1 Average debt is among graduates with debt. Debt categories are inflation-adjusted in 2013 dollars using CA CPI-W.
Like other major research universities, UC awards a high proportion of graduate academic degrees in science, technology, engineering and math (STEM) fields.
4.3.1 Graduate academic degrees awarded by discipline, UC and comparison institutions, Number of degrees grouped in 3-year intervals: 2001–02 to 03–04, 2004–05 to 2006–07, 2007–08 to 2009–10 and 2010–11 to 2012–13
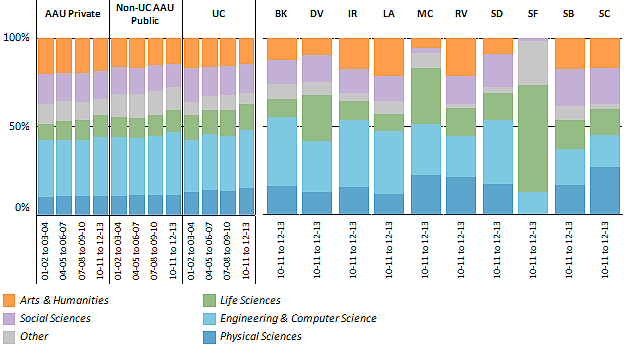
Source: IPEDS1
UC graduates have had major impacts on the nation and the world — creating much of California’s biotechnology and computer industries, developing research breakthroughs that have led to major medical advances, shaping ideas about our world and culture, creating the economic and social infrastructure of our communities, and assuming political leadership in California and the nation.
UC’s graduate STEM programs reflect the predominant industries in California’s economy. In addition to leading all California institutions in the production of engineering and computer science degrees, UC far outpaces them in the production of degrees in the biological sciences — key to driving the growth of California’s emerging biotechnology sector. More than 20 UC Ph.D. recipients have been awarded Nobel Prizes. Over the past 12 years, the number of graduate academic degrees awarded at UC grew by 51 percent, compared to 48 percent at the group of AAU private institutions and 41 percent for the group of non-UC AAU public institutions.
UC’s doctoral completion rate increased in every field over the two most recent cohorts studied.
4.3.2 Doctoral completion rates after ten years, by broad field, Universitywide, Fall 1988–90, 1992–94, 1996–98 and 2000–02 entry cohorts
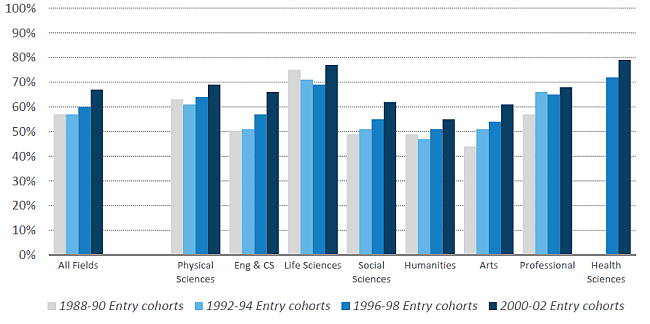
Source: UCOP Institutional Research and Academic Planning
The universitywide ten-year doctoral completion rate across all fields for the fall 2000–02 entering cohorts was 67 percent. This is an increase from the 60 percent completion rate reported for the cohort that entered four years previously. Among broad disciplines, life sciences and health sciences continue to have the highest completion rates. Humanities and arts showed the lowest rates, owing to the longer normative time in those fields and different financial support models, although both experienced an increase compared to previous cohorts.
The overall improvement in ten-year completion rates may be attributed to at least two factors. First, there has been a shift in the student demographics to a larger percentage of international students, who, as a group, have a higher ten-year completion rate than the overall cohort’s rate. Second, the proportion of students pursuing doctoral degrees in life sciences, physical sciences and math, and engineering and computer science fields increased 5 percentage points between the 1996–98 and 2000–02 cohorts; students in these fields have a higher completion rate than do students in other fields.
Doctoral completion rates have improved on all UC campuses.
4.3.3 Doctoral completion rates after ten years, by campus, UC campuses, Fall 1988–90, 1992–94, 1996–98 and 2000–02 entry cohorts
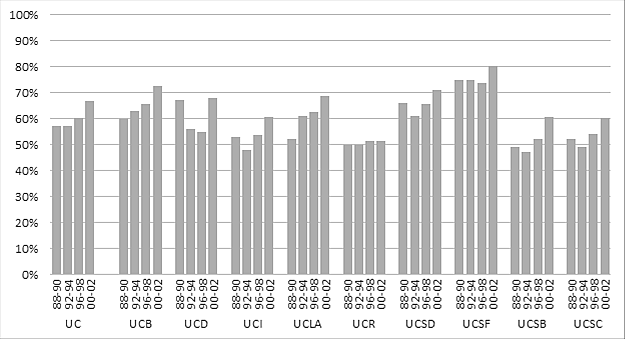
Source: UCOP Institutional Research and Academic Planning
The proportion of students in STEM (science, technology, engineering and math) disciplines on a campus may play a role in its doctoral completion rates. The time spent in these degree programs is shorter than in arts and humanities; therefore, the ten-year completion rates of students in STEM fields tend to be higher than most other fields. In general, the UC campuses with larger proportions of STEM students also tend to have higher overall completion rates. Davis, San Diego and San Francisco have the highest percent of students in STEM fields and have shown some of the highest completion rates over the last four cohorts. Similarly, a larger percent of students at Riverside, Santa Barbara and Santa Cruz were enrolled in programs outside of STEM fields, and ten-year completion rates at those campuses are lower.
The elapsed time-to-doctorate (ETD) at UC is roughly the same as at other academic research universities. There was no change in ETD for UC and the comparison institution groups in the 2004–06 and 2007–09 cohorts in the Survey of Earned Doctorates. UC’s individual campuses compare favorably to the Association of American Universities (AAU) members and the traditional public and private comparison institutions. For the 2007–09 cohorts, most UC campuses had the same ETD measure as the broad comparison institution groups. The 2011 Time-to Doctorate Report is available at http://www.ucop.edu/institutional-research-academic-planning/_files/2011-uc-time-doctorate.pdf.
More than half of UC’s academic doctoral recipients plan to stay in California, a greater share than those who attended high school or college in California.
4.3.4 Origin and planned destination of UC academic doctorate recipients, Universitywide, 2007–08 to 2012–13
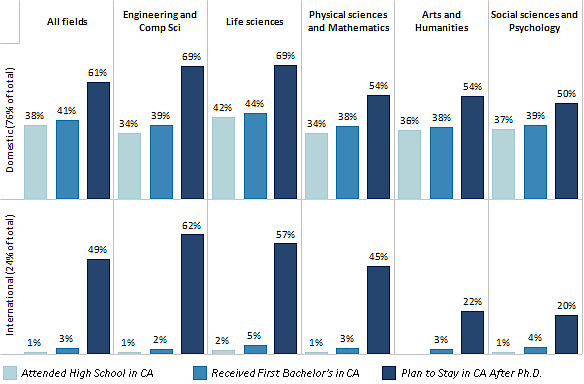
Source: NSF, NIH, USED, USDA, NEH, NASA, Survey of Earned Doctorates. Excludes UC Merced.
The most recent data for UC’s doctorate recipients, based on those graduating between 2007–08 and 2012–13, show that over half plan to stay in California. Sixty-one percent of domestic doctorate recipients intend to stay, though only 41 percent of this cohort received their bachelor’s degrees in California and only 38 percent attended high school in California. This proportion is higher in science, technology, engineering and math (STEM) fields, indicating that UC graduates are contributing to California’s robust economy in these areas.
Though a negligible share of UC’s international (not a U.S. citizen nor permanent resident) doctoral recipients attended high school or college in California, half intend to stay after graduation.
The Survey of Earned Doctorates (SED) is conducted of all individuals receiving a research doctorate degree. It is sponsored by the National Science Foundation, National Institutes of Health, U.S. Department of Education, U.S. Department of Agriculture, National Endowment for the Humanities and NASA.
Half of UC academic doctoral and master’s graduates who stay in California work in higher education.
4.3.5 Industry of employment of UC graduate academic students in CA, by year after graduation, Universitywide, 2000 to 2011 graduating cohorts
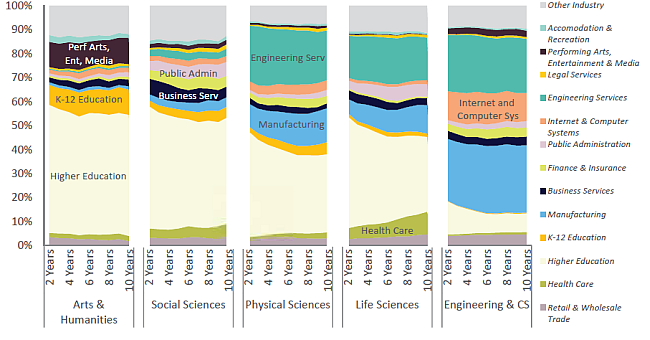
Source: California Employment Development Department and UC Corporate Student System1
The job market for doctoral recipients is nationwide, and those who leave California are not tracked here. More than 25,000 graduates of UC academic doctoral and master’s programs (in fields other than engineering/computer science) have entered the California workforce since 2000. Half of them have gone on to work in the state’s higher education workforce, which includes all of the two-year and four-year colleges, both public and private. This highlights the critical role of UC’s graduate academic programs in producing the cadre of faculty who teach California’s future college-educated workforce and conduct research that advances the state and national economies.
The contributions of UC academic doctoral and master’s graduates to the state workforce go beyond higher education. More than 12 percent of the employed graduates of UC physical sciences and life sciences programs work in the state’s manufacturing sector, while another 25 percent work in the engineering industry. This shows that the skills gained in UC academic doctoral and master’s programs are both applicable and relevant to key high-tech industries.
UC graduate academic programs in engineering and computer science supply workers to the state’s high-skilled and high-tech industries. Since 2000, 14,000 graduates of these programs have entered the California workforce, with 30 percent working in the manufacturing sector and 25 percent working in engineering services. Another 18 percent go on to work in the state’s fast-growing Internet and computer services industry. About 16 percent of these graduates go on to teaching and research positions in the state’s college and university systems.
1 Includes very small numbers of graduate professional students, which do not affect the overall picture.
Compared with the national average, a greater proportion of UC doctoral graduates find employment in educational institutions.
4.3.6 Academic doctoral degree recipient employment sectors, all graduates since 1969, UC and national comparison, 2013 (UC) and 2008 (NSF)
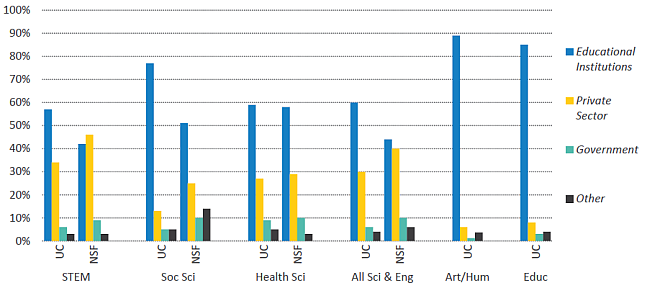
Source: UC Graduate Alumni Survey and NSF Survey of (Science and Engineering) Doctoral Recipients1
The proportion of UC doctoral degree recipients who find employment in educational institutions is higher than the national average for the broad disciplinary groups tracked by the National Science Foundation (NSF). California’s colleges and universities depend on UC doctorate recipients to teach their students: One out of five UC and CSU faculty members has a UC doctoral degree.
1 NSF comparisons are only available for certain disciplines and not available for arts/humanities and education.
Like other major research universities, UC awards a high proportion of professional degrees in business.
4.4.1 Graduate professional degrees awarded by discipline, UC and comparison institutions, Number of degrees grouped in 4-year intervals: 2001–02 to 03-04, 2004–05 to 2006–07, 2007–08 to 2009–10 and 2010–11 to 2012–13
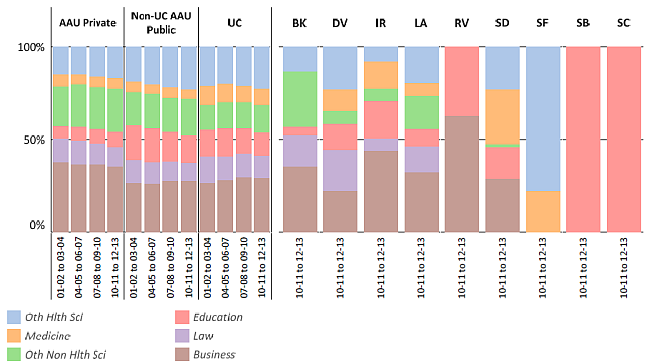
Source: IPEDS1
The proportion of professional degrees awarded by UC is comparable to AAU private and public institutions with the greatest proportion of degrees awarded in business. The number and size of graduate professional degree programs varies by campus, with UCLA awarding the greatest number of professional degrees. Over the past dozen years, UC has opened new professional schools in several areas, including the Rady School of Management at UC San Diego in 2003, the School of Law at UC Irvine in 2006 and the School of Medicine at UC Riverside in 2013.
1 UC Merced has no professional degree students. “Other” includes disciplines such as public administration, architecture, communications and library science.
UC professional programs prepare graduates for careers related to their field of study.
4.4.2 Industry of employment of UC graduate professional students in CA, by year after graduation, Universitywide, 2000 to 2011 graduating cohorts
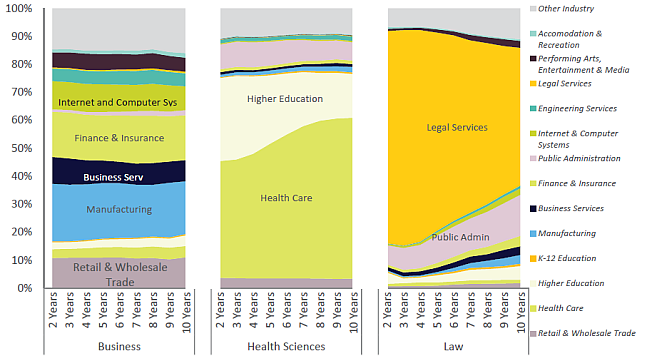
Source: California Employment Development Department and UC Corporate Student System1
Graduates of UC Master of Business Administration (MBA) programs contributed significantly to the state’s high-skilled and high-tech industries. The 15,000 UC MBA graduates who have entered the California workforce since 2000 have worked in a wide array of industries, including manufacturing (26 percent), finance and insurance (20 percent), retail and wholesale trade (17 percent), and Internet and computer systems (17 percent).
Nearly 10,000 graduates of UC health science professional practice programs (e.g., M.D., D.D.S., Pharm.D.) have gone on to work in California since 2000. The majority of these graduates (62 percent) go on to work in the state’s health care sector. This highlights UC’s role, per the “Master Plan,” as the state’s sole public provider of many health science professional practice degrees and validates UC’s success in fulfilling that role. UC health science graduates also play key roles in other areas of public service in the state, including 35 percent who go on to work in the state’s higher education system and 12 percent who work in state government.
UC law school graduates go on to work in two main areas — legal services and government. Of the 7,500 UC law school graduates who have worked in California since 2000, more than 80 percent eventually find positions in the legal services industry. Another 15 to 20 percent go on to work in the public sector, including as government prosecutors, as public defenders and in other public agency roles. A large percentage of law school graduates start off in legal services initially after receiving their degree (76 percent), but by ten years after graduation this percentage has fallen to about 49 percent. The percent of UC law school graduates in government rises from 7 percent to 15 percent over the same period.
1 Includes very small numbers of graduate academic students (e.g., Ph.D. business), which do not affect the overall picture.