Chapter 13:
Capital Program and Sustainability
UC’s capital program
The University maintains more than 5,900 buildings enclosing 133 million square feet on approximately 30,000 acres across its ten campuses, five medical centers, nine agricultural research and extension centers, and the Lawrence Berkeley National Laboratory. With such a substantial infrastructure, the University strives to be a good steward of the capital resources entrusted to its care.
Sources of capital funding
UC’s capital program is funded by a combination of state and non-state funds. Historically, the majority of UC’s core academic capital projects were funded by the state. With state general obligation bonds playing a declining role in the University’s capital program over the past decade, the University has been forced to rely on other resources to fund capital projects. In the past decade, non-state funds made up of gifts, grants, bonds and other sources, have accounted for 85 percent of UC’s capital program funding.
Approved Capital expenditures
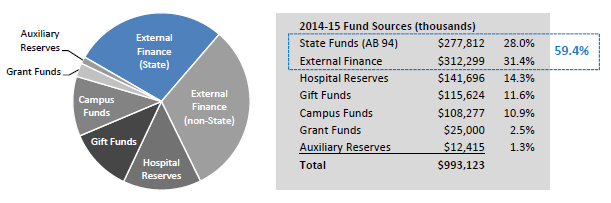
During FY 2014–15, UC approved capital project budgets totaling $993 million. Nearly 60 percent of the cost of capital projects approved in 2014–15 was met through debt financing. The remainder of the capital projects are funded by a diverse array of non-state sources. The majority of these projects, as well as those going back to at least 2010–11, were aimed at core academic programs and aging facilities.
An expanding infrastructure
Since 2005, the space available to UC for program uses has increased by 14.2 million square feet. Even more space must be added to accommodate enrollment growth and expanding programs. In addition, UC must maintain and upgrade its facilities, more than half of which are at least 35 years old, and many of which are in need of significant seismic upgrading.
UC’s sustainability program
The University of California is a national leader in sustainability. The University affirmed its leadership position in 2007 when all ten chancellors signed the American College & University Presidents’ Climate Commitment. Furthering this leadership, in November 2013, UC announced an initiative to achieve carbon neutrality by 2025. This initiative will make UC the first major research university to achieve carbon neutrality.
The initiative builds on UC’s work on climate and carbon neutrality research (as detailed in Chapter 9) and furthers its leadership in sustainable business practices. UC is improving its energy efficiency, developing new sources of renewable energy and enacting a range of related strategies to cut carbon emissions.
The University’s Policy on Sustainable Practices, updated in 2015, has multiple areas of focus: Climate Action, Green Building, Clean Energy, Transportation, Recycling and Waste Management, Environmentally Preferable Procurement and Sustainable Food Services, demonstrating the University’s commitment to wise stewardship of its resources and the environment. UC continues to lead higher education in sustainability as demonstrated in the 2015 Annual Report on Sustainable Practices.
Successes noted in this year’s report include $166M in cumulative avoided energy costs via Energy Efficiency Partnership projects, 30.7 megawatts of on-site renewable electrical generation installed and 225 LEED certifications, the most of any higher education institution in the country.
The University has formed an Energy Services Unit (ESU) to implement large systemwide renewable energy strategies using the University’s capability to finance projects at favorable rates. The ESU is pursuing four strategies to achieve carbon neutrality:
- Expand the highly successful statewide Energy Efficiency Partnership program.
- Develop a wholesale power procurement strategy that provides a steadily increasing amount of renewable power.
- Procure large quantities of biomethane (biogas) in lieu of natural gas.
- Proactively manage UC’s carbon allowances and offsets in compliance with California’s cap-and-trade program.
FOR MORE INFORMATION
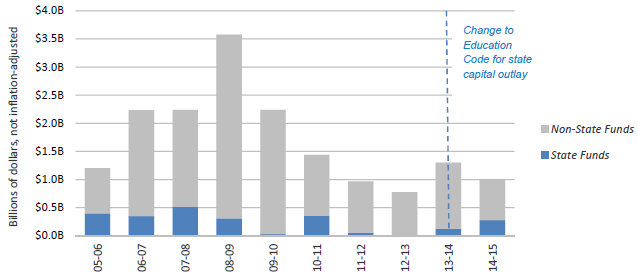
The majority of UC’s capital project funding over the last ten years continues to be derived from non-state fund sources; changes to the Education Code for state capital outlay in 2013 allowed an increase of funding to be directed to state capital projects.
13.1.1 Sources of capital spending, Universitywide, based on budgets approved each year, 2005–06 to 2014–15
Source: UC Capital Programs
UC’s capital program is funded by a combination of state and non-state funds. State funds were historically the primary source of funding for core academic facilities and seismic compliance for acute care hospitals (Senate Bill 1953). Non-state sources fund self-supporting enterprises, such as housing, parking, athletics and medical enterprises, which are generally not eligible for state funding. In the past decade, non-state funds made up of gifts, grants, bonds and other sources, have accounted for 85 percent of UC’s capital program funding.
As illustrated in indicator 13.1.1, state funding for the University’s capital improvement projects varies year to year. With the last general obligation bond measure passing in November 2006 and the fact that the state continues to strive to reduce its overall bond debt, the state support for capital outlay has decreased, significantly impacting UC’s capital program.
2013–14 legislation (Assembly Bill 94 or AB 94) enacted a major change in how UC could fund its debt service on capital outlay. This legislation provides flexibility to UC by allowing the University, under certain conditions, to use its state General Fund allocation to finance a variety of capital needs: designing, constructing and equipping academic facilities; addressing seismic and life safety needs; accommodating enrollment growth; modernizing out-of-date facilities; and expanding infrastructure to serve academic programs. The Education Code stipulates that UC manage its program so that not more than 15 percent of its annual state General Fund allocation is used for debt service for capital expenditures, pay-as-you-go capital outlay projects, and previously approved general obligation bond and State Public Works Board rental payments.
A total of 19 projects have been approved through this process for 2013–14 and 2014–15 and those projects are in various stages of implementation.
Nearly 60 percent of the cost of capital projects approved in 2014–15 was met through financing.
13.1.2 Sources of capital spending detail, Universitywide, Budgets approved in 2014–15
Source: UC Capital Programs
Financial challenges require each campus to consider carefully how to deploy resources to optimize the benefits to academic programs and the campus mission as a whole. In the absence of significant state funding, campuses must make urgent funding decisions for critical projects that cannot be delayed. In some cases, campuses redirect non-state funds to projects that otherwise would have been funded with state resources. To the extent that non-state funds are used to support core academic capital needs, less funding is available to support other high priority needs.
With state general obligation bonds playing a declining role in the University’s capital program over the past decade, the University has been forced to rely on other resources to fund capital projects. In particular, external financing that utilizes non-state sources to service the debt has played a greater role in funding capital needs. In response, a new debt service model has emerged; as noted in indicator 13.1.1, the approved state-supportable capital projects in 2014–15 employ University financing that utilizes state General Funds to service the debt. Funding for these state projects represents close to half of the approved UC financing in 2014–15.
As shown in indicator 13.1.2, nearly 60 percent of the cost of capital projects approved in 2014–15 was met through financing. The remainder is funded by a diverse array of non-state sources. Gift funds represent close to 12 percent of the funding while capital reserves (hospital, campus, and auxiliary reserves) represent about 26 percent.
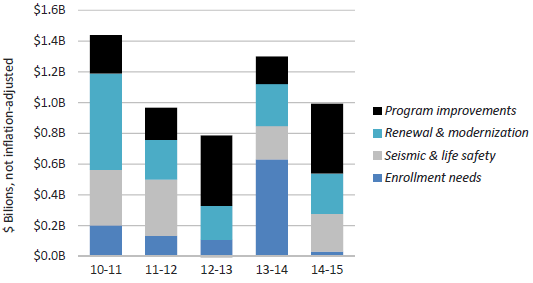
The majority of capital funds approved for expenditure between 2010–11 and 2014–15 supported projects addressing core academic programs and aging facilities.
13.1.3 Types of capital projects, Universitywide, Based on budgets approved by year, 2010–11 to 2014–15
Source: UC Capital Programs
Capital projects may address several objectives. indicator 13.1.3 illustrates the funding of types of capital projects by their primary objective.
UC has research centers, institutes and laboratories spanning the full spectrum of academic and research disciplines. In addition, UC Health includes 17 health professional schools and 11 hospitals. Modern program initiatives require state-of-the-art space, necessitating the repurposing of existing facilities or construction of new space. From 2010–11 to 2014–15, UC devoted nearly $1.6 billion to program improvements to address changes in its academic, research and clinical priorities.
As campus facilities age, they must be renewed and modernized to ensure safety, extend the useful life of the buildings and improve energy efficiency. Building systems, elevators and roofs need periodic replacement and renewal during the lifespan of a building. In the past five years, $1.6 billion has been approved for projects that address facility renewal and modernization.
The University continues to review the seismic safety of its facilities, prioritize buildings for remediation and implement seismic upgrades. From 2010–11 to 2014–15, UC devoted $1.2 billion to seismic and life-safety corrections to buildings.
Continuing enrollment growth has largely driven the University’s requirement for new teaching laboratories, classrooms, student housing and recreational facilities. In 2013–14, UC experienced a dramatic increase of funding for enrollment-driven projects. These projects were part of the first wave of projects approved using the new funding mechanism for state capital projects under the provisions of the amended California Education Code; they represent a backlog of critical projects. In the past five years, UC has approved $1.1 billion for projects that address enrollment needs.
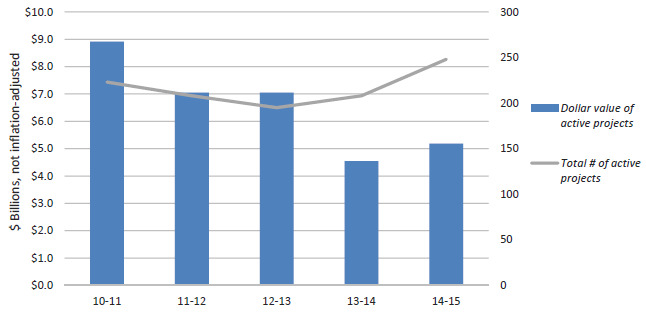
Ongoing investment in new and existing facilities is critical to support the University’s mission; the active capital portfolio has increased from last year to $5 billion and is trending toward a higher volume of lower-cost projects.
13.1.4 Active projects, Universitywide, 2010–11 to 2014–15
Source: UC Capital Programs
Active projects are those with approved budgets and that are under design or construction at the end of each fiscal year. Because capital projects typically take three to five years to design and construct, the data for any single year represents a snapshot of a process that occurs over several years.
Indicator 13.1.4 shows budget totals and the number of active capital projects at fiscal year-end for the past five years. The cumulative budget of the portfolio of 248 active projects was $5.2 billion for 2014–15. While the total number of active projects in 2014–15 increased by 19 percent over the previous year, the dollar value of active projects increased only 6 percent, indicating that the more recent projects have smaller budgets.
The University takes steps to mitigate the impact of fluctuating construction markets on project costs. These measures include matching specific project needs with the contract type and delivery method that will yield the most efficient project budget and schedule. Additionally, the University actively creates opportunities for best practices to be shared among campuses.
In the past decade, UC space has increased by over 20 percent, with most of the growth targeted for instruction and research, offices and residential uses.
13.1.5 Assignable Square Footage (ASF), Universitywide, 2005 to 2015
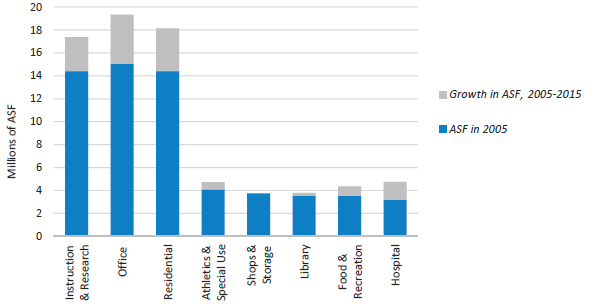
Source: UC Capital Programs
Assignable square footage (ASF) is the space available for programs or assigned to specific uses. It does not include corridors, bathrooms, or building infrastructure. Indicator 13.1.5 illustrates the growth in space over the last decade, according to categories for assignable space. Systemwide space has increased by 14.2 million ASF since 2005, representing an increase of 23 percent. This space increase is proportional to the increase in enrollment for the same period.1
Within this total, instructional, research and office space has increased by 51 percent or 7.2 million ASF. Increases in the student population have also required significant additions to athletic, recreational and food service space. Residential space has grown as campuses strive for more on-campus student housing to improve student life in living/learning communities and to reduce environmental impacts from commuting. On-campus housing can be especially important for first-year students, many of whom are the first in their families to attend college. In January 2016, President Napolitano announced the Student Housing Initiative. The goal of the Initiative is to provide an addition 14,000 affordable beds for undergraduate and graduate students across the system by 2020.
Hospital space significantly grew in the past decade. All medical centers experienced growth; however, most of the growth in hospital space can be attributed to the Ronald Regan UCLA Medical Center (2008), and UCSF Medical Center at Mission Bay and Ron Conway Family Gateway Medical Building (2015).
1Budget for Current Operations, 2016–17, Appendix Display 8: Enrollment History, 1980–81 Through 2014–15.
UC has made consistent progress toward its greenhouse gas emission goals.
13.2.1 Greenhouse gas emissions, Universitywide compared to climate goals, 2009 to 2014
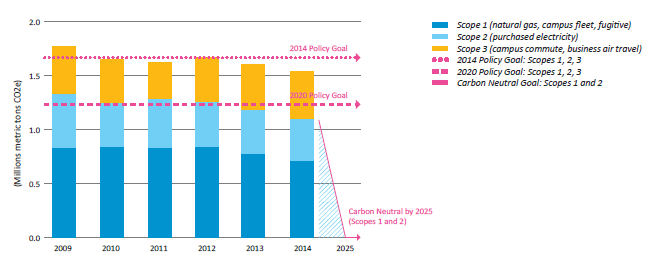
Source: UCOP Energy and Sustainability Office1
The University’s greenhouse gas (GHG) emissions totaled 1.5 million metric tons CO2e (carbon dioxide equivalent) in 2014. Forty-five percent of the total emissions came from Scope 1 sources — natural gas, campus fleet and fugitive emissions (such as refrigerants or certain gases used in research). Twenty-four percent came from Scope 2 sources — purchased electricity and steam. The final 27 percent came from Scope 3 emissions — campus commute and business air travel. Despite continued growth in building space, total emissions have been declining over the past two years. The University’s total emissions fell below 2000 levels at the close of calendar year 2014, meeting the UC policy goal for that year.
In 2014, six campuses met or exceeded the 2014 policy target. Santa Barbara and Los Angeles joined Berkeley in reducing emissions below 1990 levels, surpassing the 2020 policy goal five years early. All campuses have a climate action plan identifying measures to reduce GHG emissions. Campuses are currently in the process of updating these plans to include the 2025 carbon neutrality goal.
1 Emissions in the graph above account for Scope 1 and Scope 2 emissions, consistent with the Carbon Neutrality Initiative. Scope 1 encompasses emissions that result directly from campus activities, primarily fossil fuel combustion. Scope 2 covers emissions associated with electricity and steam generated by a third party and sold to a campus.
Energy efficiency upgrades will result in cumulative net avoided costs for the University of $166 million by the end of 2015.
13.2.2 Energy efficiency cost avoidance, Universitywide, 2005 to 2015
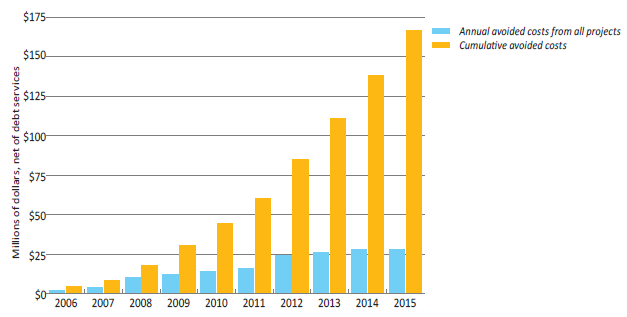
Source: UCOP Energy and Sustainability Office
In 2004, the University formed a unique statewide Energy Efficiency Partnership program with the California State University system and the state’s four investor-owned utilities to improve the energy performance of higher-education facilities. The partnership provides funding for energy system monitoring, equipment retrofits, and training and education as components of a continuous building efficiency improvement process.
In 2015, the University received approximately $6.7 million in incentives from the Partnership to implement 72 projects. Those projects are projected to save approximately 23 million kilowatt-hours (kwh) of electricity and 1.2 million therms of natural gas annually.
Energy efficiency projects since the program began in 2004 allow the University to avoid approximately $28 million in additional energy costs annually, and the program’s cumulative avoided costs should exceed $166 million by the end of 2015.
While campuses have used a portfolio approach to balance projects with shorter and longer paybacks, the future focus on the remaining deeper energy efficiency retrofits to achieve climate goals will result in lower levels of net avoided costs due to larger up-front investments.
By the end of 2015, UC had achieved 225 LEED® certifications, more than any other university in the country.
13.2.3 LEED® certifications, Universitywide, 2000-2015 (cumulative)
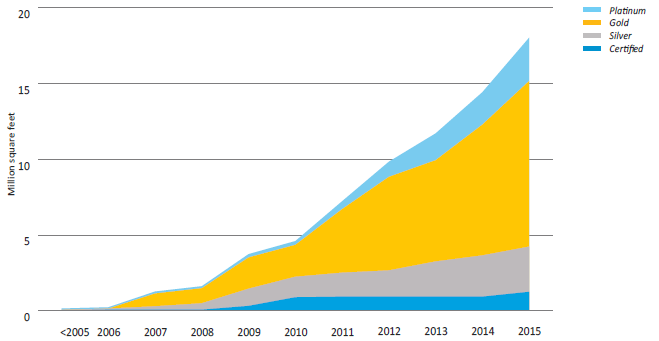
Source: UCOP Capital Resources Management
UC’s sustainability policy requires all new construction projects and renovation projects over $5 million to achieve a minimum of Leadership in Energy and Environmental Design (LEED®) Silver certification.
By the end of 2015, the University of California had 225 LEED®-certified projects, representing more than 18 million gross square feet of building space (new construction, renovation, homes and existing building certifications). In 2015, six projects earned LEED-Platinum certifications, 14 earned Gold, three earned Silver, and two earned Certified.
UC LEED® certifications are listed here.
Beyond sustainability in new construction, UC has also adopted LEED® for Existing Buildings, Operations and Maintenance (LEED®-EBOM), to “green” the day-to-day, ongoing environmental performance of its existing facilities. UC buildings have received 28 LEED®-EBOM certifications. Seven UC campuses have initiated certification for campus-wide LEED®-EBOM credits and prerequisites. The campus-wide certification option was pioneered by UC, resulting in streamlined documentation for individual projects.