Chapter 13:
Capital Program and Sustainability
UC’s capital program
The University maintains approximately 6,000 buildings enclosing 137 million gross square feet on approximately 30,000 acres across its ten campuses, five medical centers, nine agricultural research and extension centers, and the Lawrence Berkeley National Laboratory. With such a substantial infrastructure, the University strives to be a good steward of the capital resources entrusted to its care.
Sources of capital funding
UC’s capital program is funded by a combination of state and non-state funds. Historically, the majority of UC’s core academic capital projects were funded by the state. With state general obligation bonds playing a declining role in the University’s capital program over the past decade, the University has been forced to rely on other resources to fund capital projects. In the past decade, non-state funds as well as external financing that utilizes non-state sources to service the debt have accounted for 86 percent of UC’s capital program funding.
Approved Capital expenditures
During fiscal year 2015–16, UC approved capital project budgets totaling $1.2 billion. Over 80 percent of the cost of capital projects approved in 2015–16 was met through debt financing. The remaining capital projects are funded by non-state sources. The majority of these projects, as well as those going back to at least 2011–12, were aimed at core academic programs and aging facilities.
Since 2006, the space available to UC for program uses has increased by 13.5 million assignable square feet. Even more space must be added to accommodate enrollment growth and expanding programs. In addition, UC must maintain and upgrade its facilities, more than half of which are at least 35 years old, and many of which are in need of significant seismic upgrading.
UC’s sustainability program
The University of California is a national leader in sustainability. The University affirmed its leadership position in 2007 when all ten Chancellors signed the American College & University Presidents’ Climate Commitment. Furthering this leadership, in November 2013, UC announced an initiative to achieve carbon neutrality by 2025. This initiative will make UC the first major research university to achieve carbon neutrality.
The initiative builds on UC's work on climate and carbon neutrality research and furthers its leadership in sustainable business practices. UC is improving its energy efficiency, developing new sources of renewable energy and enacting a range of related strategies to cut carbon emissions.
The University’s Policy on Sustainable Practices, updated most recently in 2016, has multiple areas of focus: Climate Action, Green Building, Clean Energy, Transportation, Recycling and Waste Management, Environmentally Preferable Procurement, Sustainable Food Services, and Water, demonstrating the University’s commitment to wise stewardship of its resources and the environment.
Sustainability Successes
Successes noted in this year’s report include over $194 million in cumulative avoided energy costs via Energy Efficiency Partnership projects to date, 36.3 megawatts of on-site renewable electrical generation installed with 12.9 more megawatts planned and 252 LEED certifications, the most of any higher education institution in the country.
Off-site renewable energy capacity increased with two large scale solar projects that came online for UC’s Wholesale Power Program, part of the largest solar energy purchase by any U.S. university to date.
FOR MORE INFORMATION
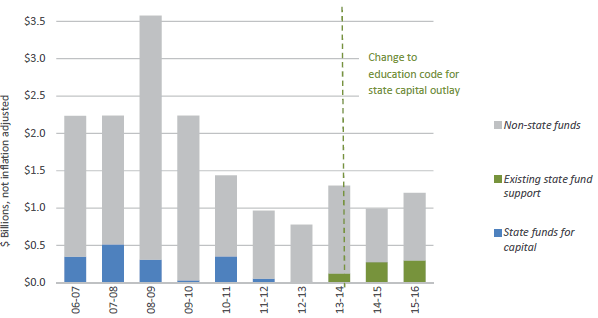
The majority of UC’s capital project funding over the last ten years continues to be derived from non-state fund sources. The last year UC received state support of any appreciable amount for its capital program was in 2011–12; starting in 2013–14, changes to the California Education Code allowed UC to direct a portion of its existing state fund support to capital.
13.1.1 Sources of capital spending, by year of approval, Universitywide, 2006–07 to 2015–16
Source: UC Capital Asset Strategies
UC’s capital program is funded by a combination of state and non-state funds. State funds were historically the primary source of funding for core academic facilities and seismic compliance for acute care hospitals. Non-state sources fund self-supporting enterprises, such as housing, parking, athletics and medical enterprises, which are generally not eligible for state funding.
As illustrated in indicator 13.1.1, the source of state funds for capital has changed. The last state General Obligation (GO) bond that benefitted the University was in 2006. The last time the University received State Lease Revenue (SLR) bond funds for capital was in 2011. GO and SLR bonds are in shown in blue and represent state funds specifically designated for capital projects.
Legislation passed in 2013–14 (Assembly Bill 94 or AB 94) enacted a major change in how UC could fund its debt service on capital outlay. Recent state capital budgets only allow UC to direct its state General Fund appropriation to fund debt service for state-eligible capital projects. These funds are shown in green and do not represent new state funding. The portion of General Funds that is directed to capital is made up of funds that historically would have been used for operations.
In the past decade, non-state resources have accounted for 86 percent of UC’s capital projects funding. To the extent that non-state funds are used to support core academic capital needs, less funding is available to support other high priority needs.
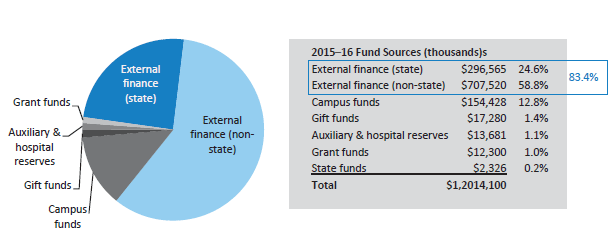
Approximately $1 billion of external financing was approved in 2015–16 to support UC’s capital program.
13.1.2 Sources of capital spending detail, Universitywide, Budgets approved in 2015–16
Source: UC Capital Asset Strategies
Financial challenges require each campus to carefully consider how to deploy resources to optimize the benefits to academic programs and the campus mission as a whole.
With state funding playing a declining role in the University’s capital program over the past decade, the University has been forced to rely on other means to fund capital projects. As noted in indicator 13.1.2, the approved state-supportable capital projects in 2015–16 employ University financing that utilizes state General Funds to service the debt. Funding for these state projects represents 30 percent of the approved UC financing in 2015–16.
In the absence of new state funding for capital, campuses have decided to fund critical projects that cannot be delayed. In these cases, campuses redirect non-state funds to projects that otherwise would have been funded with state resources.
External financing that utilizes non-state sources to service the debt continues to play a central role in funding capital needs. In the past decade, external financing support of the capital program averages at 60 percent — varying from a low of 42 percent in 2010–11 to a high of 83 percent in 2015–16.
The remainder of UC’s capital program is primarily funded by campus funds. These campus funds are derived from a variety of sources including indirect cost recovery and investment earnings. The remainder of UC’s capital program is funded by an array of non-state sources (gift funds, reserves and grants) representing 3.5 percent of the total in 2015–16. The $2.3 million of state funds are for a final phase of a capital project.
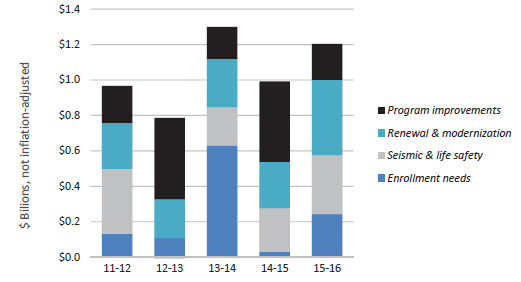
The majority of capital funds approved for expenditure between 2010–11 and 2015–16 supported projects addressing core academic programs and aging facilities.
13.1.3 Types of capital projects, Universitywide, based on budgets approved by year, 2010–11 to 2015–16
Source: UC Capital Asset Strategies
Capital projects may address several objectives. Indicator 13.1.3 illustrates the funding of capital projects by their primary objective.
UC has research centers, institutes and laboratories spanning the full spectrum of academic and research disciplines. In addition, UC Health includes 18 health professional schools and five academic medical centers. Modern program initiatives require state-of-the-art space, often necessitating the repurposing of existing facilities or construction of new space. From 2011–12 to 2015–16, UC devoted nearly $1.5 billion to program improvements to address academic, research and clinical priorities.
Campus facilities age and must be renewed and modernized to: ensure safety, extend the useful life of the buildings and improve energy efficiency. Building systems, elevators and roofs need periodic replacement and renewal during the lifespan of a building. In the past five years, $1.4 billion has been approved for projects that address facility renewal and modernization.
The University continues to review the seismic safety of its facilities, prioritize buildings for remediation and implement seismic upgrades. From 2011–12 to 2015–16, UC devoted $1.2 billion to seismic and life-safety corrections to buildings.
Continuing enrollment growth has largely driven the University’s requirement for new teaching laboratories, classrooms, student housing and recreational facilities. In the past five years, UC has approved $900 million for projects that address enrollment needs. In 2013–14, there was a dramatic increase of approvals for projects to address enrollment-driven housing needs. In 2015–16, enrollment-driven project approvals addressed instruction and research needs.
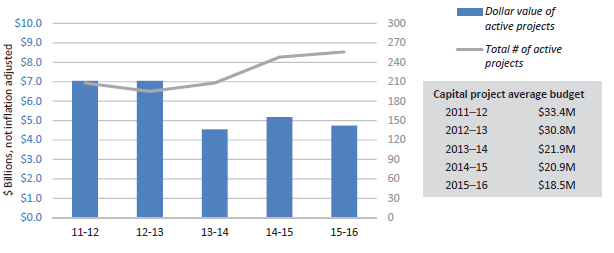
Ongoing investment in new and existing facilities is critical to support the University’s mission; the active capital portfolio is trending toward a higher volume of lower-cost projects.
13.1.4 Active projects, Universitywide, 2011–12 to 2015–16
Source: UC Capital Asset Strategies
Active projects are those with approved budgets and that are in design or construction at the end of each fiscal year. Because capital projects typically take three to five years to design and construct, the data for any single year represent a snapshot of a process that occurs over several years.
Overall, the UC campuses and medical centers continue to deliver a complex capital program that encompasses a mixture of new construction and renovation projects that include academic buildings, research facilities, medical centers, housing and infrastructure. Campuses continue to explore a variety of delivery and funding strategies to respond to local market conditions, manage risk and complete projects in furtherance of the University’s mission and the campuses’ academic and support needs.
Indicator 13.1.4 shows budget totals and the number of active capital projects at fiscal-year-end for the past five years. The indicator also shows that the average capital project budget continues to decline. This is due to, among other things, rehabilitation of existing facilities, which tend to be less costly projects.
The cumulative budget of the portfolio of 256 active projects was $4.7 billion for 2015–16. While the total number of active projects increased by approximately three percent in the last year, the total dollar value of active projects decreased by nine percent, continuing the trend of projects with a lower dollar value.
The Annual Report on Major Capital Projects Implementation, Fiscal Year 2015–16 provides the status of major capital projects including budget and schedule changes, and projects completed in the fiscal year.
In the past decade, UC space has increased by approximately 21percent, with most of the growth targeted for instruction and research, offices and residential uses.
13.1.5 Assignable Square Footage (ASF), Universitywide, 2006 to 2016
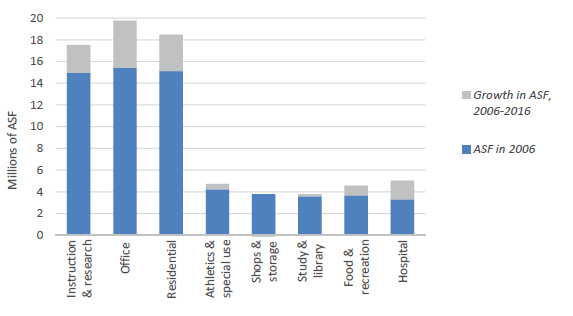
Source: UC Capital Asset Strategies
Assignable square footage (ASF) is the space available for programs or assigned to specific uses. It does not include corridors, bathrooms, or building infrastructure.
Indicator 13.1.5 illustrates the growth in space over the last decade, according to categories for assignable space. Since 2006, space has increased by 13.5 million ASF for a total of 77.6 million ASF.
Within this total, instructional, research and office space has increased by 6.9 million ASF. In the past decade, residential space increased by 3.4 million ASF. Residential space has grown as campuses strive for more on-campus student housing to improve student life in living/learning communities and to reduce environmental impacts from commuting. The space increase for instruction and research, offices and residential use is proportional to the increase in enrollment for the same period.1 Increases in the student population have also required additions to athletic, recreational and food service space.
Hospital space significantly grew in the past decade. All five medical centers experienced growth but most of the growth in hospital space can be attributed to the Ronald Regan UCLA Medical Center (2008), UCSF Medical Center at Mission Bay and Ron Conway Family Gateway Medical Building (2015), and the Jacobs Medical Center at UC San Diego Health (2016).
1Budget for Current Operations, 2017–18, Appendix Display 8: Enrollment History, 1980–81 Through 2016–17.
UC has made consistent progress toward its greenhouse gas emission goals.
13.2.1 Greenhouse gas emissions, Universitywide compared to climate goals, 2009 to 20325
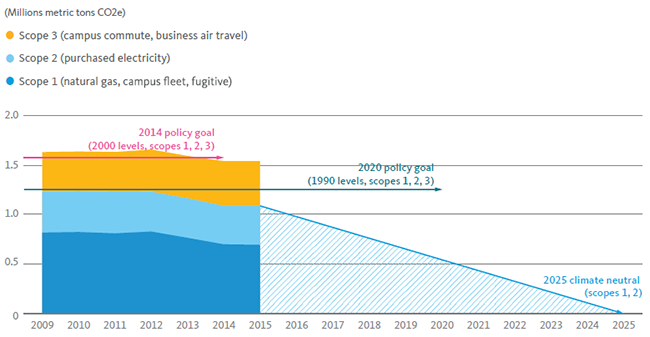
Source: UCOP Energy and Sustainability Office1
The University’s greenhouse gas (GHG) emissions totaled 1.5 million metric tons CO2e (carbon dioxide equivalent) in 2015. Forty-five percent of the total emissions came from Scope 1 sources — natural gas, campus fleet and fugitive emissions (such as refrigerants or certain gases used in research). Twenty-six percent came from Scope 2 sources — purchased electricity and steam. The final 29 percent came from Scope 3 emissions — campus commute and business air travel. Despite expanding campus built space by 14.2 million assignable square feet since 2000, total emissions have been declining over the past three years. The University’s total emissions continued to fall below 2000 levels, maintaining the 2014 UC policy goal.
In 2015, six campuses met or exceeded the 2014 policy target. Santa Barbara, Los Angeles and Berkeley have each reduced emissions below 1990 levels, surpassing the 2020 policy goal five years early. All campuses have a climate action plan identifying measures to reduce GHG emissions. Campuses are currently in the process of updating these plans to include the 2025 carbon neutrality goal.
1 Emissions in the graph above account for Scope 1 and Scope 2 emissions, consistent with the Carbon Neutrality Initiative. Scope 1 encompasses emissions that result directly from campus activities, primarily fossil fuel combustion. Scope 2 covers emissions associated with electricity and steam generated by a third party and sold to a campus.
Energy efficiency upgrades resulted in cumulative net avoided costs for the University of $194 million by the end of 2016.
13.2.2 Energy efficiency cost avoidance, Universitywide, 2005 to 2016
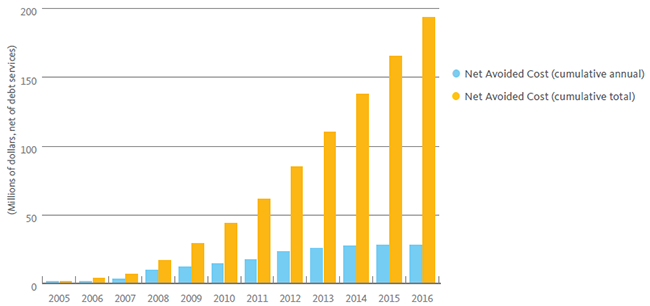
Source: UCOP Energy and Sustainability Office
In 2004, the University formed a unique statewide Energy Efficiency Partnership program with the California State University system and the state’s four investor-owned utilities to improve the energy performance of higher-education facilities. The partnership provides funding for energy system monitoring, equipment retrofits, and training and education as components of a continuous building efficiency improvement process.
In 2016, the University received approximately $4.4 million in incentives from the Partnership to implement 45 projects. Those projects are projected to avoid over $550,000 annually in utility bill costs. Energy efficiency projects since the program began in 2004, allow the University to avoid approximately $28 million in additional energy costs and the program’s cumulative avoided costs exceeded $194 million by the end of 2016.
While campuses have used a portfolio approach to balance projects with shorter and longer paybacks, the future focus on the remaining deeper energy efficiency retrofits to achieve climate goals will result in lower levels of net avoided costs due to larger up-front investments.
By the end of 2016, UC had achieved 252 LEED® certifications, more than any other university in the country.
13.2.3 LEED® certifications, Universitywide, 2000-2016 (cumulative)
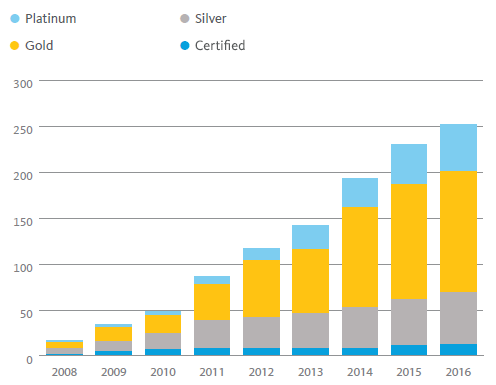
Source: UCOP Capital Resources Management
UC’s sustainability policy requires all new construction projects and major renovation projects to achieve a minimum of Leadership in Energy and Environmental Design (LEED®) Silver certification.
By the end of 2016, the University of California had 252 LEED®-certified projects, representing more than 20 million gross square feet of building space (new construction, renovation, homes and existing building certifications). In 2016, eight projects earned LEED® Platinum certifications, six earned Gold, six earned Silver, and two earned Certified.
UC LEED® certifications are listed here.
Beyond sustainability in new construction, UC has also adopted LEED® for Existing Buildings, Operations and Maintenance (LEED®-EBOM), to “green” the day-to-day, ongoing environmental performance of its existing facilities. UC buildings have received 37 LEED®-EBOM certifications.