Goals
One of the University of California’s highest priorities is to ensure that a UC education remains accessible to all Californians who meet its admissions standards. This goal is articulated in California’s Master Plan for Higher Education, which calls for UC to admit all eligible freshmen and transfers, with freshman eligibility designed to capture the top 12.5 percent of California public high school graduates. It also calls for UC to admit all qualified transfer students from California Community Colleges (CCCs).
Of the nearly 218,000 applications for admission in fall 2019, about 177,000 students applied as freshmen and over 41,000 as transfers. Campus admission decisions are based on a comprehensive review of qualifications and establish the incoming California resident class size based on state funding. Over the last five years, UC’s enrollment of California residents increased by more than 16,000: 2,500 in fall 2019, 3,000 in fall 2018, 4,000 in fall 2017, and 7,000 in the prior two years combined.
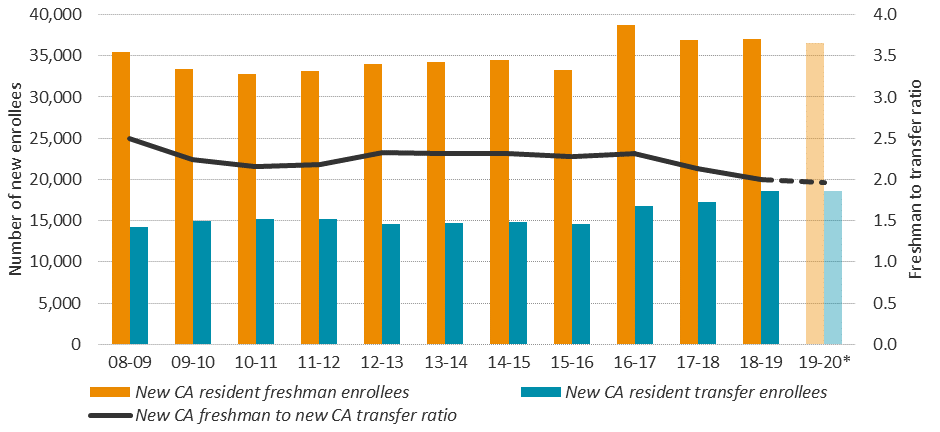
For 2019–20, UC is also estimated to have achieved its goal of enrolling a 2:1 ratio of freshman to transfer California resident undergraduates, excluding Merced, for the third year in a row. The UC Transfer Pathways program supports this goal by helping community college students prepare for transfer admission to the most popular majors at UC campuses. Under a new agreement with the California Community Colleges, UC has created a Transfer Guarantee program, Pathways+, for community college students who meet certain criteria.
Admissions — freshmen
UC utilizes a comprehensive review process to make admission decisions, considering not only completion of rigorous college preparatory courses and high school GPA, but also talents, special projects, accomplishments in light of life experiences and circumstances, extracurricular activities, and community service.
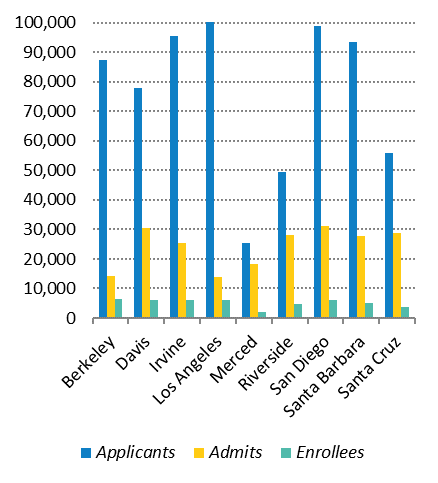
The rapid growth in freshman applications to UC over the past two decades demonstrates the increased demand for a college education, the growth of California’s population, and UC’s continued popularity. UC continues to reach its Master Plan goals by guaranteeing admission to California resident applicants who are either in the top nine percent of high school graduates statewide or the top nine percent of graduates from their own high schools. Qualified freshman applicants are offered an opportunity to be admitted to another UC campus if they do not receive an offer of admission from the UC campuses where they applied.
Admissions — transfers
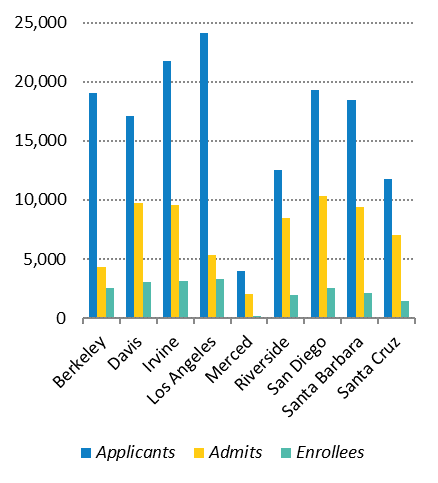
Almost all transfer students enter UC as upper-division juniors. Campus enrollment targets are based on state funding as well as capacity in major programs at the upper-division level.
UC’s Transfer Pathways identify a common set of lower-division courses for each of 20 of the most popular majors among transfer applicants. The Transfer Pathways present a clear roadmap for prospective transfers to prepare for their majors and be well positioned to graduate in a timely fashion from any UC campus. In fall 2019, the third year of the Transfer Pathways, those indicating Pathway-based preparation represented 41 percent of all CCC admits and 35 percent of all CCC enrollees. Many of these students also participated in other preparatory programs such as Transfer Admissions Guaranteed (TAG) and Intersegmental General Education Transfer Curriculum (IGETC).
| Transfer Pathways Majors |
| Anthropology |
Computer Science |
Mechanical Engineering |
| Biochemistry |
Economics |
Molecular Biology |
| Biology |
Electrical Engineering |
Philosophy |
| Business Administration |
English |
Physics |
| Cell Biology |
History |
Political Science |
| Chemistry |
|
Psychology |
| Communication |
|
Sociology |
In April 2018, UC signed an agreement with the California Community Colleges (CCCs) to guarantee a place within the UC system to students who complete one of the Transfer Pathways and achieve the requisite grade point average (GPA). Almost all transfer students enter UC as upper-division juniors. Campus enrollment targets are based on state funding as well as capacity in major programs at the upper-division level. Fall 2018 marked the largest class of transfer entrants (1.1.2).
Enrollments
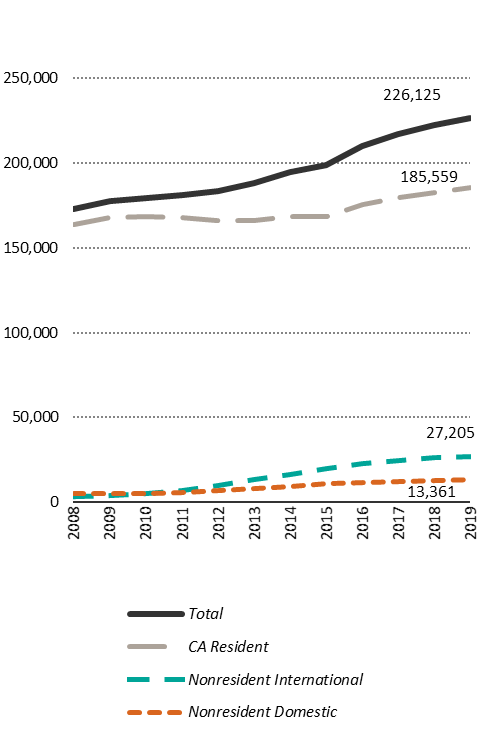
The University enrolled 222,000 undergraduates in fall 2018. The University enrolls freshman and transfer students from almost every county of California. UC’s Eligibility in the Local Context (ELC) policy is designed to increase the overall geographic diversity of freshman entrants. This goal was also addressed as a recommendation in the University’s 2014 Transfer Action Team report.
Undergraduate Enrollment, Fall 2019
New Freshmen: 45,948
New Transfers/Other: 21,048
Continuing Students: 59,129
TOTAL: 226,125
Source: UC Data Warehouse. Other types of new students include those enrolling for a second baccalaureate or with limited status (not seeking a bachelor’s degree).
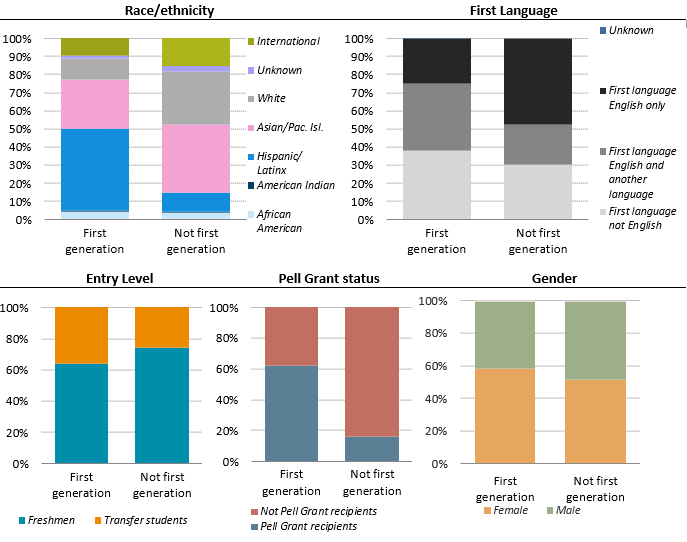
As academic qualifications have improved over the last decade, UC has maintained access for populations historically underserved by higher education. In fall 2019, 35 percent of new undergraduates received Pell Grants, a marker for low-income status. About 40 percent of UC’s entering students are first-generation, meaning neither parent graduated from a four-year college. These students are more likely to be from an underrepresented group (URG, African American, Latinx and Native American/Alaska Native students), to have a first language other than English, to enter as a transfer student, to be female, and/or to have a lower income than students with at least one parent who graduated from a four-year college (1.2.1).
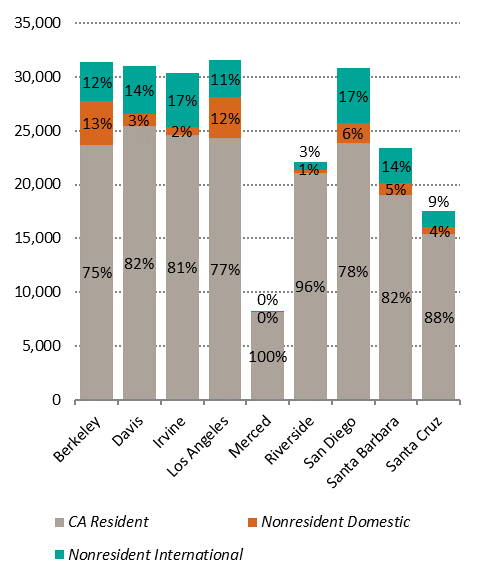
The share of all undergraduates who are nonresident domestic and international students has increased in recent years, though their proportion is still much lower than at comparable public research universities. In 2018–19, the share of new undergraduates paying nonresident tuition went up slightly. In May 2017, UC adopted a policy affirming that nonresident undergraduates “will continue to be enrolled in addition to, rather than in place of, funded California undergraduates at each campus.” The policy also capped nonresident enrollment at 18 percent for five UC campuses (Davis, Merced, Riverside, Santa Barbara, and Santa Cruz) and, for the remaining four campuses (Berkeley, Irvine, Los Angeles, and San Diego), at the proportion each campus enrolled in 2017–18. The policy went into effect for the 2018–19 academic year.
Having California students learn and live alongside students from backgrounds and cultures different from their own is part of a world-class educational experience. California students also benefit from the extra tuition paid by nonresident undergraduates, which is about $30,000 more per year than the amount paid by residents. That tuition helps to fund faculty hires, instructional technology, student advising, and other services that directly benefit California students.
Admissions and enrollment trends
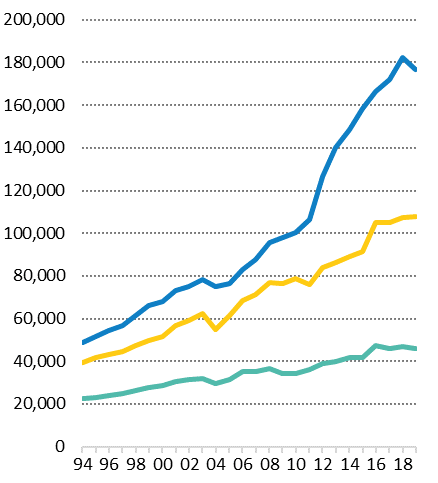
Freshman applicants have nearly tripled over the past two decades, averaging five percent growth per year. In fall 2019, the number of applicants decreased three percent compared to the previous year, while the number of students admitted went up less than half a percent and the number of enrollees went down two percent (1.1.1).
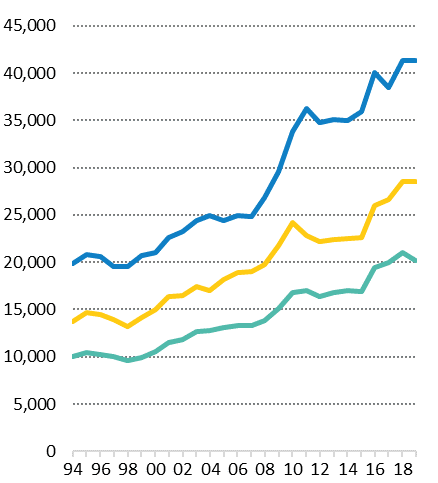
Fall transfer applicants nearly doubled over the last 20 years, with average annual growth of four percent. In fall 2019, transfer applicants and admits both decreased by less than half a percent compared to the previous year, while enrollees went down four percent after the largest transfer class entered the University in 2018 (1.1.2).
The Master Plan specifies that the University maintain a 60:40 ratio of upper-division to lower-division students, which corresponds to a 2:1 ratio of new California resident freshmen to new California resident transfers. UC has moved from 2.3:1 in 2016–7, to an estimated 2.0:1 in 2019–20 (Universitywide). The Universitywide ratio excluding Merced is estimated to be 1.9:1 for 2019–20, achieving the systemwide goal for this metric for a third year. The University continues to work toward achieving this ratio for each campus (except Merced) (1.1.3). Overall undergraduate enrollment (new and continuing students) continued to grow in fall 2019. Total enrollment was over 226,000 in fall 2019, up two percent from the year before. This includes an increase in California residents of over 2,500, following increases of over 7,000 in fall 2016, over 4,000 in fall 2017, and over 3,000 in fall 2018 (1.1.4).
Academic preparatioN
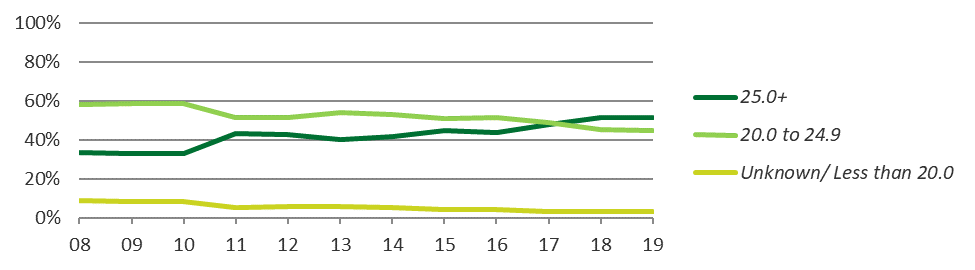
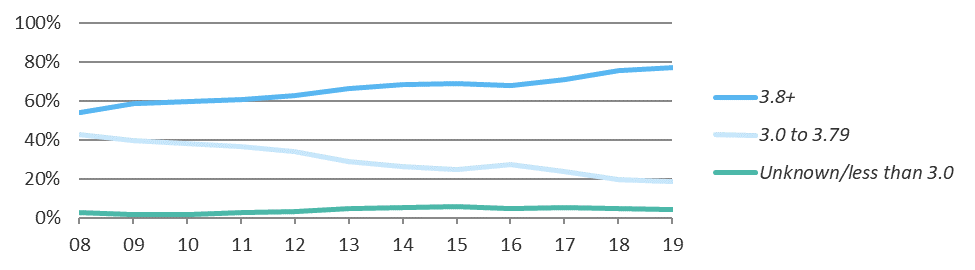
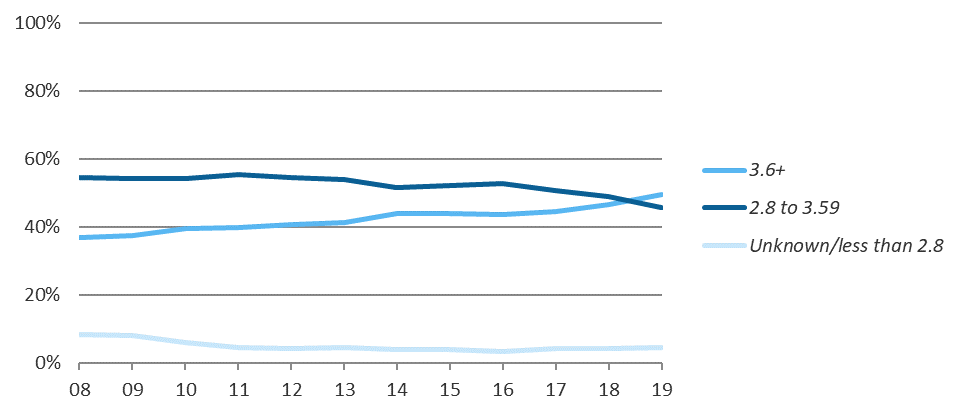
Freshmen entering UC are increasingly well prepared, as shown by changes in the number of college preparatory courses, high school GPA, and test scores over time (1.3.1). Transfer students are also increasingly well prepared, as measured by college GPA (1.3.2).Geographic origins and nonresidents
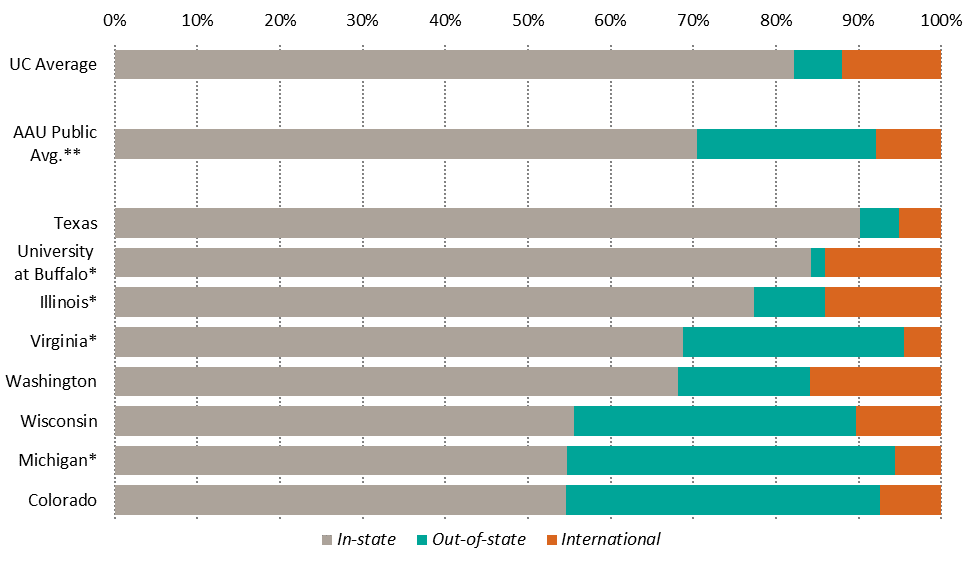
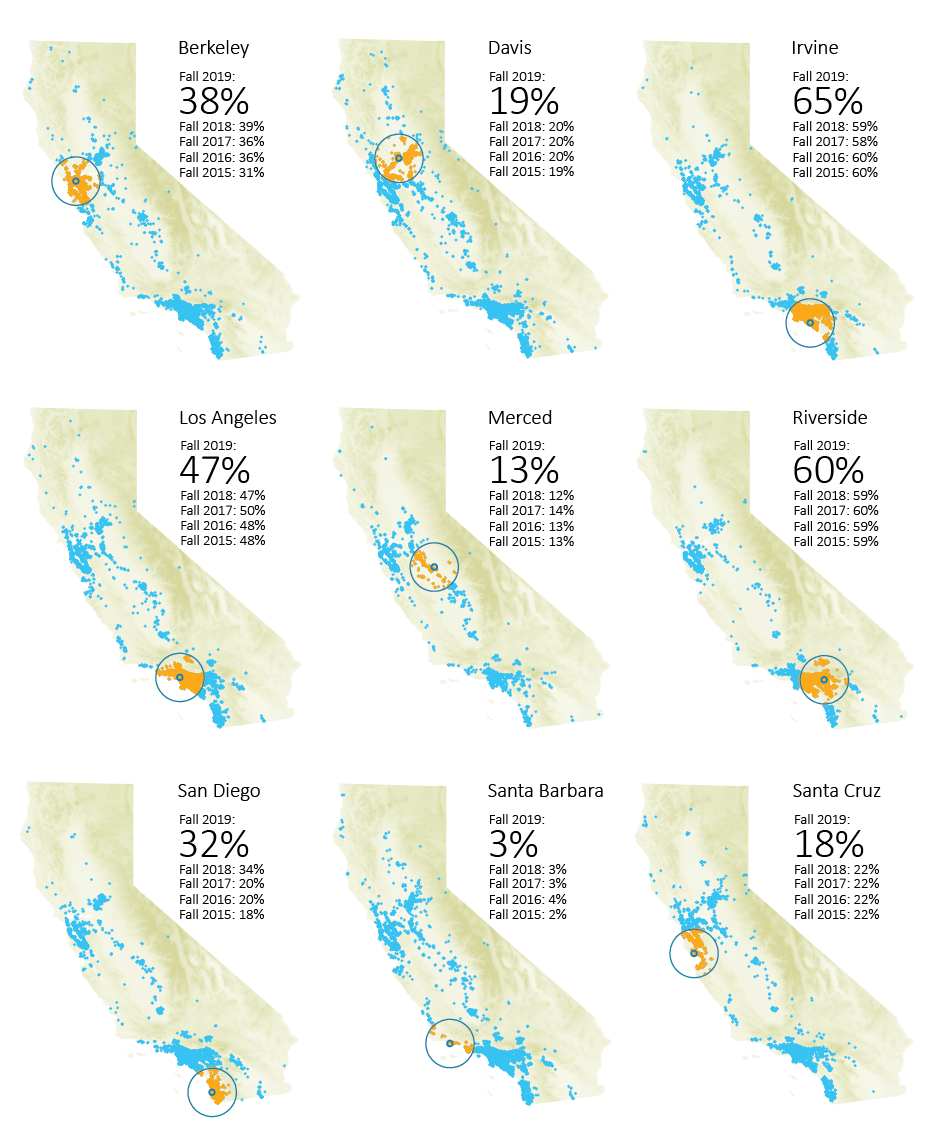
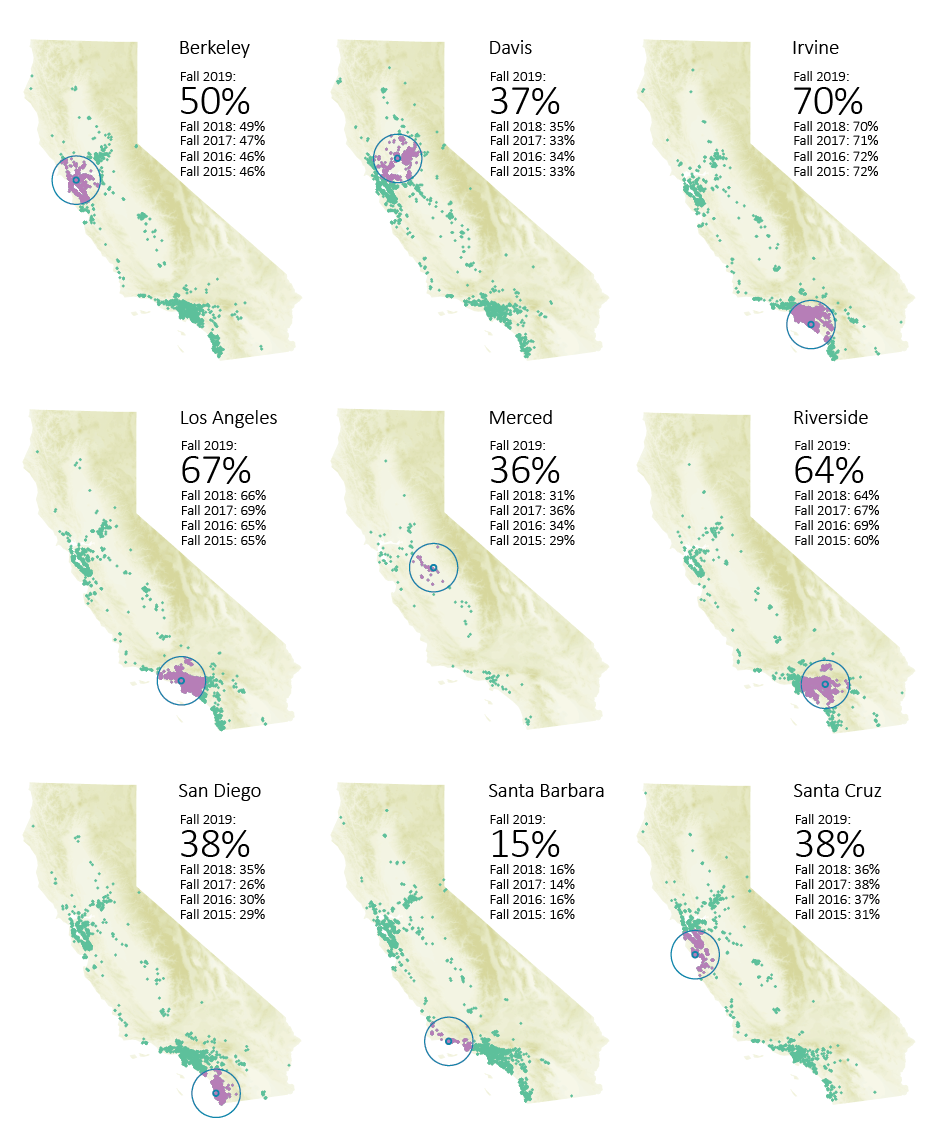
UC has a lower proportion of out-of-state undergraduates than other public AAU universities. In fall 2019, only 17.9 percent of UC’s enrollees were out-of-state or international, compared with 29.5 percent for other AAU public institutions (1.4.1). About 36 percent of freshmen and 47 percent of transfer students entering UC campuses come from within 50 miles of campus. These numbers are relatively stable and have risen only slightly over the past few years (1.4.2, 1.4.3).
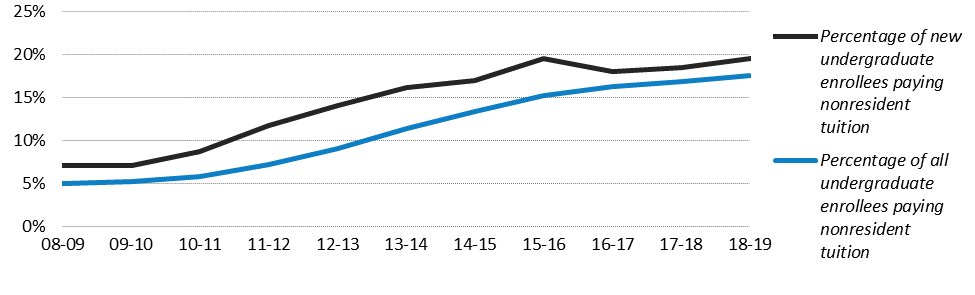
The percentage of all undergraduates paying nonresident tuition has gone up in recent years. The proportion of new undergraduate students paying nonresident tuition went up slightly in 2018–19 (1.4.4).
Looking ahead
The University of California Board of Regents at its May 2020 meeting unanimously approved the suspension of the standardized test requirement for all California freshman applicants until fall 2024, providing time for the University to create a new test that better aligns with A–G curricular standards. However, if a new test does not meet specified criteria in time for fall 2025 admission, UC will eliminate the standardized testing requirement for California students. This year’s Accountability Report will not include ACT and SAT measures and next year’s report will include indicators that better align with goals of UC’s new test.
It is unclear how fall 2020 enrollment may be affected by the COVID-19 pandemic, though early indicators continue to show strong demand for students to enroll at UC.
For more information
Data on UC admissions: