Chapter 1:
Undergraduate Students — Admissions and Enrollment
goals
One of the University of California’s highest priorities is to ensure that a UC education remains accessible to all Californians who meet its admissions standards. This goal is articulated in California’s Master Plan for Higher Education, which calls for UC to admit all eligible freshmen and transfers with freshman eligibility defined to capture the top 12.5 percent of California public high school graduates. It also calls for UC to admit all qualified transfer students from California Community Colleges (CCCs).
Of over 200,000 applications, nearly 167,000 students applied as freshmen and 40,000 as transfers for fall 2016. Campus admission decisions are based on a comprehensive review of qualifications and establish the incoming California resident class size based on state funding. Increased state support allowed the University to enroll over 7,000 additional California residents (freshmen and transfers) in fall 2016 compared to fall 2015 — the biggest increase since World War II.
The University received $20 million in one-time funding in the 2016–17 state budget to support the admission, enrollment and success of underrepresented minority and low-income students, particularly those from high schools with a high concentration of students who are foster youth, English learners, and/or eligible for free or reduced-price meals. These funds supported campus programs serving an estimated 29,000 students from such high schools already enrolled at UC, as well as expanded outreach to potential future students.
UC’s goal is to enroll entering cohorts that are close to a 2:1 ratio of freshman to transfer students. The UC Transfer Pathways program supports this goal by helping community college students prepare for transfer admission to the most popular majors at UC campuses.
Admissions trends — freshmen
Freshman applicants have more than tripled over the past two decades, averaging six percent growth per year. With increases in high school graduation rates, particularly among Hispanic/Latino(a) students, the University expects continued growth in demand. For fall 2016, the number of applicants increased five percent and the number of students admitted went up 15 percent.
UC relies on a comprehensive review process to make admission decisions, considering not only completion of rigorous college preparatory courses, high school GPA and standardized test scores but also talents, special projects, accomplishments in light of life experiences and circumstances, extracurricular activities and community service.
Although restricted state funding means that certain campuses have admitted a lower percentage of applicants in recent years, the admit rate for freshman applicants increased on all campuses for fall 2016. UC continues to reach its Master Plan goals by guaranteeing admission to applicants from California who are either in the top nine percent of high school graduates statewide or the top nine percent of graduates from their own high school. Qualified freshman applicants are offered an opportunity to be admitted to another UC campus if they do not receive an offer of admission from the UC campuses where they applied.
Admissions trends — transfers
Fall transfer applicants doubled over the last 20 years, with a record high of almost 40,000 applicants for fall 2016, an 11 percent increase over the prior year. The number of students admitted increased 15 percent to a little over 26,000.
The University has strengthened and streamlined the transfer pathway between CCCs and UC. President Napolitano’s Transfer Initiative has begun implementing the recommendations of the Transfer Action Team’s 2014 report. For example, the Academic Senate created major-specific UC Transfer Pathways for 21 of UC’s most popular majors. Each Pathway provides a single set of courses community college students can take to prepare for admission to a specific major across any of UC’s nine undergraduate campuses. Almost all transfer students enter UC as upper-division juniors. Campus enrollment targets are based on state funding as well as capacity in major programs at the upper-division level.
Enrollments
The University enrolled over 200,000 undergraduates in fall 2016. The University enrolls freshman and transfer students from every county of California, but students tend to enroll in campuses closer to their residence. One of the goals of UC’s Eligibility in the Local Context (ELC) program and the president’s Transfer Initiative is to increase the geographic diversity of entrants.
| Undergraduate Enrollment, Fall 2016 |
| New Freshmen |
47,411 |
| New Transfers |
19,685 |
| Continuing Students |
143,074 |
| TOTAL |
210,170 |
Source: UC Data Warehouse
The Master Plan specifies that the University maintain a 60:40 ratio of upper-division to lower-division students, which corresponds to a 2:1 ratio of new California resident freshmen to new California resident transfers. UC has moved closer to that ratio, from 2.32:1 in 2012–13 to 2.27:1 in 2015–16 (universitywide). The universitywide ratio (excluding Merced) is estimated to rise slightly from 2.16 to 2.20 for 2016-17. This is primarily because UC increased enrollment of California resident freshmen by 17 percent as part of UC's plan to increase access.
As academic qualifications have improved over the last decade, UC has maintained access for populations historically underserved by higher education. In fall 2016, 38 percent of new undergraduates received Pell Grants, a marker for low-income status, and 43 percent did not have parent(s) who completed a four-year college degree.
The number of nonresident domestic and international students has increased in recent years, though their proportion is still much lower than at comparable public research universities. Having California students learn and live alongside students from backgrounds and cultures different from their own is part of a world-class educational experience. California students also benefit from the extra tuition paid by nonresident undergraduates, which is about $27,000 more than the amount paid by residents. That tuition helps to fund faculty hires, instructional technology, student advising and other services that directly benefit California students.
Looking Ahead
he University is committed to sustaining access and educating as many California residents as it can. UC plans to increase enrollment of California residents by 10,000 full-time equivalent (FTE) students over the three years from 2016–17 to 2018–19. It began by enrolling more than 7,000 additional California residents (freshman and transfer students) in fall 2016 with plans to enroll 2,500 additional California resident students in each of the next two years.
For more information
Demand for UC continues to grow.
1.1.1 Freshman applicants, admits and enrollees, Universitywide, Fall 1994 to 2016
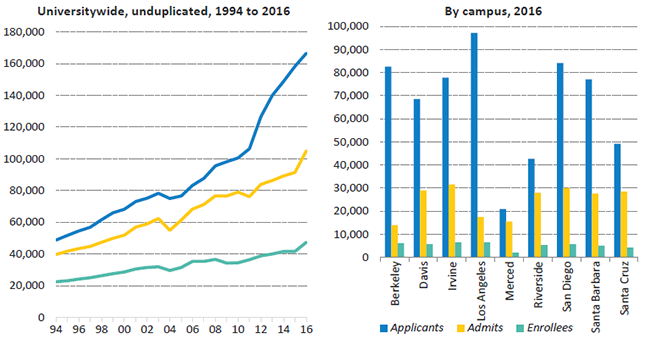
Source: UC Data Warehouse and UC Corporate Student System 1
The rapid growth in freshman applicants to UC over the past two decades demonstrates the increased demand for college education, the growth of California’s population and UC’s continued popularity. UC maintains its obligations under the Master Plan by guaranteeing admission to all qualified students.
From 2011 to 2016, unduplicated freshman applicants grew 57 percent (or about nine percent per year) from about 106,000 to about 167,000, compared to a 42 percent increase in the seven-year period between 2004 and 2011 (or about five percent per year) from 75,000 to 106,000. The 57 percent growth represents about 60,000 applicants, split almost evenly between California residents, domestic nonresidents and international students.
Some qualified applicants who are not offered admission at the campus(es) to which they applied to are offered admission to another campus by a referral process. A change in accounting for referral students is responsible for the apparent drop in 2011 admits. Beginning that year, UC Merced admitted only students who indicated interest in a referral offer, rather than every student who qualified for an offer.
Most campuses admit less than half of applicants. Many applicants apply to more than one UC campus. In fall 2016, each UC applicant applied to an average of 3.6 campuses. Freshman applicants, admits and enrollees increased on all campuses in fall 2016. For data tables on UC freshman applicants, admits and enrollees by campus over time see: www.universityofcalifornia.edu/infocenter/admissions-residency-and-ethnicity.
After a few years of fluctuation, transfer applicants, admits and enrollees increased to record levels in 2016.
1.1.2 Transfer applicants, admits and enrollees, UC campuses, Fall 1994 to 2016
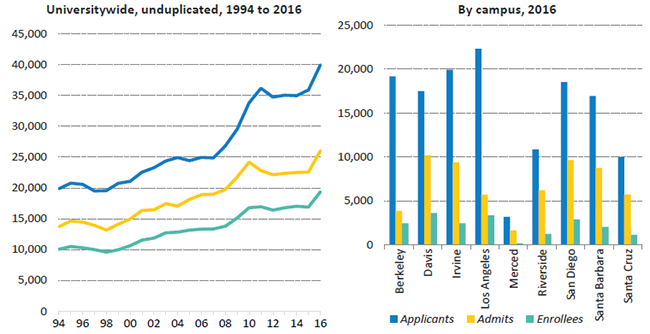
Source: UC Data Warehouse and UC Corporate Student System1
Applications, admits and enrollees surged to record levels in 2016 as the University increased California resident enrollment. Nearly 40,000 transfer students applied, over 26,000 were admitted and over 19,000 enrolled in fall 2016. Consistent with UC’s commitment to transfer students from California Community Colleges (CCCs), the fall enrollment of new CCC California resident transfers has increased 83 percent since 1994 (from 8,400 to 15,400).
In June 2012, the UC Academic Senate approved a restructuring plan to clarify the transfer process for students from CCCs and also improve their readiness for UC, laying the foundation for the Transfer Action Team’s recommendations, which the University has begun implementing.
A key recommendation was the creation of the UC Transfer Pathways, which provide an outline of CCC courses in order for students to be prepared for admission to one of the 21 most popular majors at any UC campus:
| TRANSFER PATHWAYS MAJORS |
| Anthropology |
Economics |
Philosophy |
| Biochemistry |
Electrical engineering |
Physics |
| Biology |
English |
Political science |
| Business administration |
Film and media studies |
Psychology |
| Cell biology |
History |
Sociology |
| Chemistry |
Mathematics |
|
| Communication |
Mechanical engineering |
|
| Computer science |
Molecular biology |
|
Data on transfer pathways usage in fall 2017 will be available next year. For data tables on UC transfer applicants, admits and enrollees by campus see:
www.universityofcalifornia.edu/infocenter/admissions-residency-and-ethnicity.
UC continues to work toward achieving its goal of a 2:1 ratio of California resident freshmen to transfer students.
1.1.3 New freshmen and transfer students, Universitywide, 2007–08 to 2016–17
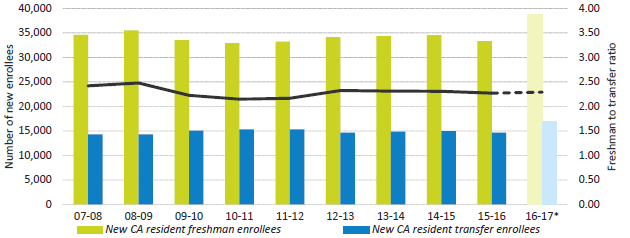
Source: UC Corporate Student System and UC campuses1
The Master Plan calls for UC to accommodate all qualified resident California Community College (CCC) transfer students. It specifies that the University maintain at least a 60:40 ratio of upper-division (junior- and senior-level) to lower-division (freshman- and sophomore-level) students to ensure adequate upper-division spaces for CCC transfers. To do so, UC aims to enroll one new California resident transfer student for every two new California resident freshmen, or 67 percent new resident freshmen to 33 percent new resident transfer students. UC has moved closer to that ratio, from 2.32:1 in 2012–13 to 2.27:1 in 2015–16 (universitywide). As part of the commitment to add at least 5,000 additional California resident undergraduates in 2016–17, UC enrolled the largest transfer class ever in 2016–17. California resident transfers increased by 15 percent, or over 2,000 students. However, the universitywide ratio (excluding Merced2) is estimated to rise slightly from 2.16 to 2.20 for 2016–17. This is because UC increased enrollment of California resident freshmen by 17 percent as part of the plan to increase access. Over nine in ten (92 percent) of California resident transfer students in fall 2016 came from CCCs.
| 2016-17* |
% New CA
resident freshmen |
% New CA
resident transfers
|
Ratio of new CA freshmen
to new CA transfers |
| Berkeley |
67% |
33% |
2.04 |
| Davis |
60% |
40% |
1.48 |
| Irvine |
69% |
31% |
2.27 |
| Los Angeles |
64% |
36% |
1.76 |
| Merced |
91% |
9% |
9.82 |
| Riverside |
82% |
18% |
4.49 |
| San Diego |
66% |
34% |
1.93 |
| Santa Barbara |
71% |
29% |
2.41 |
| Santa Cruz |
77% |
23% |
3.26 |
Universitywide
all campuses |
70% |
30% |
2.29 |
Universitywide
excl. Merced |
69% |
31% |
2.20 |
1Enrollment numbers include applicants to fall, winter and spring terms. * The actual figures for 2016-17 are not yet available and may differ from the estimated figures shown here.
2 Merced is excluded from the 2:1 ratio goal that is part of the Budget Framework agreement with the Governor.
UC’s fall undergraduate headcount grew by six percent between fall 2015 and fall 2016, mostly due to increased California resident enrollment.
1.1.4 Undergraduate headcount enrollment, Universitywide, Fall 1999 to fall 2016
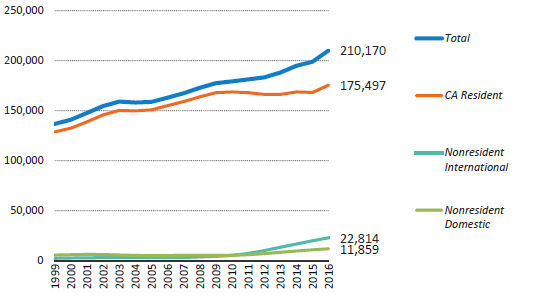
Source: UC Data Warehouse
The University and the state share the goal of expanding access to a UC education. Increased state support allowed the University to enroll over 7,000 additional California residents in fall 2016 compared to fall 2015 — the largest one-year increase since the end of the Second World War.
This rapid growth in a single year following years of constrained resources has caused several challenges, including limited resources for instruction, increased demand for advising and other student services, housing shortages, and a growing imbalance between graduate and undergraduate enrollment.
Undergraduate enrollment increased by six percent from fall 2015 to fall 2016, while graduate student enrollment increased by only three percent, the sixth consecutive year of faster growth among undergraduates. This trend is worrisome due to the important roles that graduate students play. Graduate students educate and mentor undergraduate students, attract the most talented faculty members, and contribute to the University’s research mission and, upon graduation, to the skill base and economy of the state of California.
UC’s entering first-generation students are more likely to be from an underrepresented minority (URM) group, to have a first language other than English, to enter as a transfer student and/or to have a lower income than students with at least one parent who graduated from college.
1.2.1 Entering students by first-generation status, race/ethnicity, first language spoken at home, Pell Grant receipt and entering level, Universitywide, Fall 2016
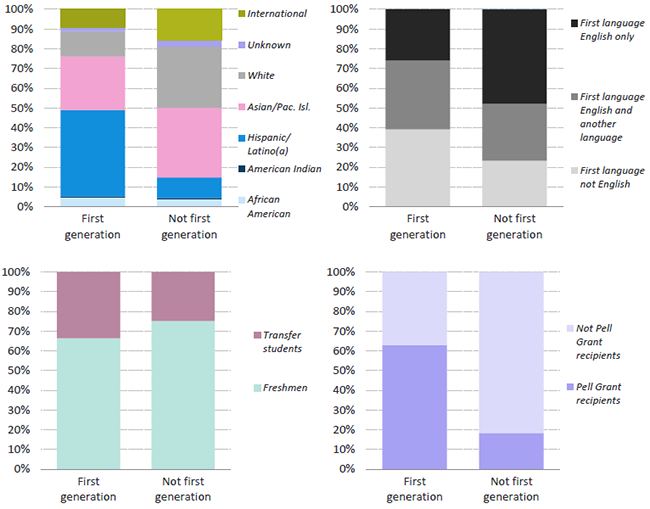
Source: UC Corporate Student System and UC Data Warehouse1
Almost half (49%) of entering first-generation students in fall 2016 are URMs, compared to 15% of non-first-generation students. Nearly four-tenths (39%) of first-generation students’ first language was not English, versus 23% for others. Over one-third (34%) of first-generation students entered as transfers, versus 25% for others. And nearly two-thirds of first-generation students are lower-income Pell Grant recipients, versus 18% for others.
There are substantial differences in the racial/ethnic and income profiles for students entering UC via the freshman versus transfer paths.
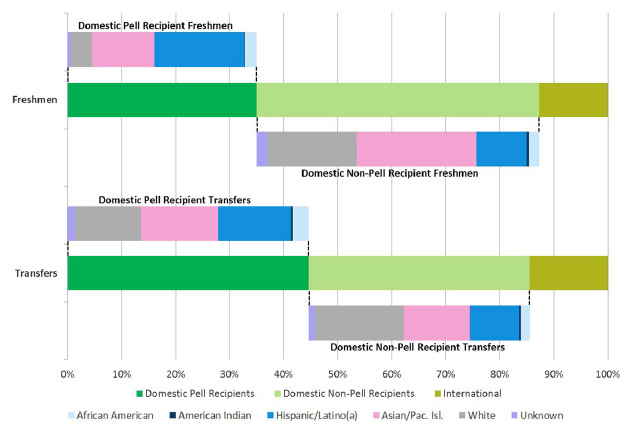
1.2.2 Entering undergraduates by Pell Grant status1 and race/ethnicity, by class level, Universitywide, Fall 2016
Source: UC Corporate Student System
Both the freshman and transfer routes are used by students of all racial/ethnic and income groups.
Students receiving Pell Grants, a marker for low-income status, constitute a larger proportion of the incoming transfer class (45 percent) than of the entering freshman class (35 percent), while the opposite is true for domestic non-Pell recipients (41 percent of transfers vs. 52 percent of freshmen).1
Among Pell recipients, Hispanic/Latino(a) students are more prevalent in the incoming freshman class than in the entering transfer class (48 percent vs. 30 percent), while white students are more prevalent in the transfer class than the freshman class (28 percent vs. 12 percent). Among non-Pell recipients, Asian/Pacific Islander students are more prevalent in the freshman class than in the transfer class (42 percent vs. 30 percent), while for white students, the opposite is true (40 percent vs. 26 percent).
1International students cannot receive Pell Grants, so they are shown as a separate category. Note that Pell Grant eligibility criteria change annually because of the federal appropriations process and other formula changes. Thus, trend analysis of Pell recipients would not be a valid measure of changes in low-income students but rather would reflect the changes in eligibility criteria.
Freshmen entering UC are increasingly well-prepared.
1.3.1 A–G (college preparatory)1 courses; weighted, capped high school grade point average (GPA)2; and standardized test scores3 of entering freshmen, as share of class, Universitywide, Fall 2000 to fall 2016
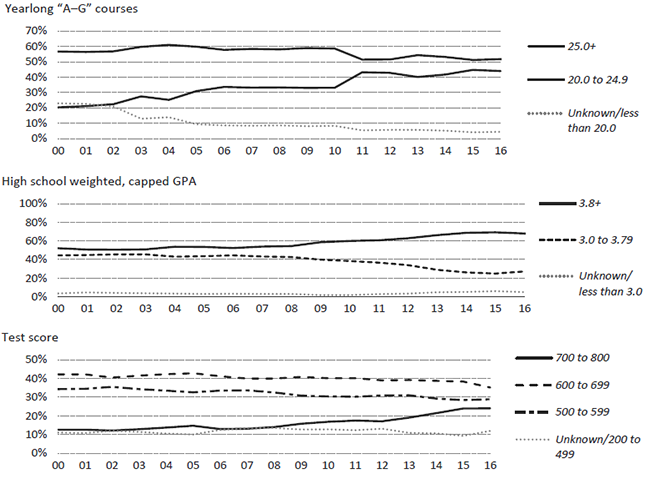
Source: UC Corporate Student System (A-G courses and test score) and UC Information Center Data Warehouse (GPA)
The academic qualifications of UC entering freshmen have improved over time, as reflected by an increase in the share of students completing 25 or more college-preparatory courses, having a 3.8 or higher high school GPA, and scoring 700 or higher on standardized entrance exams (SAT/ACT). From 2000 to 2016, these indicators went up from 20 percent to 44 percent, 52 percent to 68 percent and 13 percent to 24 percent, respectively. UC uses both weighted and unweighted GPAs to evaluate freshman applicants. A weighted GPA provides extra credit for succeeding in advanced-level courses. On a 4 point GPA scale, an A in such a course receives 5 points, a B 4 points and so forth. In other college preparatory courses, an A counts for 4 points, a B for 3 and so forth. For UC eligibility purposes, the weighted, capped GPA is used and includes this extra credit for a maximum of eight semester-long courses.
1 A–G courses refer to those high school courses that UC has reviewed and approved as college preparatory.
2 Weighted, capped GPA means that students may receive a maximum of eight semesters of honors credit. More information is available here.
3 Test scores are the highest of either SAT or ACT scores. ACT scores are converted to the 800 SAT scale. From 2000 to 2005, SAT scores are the average of SAT I Math and Verbal scores. From 2006 onward, SAT scores are the average of SAT math and critical reading scores.
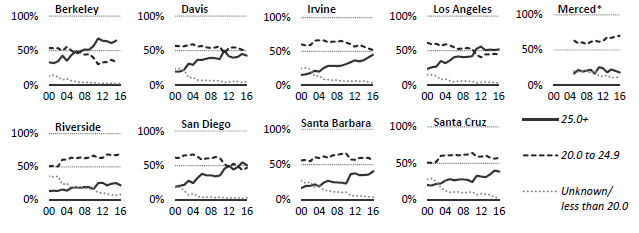
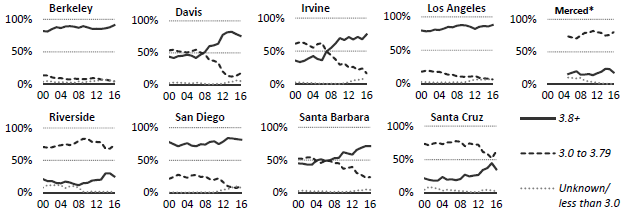
1.3.2 A–G (college preparatory)1 courses of entering freshmen by campus, as share of class, Fall 2000 to fall 2016
1.3.3 High school weighted, capped GPA of entering freshmen by campus, Fall 2000 to fall 2016
1.3.4 SAT reading and math scores, 25th to 75th percentile, UC campuses and comparison institutions2, Fall 2015
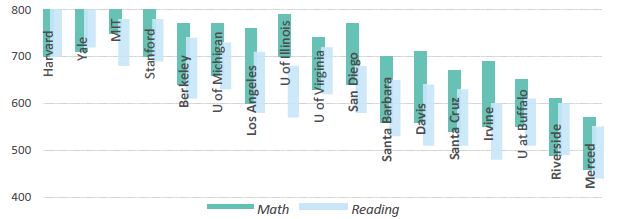
Source: IPEDS (SAT scores) and UC Information Center Data Warehouse (A–G courses and GPA)
1 A–G courses refer to those high school courses that UC has reviewed and approved as college preparatory. *Merced opened in 2005.
2 UC campuses and comparison institutions are sorted byt the sum of the 75th percentile math and reading scores.
Like freshmen, UC transfer students in fall 2016 were better prepared academically than their counterparts a decade ago, as measured by their grades.
1.3.5 College grade point average (GPA)1 of entering transfer students, as share of class, Fall 2000 to 2016
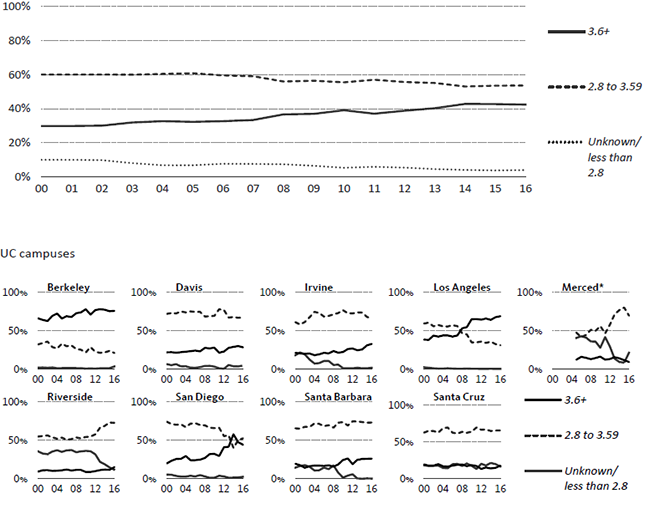
Source: UC Data Warehouse and UC Corporate Student System
The academic qualifications of transfer students entering UC have improved over time, as reflected by an increase in the share of students having a 3.6 or higher college GPA from 30 percent in fall 2000 to 42 percent in fall 2016.
1 The transfer GPA is based on grades for college-level academic courses from the college(s) where students were previously enrolled. *Merced opened in 2005.
UC has a substantially lower proportion of out-of-state undergraduates than other AAU universities. In fall 2016, only 16.5 percent of UC’s enrollees were out-of-state or international, compared with 28.7 percent for other AAU publics.
1.4.1 Residency of undergraduate students, Universitywide and comparison institutions, Fall 2016
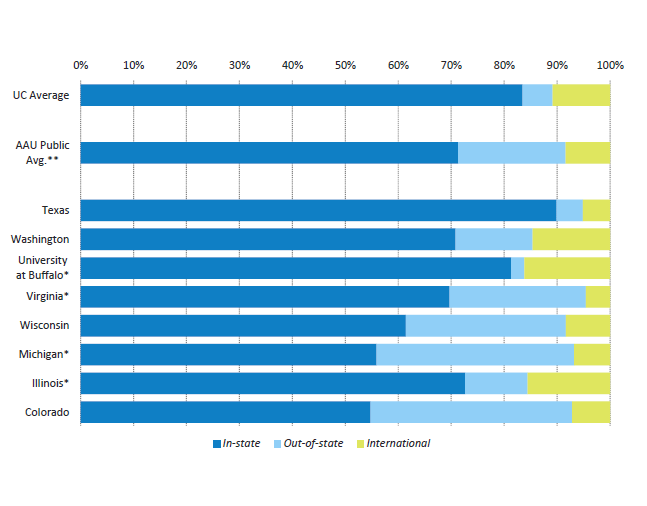
Source: UC Data Warehouse (UC numbers) and Common Data Set (comparator numbers)
* UC’s public four comparison institutions. **AAU public average excludes UC.
UC’s priority is to enroll California residents. Campuses enroll nonresident students based on available physical and instructional capacity and the campus’s ability to attract qualified nonresident students.
Nonresidents provide geographic and cultural diversity to the student body. They also pay the full cost of their education. In 2016–17, tuition and fees at UC campuses for a nonresident undergraduate, including health insurance, ranged from $41,700 to $43,900, compared to $15,000 to $17,200 for California resident students.
Nonresident applicants must meet higher criteria to be considered for admission. The minimum high school GPA for nonresident freshmen is 3.4, compared to 3.0 for California freshmen. The minimum college GPA for nonresident transfer students is 2.8, compared to 2.4 for California residents.
UC campuses attract students from their local regions and the major urban areas of California, with an overall local attendance rate of 34 percent.
1.4.2 Percentage of new CA resident freshman enrollees whose home is within a 50-mile radius of their campus, UC campuses, Fall 2016
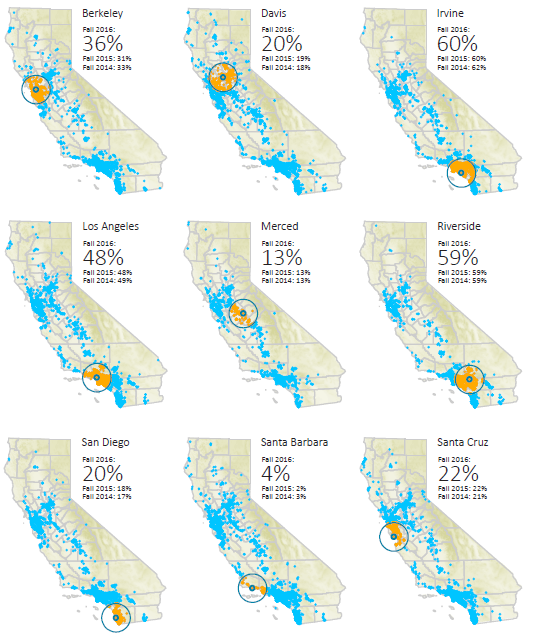
Source: UC Information Center Data Warehouse. California residents are defined here as those with permanent addresses in California.
Local enrollment rates for transfers are even higher than for freshmen, with 46 percent enrolling at a UC campus within 50 miles of their home.
1.4.3 Percentage of new CA resident transfer enrollees whose home is within a 50-mile radius of their campus, UC campuses, Fall 2016
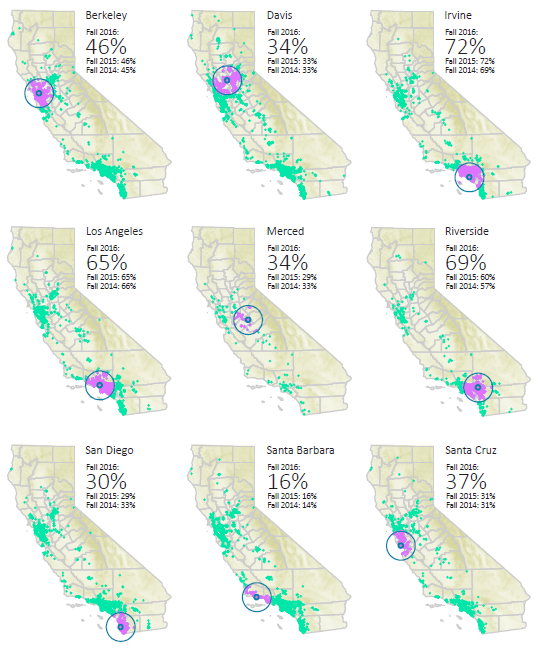
Source: UC Information Center Data Warehouse. California residents are defined here as those with permanent addresses in California.
The proportion of undergraduate students paying nonresident tuition has risen in recent years.
1.4.4 Percentage of undergraduate enrollees paying nonresident tuition1, Universitywide, 1999–2000 to 2015–16
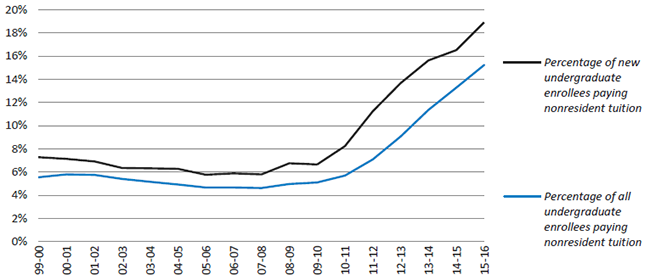
Source: UC Corporate Student System
Systemwide, the share of all undergraduates paying nonresident tuition rose from 5 percent to 15 percent from 2009–10 to 2015–16. Over the same time period, the share of new undergraduates paying nonresident tuition went up from 7 percent to 19 percent. The proportion of nonresident students at individual campuses varies depending on a campus’ capacity as well as its ability to attract nonresident students.
With decreases in state support and flat undergraduate tuition, some UC campuses have leveraged increased revenue from nonresident tuition to support the provision or expansion of undergraduate courses or to expand financial aid for California residents.
1Not all nonresident students pay nonresident tuition. Some have statutory exemptions, such as AB540 students, children of UC employees and others designated by the state. AB540 students are considered California residents for tuition purposes as established by Assembly Bill 540, passed in 2001. This chart uses year average headcount enrollment, the average headcount across all terms in the academic year (three quarters or two semesters).
As a system, UC enrolls far fewer nonresidents than other public research universities, despite receiving a smaller proportion of its revenue from state support.
1.4.5 State funding versus percentage of nonresidents, UC and comparison institutions, fall 2014
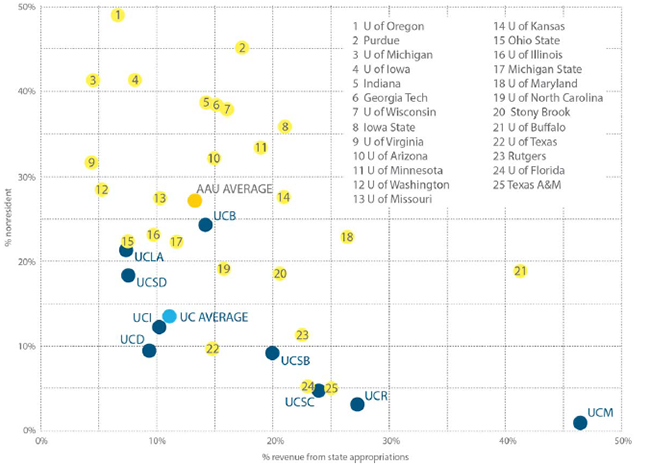
Source: State appropriations and total revenues (including operating and nonoperating revenues) are from IPEDS and reflect fiscal year 2014–15. AAU public nonresident percentages are from Common Data Set. UC nonresident percentages are from the UC Data Warehouse and reflect nonresident tuition payers.
Even the UC campuses with the highest proportions of nonresidents (UC Berkeley with 24 percent and UCLA with 21 percent) are still below the average among non-UC public members of the AAU (27 percent). On average, UC campuses receive 11 percent of revenue from state support, compared to 13 percent for other public members of the AAU. There is an association between declining state funding and increasing nonresident enrollment, a clear trend seen across the public AAU members.