Chapter 9:
Research — Increasing Public Knowledge
The broad scope of UC research
The California “Master Plan for Higher Education” designates the University of California as the primary state-supported academic agency for research. UC research contributes to the state and to the nation through discoveries that improve health, technology, welfare and the quality of life.
UC has more than 800 research centers, institutes, laboratories and programs that span ten campuses, five medical centers, three national energy laboratories and numerous research facilities. It has established an unparalleled international reputation for research. All forms of intellectual inquiry are represented in the research enterprise, from the three-dimensional folding of proteins in cells to the many-dimensional nature of the universe; the translation of ancient texts to the creation of more capable computer languages; the conservation of fragile art works to the development of more drought-resistant crops. The extraordinary diversity and quality of research at UC is reflected in the high rankings assigned to UC campuses (see Chapter 14).
Evaluating the research enterprise
UC’s research may be assessed in a variety of ways: research expenditures; the academic quality and impact of UC’s research; the enhancement of UC students’ educational experience; the contribution of research findings to public knowledge; and the economic and societal benefits that flow from research. This chapter focuses on quantitative measures of research activity, such as amounts spent, individuals employed, and books and journal articles published.
However, these measures do not present a comprehensive account of UC’s diverse research portfolio. They significantly underrepresent research achievements in the arts, humanities, social sciences and theoretical sciences, because work in these fields leaves less of a financial footprint. Nonetheless, UC research in these fields makes a profound contribution to the quality of a UC education and the quality of life in California.
Sources of research funding
One indicator of research activity is the amount expended each year. Research expenditures provide a basis for charting trends over time and allow comparisons to other private and public institutions, indicating UC’s contribution to nationwide academic research. In comparison with its peers, UC excels in the dollars expended on research per ladder-rank faculty member.
Direct research activity at UC nearly doubled over the last 15 years, to about $4.3 billion. Most of this growth was fueled by federal funds. Private, nongovernmental support is a growing component of UC’s research enterprise, funding research in health, life sciences, high technology, data science, materials engineering, education and many other fields. Private support, however, accounts for only about 23 percent of research awards — 12 percent from corporations and 11 percent from nonprofit organizations. This leaves UC’s research enterprise susceptible to fluctuations in federal budgetary appropriations.
Significant projects that received funding during 2013–14 include the following:
-
UC Berkeley was awarded $134 million by NASA’s Goddard Space Flight Center for ionospheric research as part of the Ionospheric Connection Explorer (ICON) project.
-
UC Davis received $14.6 million from the California Department of Public Health for research into emergency responses to communicable diseases.
-
UC Irvine received $9.4 million in education research grants from the John D. and Catherine T. MacArthur Foundation for the Research Network on Connected Learning and the Digital Media and Learning Hub.
-
UCLA’s Clinical and Translational Science Institute received research funding of $14.3 million from the National Institutes of Health’s National Center for Advancing Translational Science.
-
UC Merced was awarded $4.9 million from the National Science Foundation to fund research on the effects of climate change at the Southern Sierra Critical Zone Observatory.
-
UC Riverside received $1.8 million from the U.S. Department of Agriculture’s National Institute of Food and Agriculture for research in reducing losses from potato and tomato late blight.
-
UC San Diego received $77 million from Eli Lilly and $33 million from Toyama Chemical Company for clinical trials of treatments for Alzheimer’s disease.
-
UC San Francisco was awarded $40 million by Daiichi Sankyo for research on neuro-degenerative diseases.
-
UC Santa Barbara received $6.8 million from the National Science Foundation to support the Center of Excellence for Materials Research and Innovation.
-
UC Santa Cruz was granted $4 million for stem cell genomics research by the California Institute of Regenerative Medicine.
These research awards represent only a small sample of the great diversity of research projects for which the University receives award funding.
RESEARCH ACTIVITIES
Research funding principally pays for researchers’ time. More than half of the research expenditures in 2013–14 went to salaries and benefits. Only 18 percent went to faculty; the majority supported staff researchers, and nearly one-quarter went to students and postdoctoral researchers.
RESEARCH RESULTS — spurring the economy
The economic benefit of UC’s research enterprise to the state of California is significant. A recent economic impact study determined that for every dollar spent by UC, the state’s economy directly increases by about two dollars. The $4.3 billion spent by UC on research multiplies to nearly $9 billion in statewide economic activity. This number does not take into account the secondary economic impact of businesses that are based on technology developed by UC researchers or that rely on the skills of UC graduates.
Research leads to technologies and processes that become public knowledge through the patent process. These innovations enhance industries, stimulate economies, and improve health and well-being worldwide. Over the past two decades, UC has secured more licensable patents for its inventions than any other U.S. research university. Since 1976, more than 840 startup companies have been founded around UC inventions, and about 85 percent of them are based in California.
RESEARCH RESULTS — diffusing knowledge
Perhaps the most visible results of UC research take the form of publications: the journal articles, books and other research reports available through an ever-growing repertoire of print and electronic media. This chapter includes an analysis of the Web of Science publication database, with the understanding that such compilations significantly underrepresent faculty research contributions in the arts, humanities and social sciences. Also included is a recent study by academic publisher Elsevier of the impact of UC research publications, which attributes one out of every 12 research publications in the United States to the University of California.
Research results — improving global health
During 2013–14, about 2,800 clinical trial research projects were underway at UC. Clinical trials occupy a unique position in academic research. Unlike basic research, clinical trial research projects represent the final stage in the journey from a scientific discovery to an effective treatment. Of all the research dollars that came to UC from businesses during 2013–14, about 40 percent was directed toward clinical trials.
Research results — addressing climate change
UC is a leader in research on energy technologies and practices that will reduce carbon emissions and their impact. In addition to energy research appropriations by the U.S. Department of Energy to Lawrence Berkeley National Laboratory, UC campuses secured about $440 million over a five-year period for work on ways to achieve carbon neutrality through reduced fossil fuel consumption and other means.
Research workforce changes
UC faces numerous challenges in pursuing its research mission. These include recruiting and retaining world-class faculty, remaining competitive in attracting graduate and postdoctoral students, and fully funding the research enterprise because the University does not recover the full costs of research from either governmental or private research sponsors.
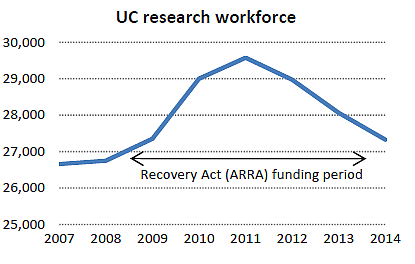
A critical issue facing academic research nationwide is the lack of adequate federal support for basic research and development. For more than a decade, federal research support, adjusted for inflation, has been essentially flat — with the exception of the years when American Recovery and Reinvestment Act stimulus funds were available. Between late 2009 and 2011, the Recovery Act provided UC with over $1 billion for research. But since then, no new federal or private sources of research funding have arisen that can entirely take the place of the stimulus funds. Moreover, during 2012–13, congressionally mandated cutbacks in federal agency spending reduced UC’s research awards to about where they were in the early 2000’s.
The effects of the Recovery Act funding increase, followed by the congressionally mandated cutback in agency R&D appropriations, are clear. The workforce rose to a peak of nearly 29,600 FTE (full-time equivalent personnel) in 2011 and since then has declined to about 27,300, a drop of 8.2 percent.
The effect of these cutbacks on the research workforce has varied by campus and by discipline, with more of an impact on fields such as medical research, which depend on funding from UC’s largest federal research sponsor, the National Institutes of Health. This has also impacted the University’s instructional mission, as research funding provides support for graduate student researchers and postdoctoral researchers in many fields.
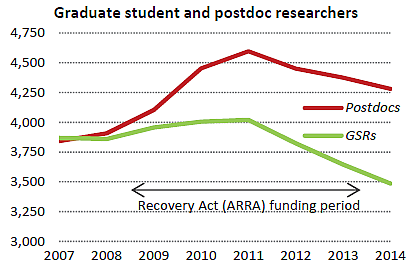
Since 2011, the number of graduate student researchers has dropped 13.2 percent, from over 4,000 FTE to under 3,500. The total number of UC’s academic doctoral students has remained about the same, which indicates that graduate students, overall, are spending less time as compensated researchers.
The number of postdoctoral researchers increased more dramatically than the number of GSRs under the influx of Recovery Act funds. Their numbers also declined as Recovery Act fund expenditures tapered down, but not as sharply as GSRs — from 4,600 FTE to 4,300, representing a drop of 6.5 percent.
Recent increases in research sponsorship, however, suggest that the research enterprise may be entering a period of improvement. Research awards to UC are a leading indicator of research expenditures and research activity. During 2013–14, research awards to UC ended a three-year decline and rose to nearly the levels seen when stimulus funds were available. These trends, if they continue, could bring stability, and perhaps modest growth, back to UC’s research enterprise.
The long-term prospects for federal research sponsorship, though, remain uncertain. To help offset some of this uncertainty, research universities are increasingly looking to private sources of research support, hopeful that a burgeoning economy will spur both foundation grants and corporate investment. Initiatives to develop new forms of partnership with private sponsors are underway.
FOR MORE INFORMATION
UC’s Budget for Current Operations 2015–16 contains information on the contributions and impacts of UC’s research enterprise on the California economy.
The Technology Commercialization Report provides information on patents, technology licensing and startups.
The UCOP Office of Research and Graduate Studies website contains a number of resources about UC’s research enterprise.
An interactive storyboard on research sponsorship is found on the UC InfoCenter, and a storyboard on UC's contribution to California.
UC inventions at glance provides information on technology transfer.
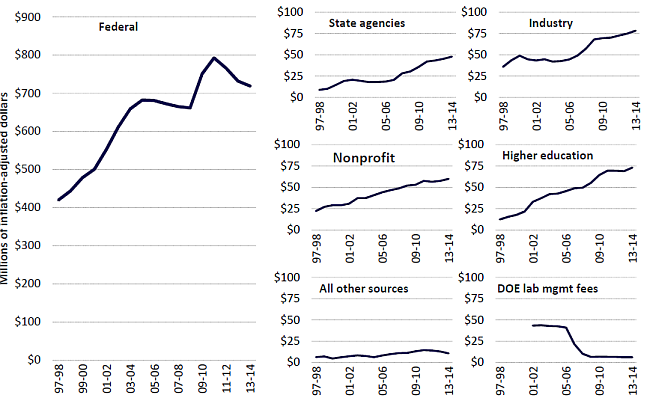
Federal funds support most of the research work done at UC.
9.1.1 Direct research expenditures by source, Universitywide,1997–98 to 2013–14
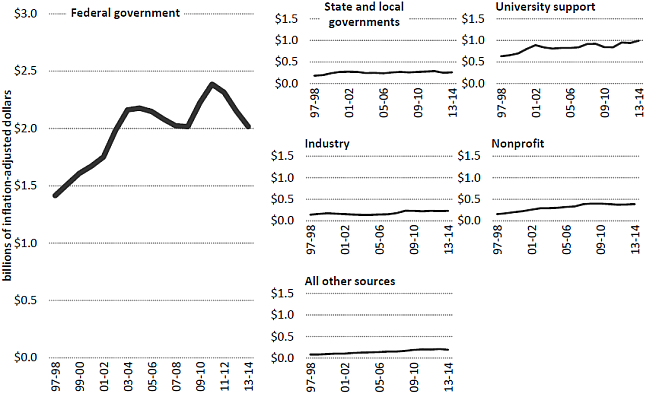
Forty-nine percent of UC’s research expenditures in 2013–14 came directly from federal agencies, the lowest percentage in 15 years. A further 8 percent of expenditures represents federal flow-through funds that came to UC as sub-awards from state and private sources, including other research universities. Together, about 57 percent of UC’s research expenditures started out as federal funds.
About three-quarters of UC’s federal research funds came from just two agencies: the National Institutes of Health and the National Science Foundation.
Fluctuations in federal appropriations have a major impact on UC’s research. Cutbacks at key federal agencies, starting in 2006, ended a long period of growth and resulted in a decline in research expenditures. This downturn was briefly reversed in 2009–10 by the American Recovery and Reinvestment Act, which provided over $1 billion in research funds to UC. The recent round of reductions in federal appropriations for research and development has also had a significant impact on UC’s research enterprise, which remains heavily dependent on federal agency funding.
University support, accounting for 24 percent of all 2013–14 direct research expenditures, derives from a variety of sources. These institutional funds include UC general funds (including a portion of the recovered indirect cost amounts), student tuition, state government specific appropriations, endowment income and gifts.
1 Amounts have been adjusted for inflation and do not include accrual funds for postemployment retirement benefits or indirect cost recovery funds.
9.1 RESEARCH EXPENDITURES
The true costs of conducting sponsored research at UC are significantly greater than the amounts the University receives, even for federally funded projects.
9.1.2 Research indirect cost recovery by source, Universitywide, 1997–98 to 2013–14
Source: UC Corporate Financial System
Budgets for externally funded research projects include both a direct cost component — the actual amount of salaries, benefits, equipment and materials needed to conduct the project — plus an additional percentage to cover the facilities and administration required to house and support the research project, including debt service, maintenance, libraries and the like. These facilities and administrative costs are called “indirect costs” and are billed at a percentage of the direct charges.
The true indirect costs of research, however, are typically much higher than the rate that research sponsors are willing to pay to UC or, for that matter, to other research universities. Actual indirect cost recovery rates vary widely among research sponsors. Rates negotiated with federal agencies are among the highest, at about 52–56 percent, but are nonetheless estimated to run between 5 and 18 percentage points below the true indirect costs of conducting research. Nonfederal research sponsors, including many corporations, most nonprofit organizations and the state of California, have policies that may limit indirect cost recovery to well below federal rates. UC estimates that the true costs of its research exceed direct and indirect cost recovery by as much as $600 million annually, and it must make up for this deficit from other sources. One of UC’s long-term financial goals is to increase indirect cost recovery by up to $300 million annually.
Salaries and benefits represent more than half of all research expenditures.
9.1.3 Research expenditures by type, Universitywide, 2013–14
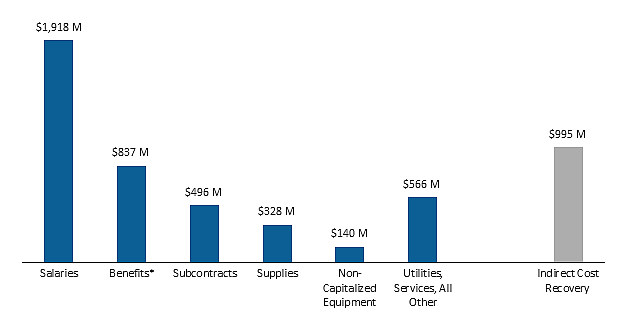
* Includes post-employment benefit accruals. Source: UC Corporate Financial System
Total research expenditures of about $5.3 billion during 2013–14, which include about $1 billion in recovered indirect costs, represent about one-fifth of UC’s total expenditures.
About 18 percent of the salaries paid to support research went to ladder-rank and other faculty. Twenty-three percent went to postdoctoral researchers and students, primarily graduate students, providing a critical source of support.
| Research salary distribution |
$ millions |
% |
| Faculty |
346 |
18% |
| Academic researchers |
425 |
22% |
| Other staff |
716 |
37% |
| Postdoctoral researchers |
227 |
12% |
| Students |
203 |
11% |
| Total |
1,918 |
100% |
In 2013–14, funded research projects provided employment for about 27,300 full-time-equivalent personnel. This represents 30 percent1 of the total UC full-time-equivalent workforce, including student employees.
9.2.1 Research workforce by discipline, Universitywide, 2013–14
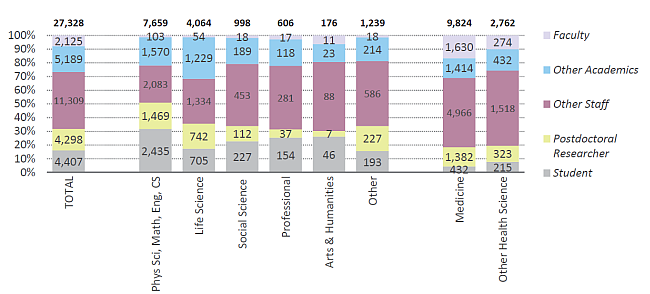
Source: UC Corporate Personnel System
2
A diverse community of faculty, other academics, postdoctoral researchers, students, professional researchers and support staff all participate in UC’s research enterprise. Student researchers (primarily graduate students) contribute to research in all disciplines and comprise almost one-third of the paid research workforce in the physical sciences and technology fields.
The 2013–14 research workforce is about 2.6 percent smaller than it was last year, due principally to declining federal funding. During 2013–14, however, UC’s research funding from both federal and private sources increased, returning to roughly pre-recessionary levels. If this federal funding trend continues, UC’s research workforce is likely to stabilize and possibly increase over the next several fiscal years.
The employment figures shown above include only staff and students paid through an externally funded research program or by UC’s own research funds. This tabulation does not capture the effort of faculty and students who engage in research in the normal course of their work, or the staffers who provide administrative, facilities and equipment maintenance support as part of the overall University mission. In most disciplines without significant external research funding, such as the arts and humanities, this work constitutes the lion’s share of the total research effort.
1 UC has about 98,000 full-time-equivalent employees.
2 Data shown here represents full-time-equivalent personnel receiving earnings from research accounts.
Postdoctoral scholars (“postdocs”) are an integral part of the research function in many fields, and the training they receive at UC helps to create the next generation of scholars and researchers.
9.2.2 Postdoctoral scholars by discipline, UC Campuses, Fall 2014
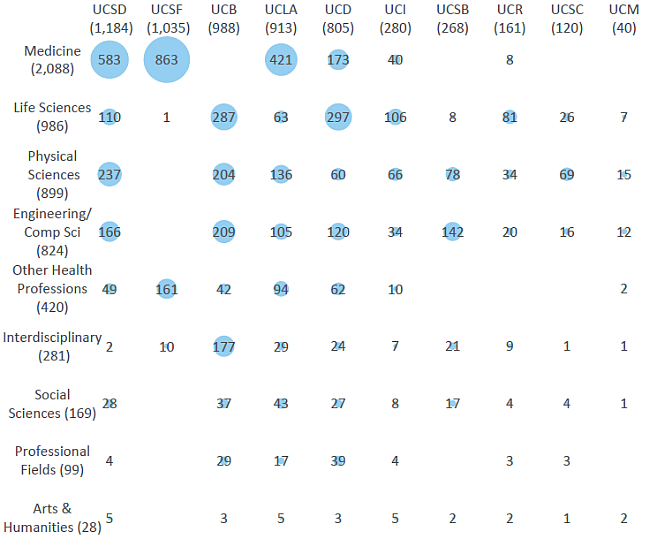
Source: UC Information Center Data Warehouse, October 2014 Payroll Data1
There are nearly 5,800 postdoctoral scholars at UC. Not all have full-time appointments. Most if not all postdoctoral scholars are paid from research grants and for this reason are more prominent in fields with greater external research funding. Postdoctoral scholars contribute to instruction in the laboratory sciences by working side by side with graduate students. They may also have a formal supervisory function in the laboratory, depending on arrangements made by the faculty member in charge.
1 Includes all postdoctoral scholar titles: employee, fellow and paid direct. Includes those who may hold concurrent titles in other academic or staff categories. Professional Fields include architecture & environmental design, business & management, communications, education, home economics, law, library science and social welfare. Other health professions & clinical sciences include dentistry, nursing, optometry, other health professions, other health sciences, pharmacy, public health and veterinary medicine.
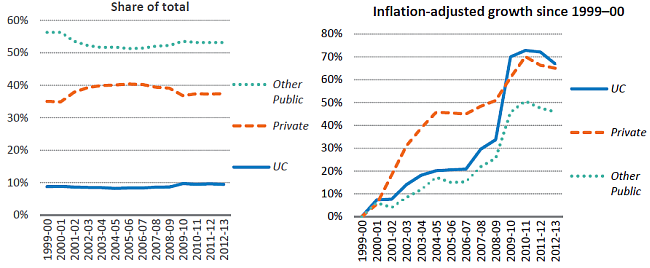
The University of California performs nearly one-tenth of all the academic research and development conducted in the United States.
9.3.1 UC share of U.S.research expenditures, Universitywide, 1999–2000 to 2012–13
Source: IPEDS
UC’s contribution to the academic research and development activity in the U.S., as reported through IPEDS, has remained constant over the last decade, at between 9 and 10 percent. Over this period, the rate of growth in UC’s research enterprise exceeded the average pace at other public universities. This reflects not only UC’s competitiveness in securing federal awards — which provide the great majority of research funds — but also UC’s success in forging productive research relationships with the private sector.
UC is the largest single recipient of research funding from the two federal agencies principally responsible for sponsoring academic research: the National Institutes of Health and the National Science Foundation. UC generally receives 5 to 6 percent of NIH’s annual appropriations for research and 7 to 8 percent of NSF’s annual appropriations. As shown in indicator 9.1.1, the most recent round of cutbacks in federal research funds has been partially offset by increases in research contracts with corporate and nonprofit sponsors.
Inflation-adjusted expenditures for research in the medical fields have increased by 84 percent since 1997–98, compared to 40 percent for all other disciplines.
9.3.2 Direct research expenditure by discipline, Universitywide, 1997–98 to 2013–14
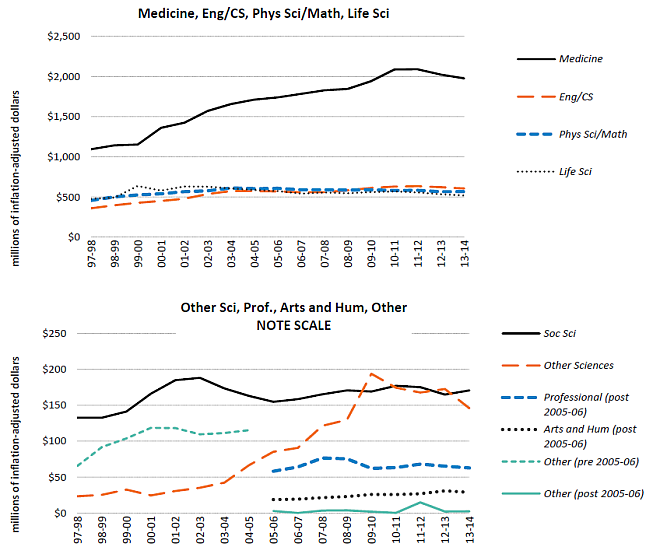
Prior to 2005–06, “Other” included professional and arts and humanities. Source: UC Corporate Financial System.
Research expenditures in all STEM (Science, Technology, Engineering and Mathematics) and medical fields represented over 90 percent of total research expenditures each year during the past decade. This reflects the availability of research funding and parallels the nationwide pattern of academic research activity.
Measures based on research expenditures substantially underrepresent research activity in the arts and humanities, social sciences and professional disciplines, which make important contributions to scholarship and the quality of life, yet have relatively little access to external research funding.
Annual research expenditures per ladder-rank faculty are higher at UC than its comparison peers.
9.3.3 Average inflation-adjusted research expenditures per ladder-rank faculty, UC and AAU comparison universities, 2005–06 to 2013–14
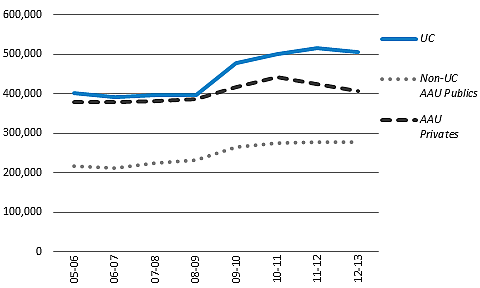
Source: IPEDS
UC faculty are extremely successful at attracting research support from both government and private sponsors. On average, UC conducts more than $505,000 in research per tenured and tenure-track faculty member, which surpasses the average of about $406,000 per faculty member for American Association of Universities (AAU) private institutions, and about $277,000 for AAU public institutions.
For UC campuses, the presence of a medical school greatly increases access to research funds. The largest single source of research sponsorship is the National Institutes of Health, and campuses with the facilities to conduct medical research are in the best position to compete for these limited federal funds. UC’s second-largest source of research support is the National Science Foundation.
9.3.4 Average research expenditures per ladder-rank faculty, UC campuses, 2013–14
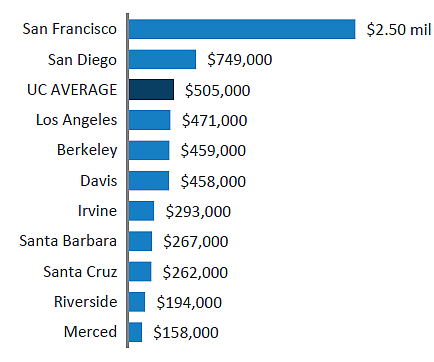
UCSF is an exclusively health science campus, where many faculty who are not ladder-rank conduct a significant portion of the research.
The number of faculty publications is one measure of faculty research productivity.
A crucial component of UC’s research mission is the diffusion of knowledge, and publication of research results in journals, books and other media remains among the most important, and certainly the most visible, means of achieving this goal. With vast publication databases now available, it is possible to mine these data sources for information about publications by UC researchers, and develop quantitative measures of publication output.
The charts on the following page show faculty publications across three broad academic disciplines: health and life sciences, physical sciences and engineering, and social sciences and humanities. Some important caveats guide their interpretation and use.
Within a given academic discipline, differences in the level of faculty publications are due to a number of factors, among them the nature of scholarship in a given field, size of departments and the number of faculty at each campus working in a particular field. Davis, Irvine, Los Angeles, San Diego and San Francisco, for example, all have large medical schools and associated faculty and researchers, and accordingly show disproportionately high levels of publications in the health and life sciences.
Published outputs cannot be used to compare faculty research productivity across disciplines. The range of types, frequency and venues for the dissemination of research varies greatly among academic disciplines. In addition, the number of newly hired faculty and researchers can affect a campus’s measure here, as it takes time for a new hire to publish articles.
Some disciplines favor shorter, multiauthored publications, while other disciplines favor longer, sole-authored publications. Co-authorship, for example, is more common in the life and physical sciences, where credit may be shared with a team of researchers, than in the social sciences and humanities, where papers tend to be single-authored. Thus, faculty in the life and physical sciences may have more publications credited to them than faculty in the social sciences and humanities, in part because of different publication norms.
Faculty in the social sciences and the humanities also publish books as well as scholarly articles; however, the 2013 Web of Science database, from which the data for this indicator are drawn, focuses principally on journals, and its coverage of books is much less thorough. Thus, it underestimates faculty research contributions in the arts, humanities and social sciences.
9.4.1 Publications by broad discipline and per eligible principal investigator (PI)1, UC campuses, 2013
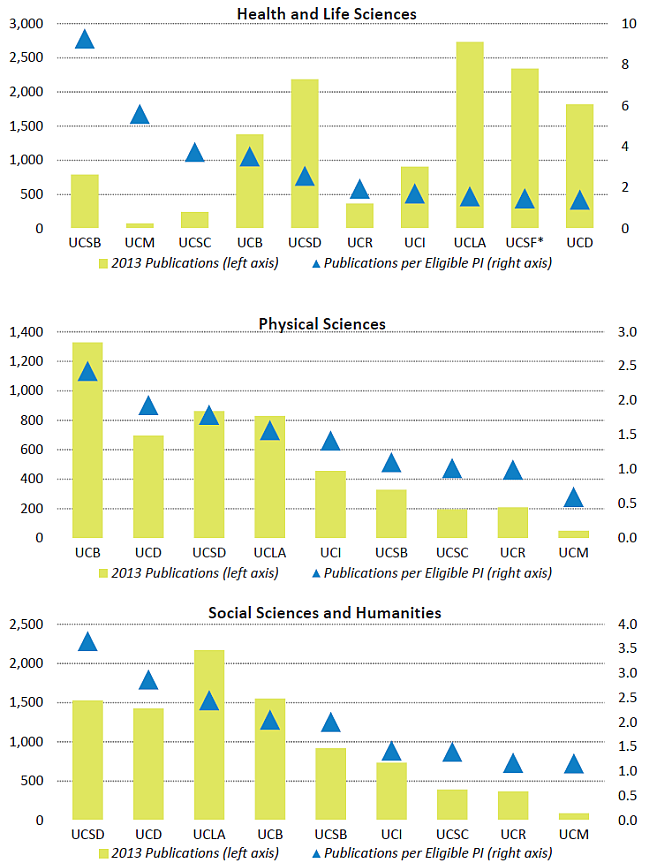
Source: Web of Science and UC Corporate Personnel System. All UCSF publications are included in health/life sciences. Eligible PI count is from winter 2012–13.
1 A principal investigator is a person authorized by the Academic Personnel Manual to apply for and receive grants. Nearly all are faculty, professional researchers or academic administrators. For more information see the Glossary.
The University of California is a major research presence at both the state and national levels, producing about one-twelfth of the nation’s research publications.
9.5.1 Total UC research publication impact within the national context, by field-weighted citation impact and discipline, Universitywide, 2009 to 2013
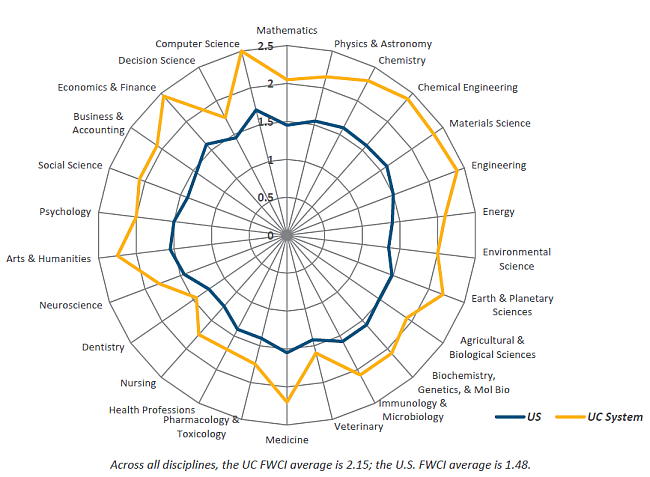
Comprehensive publication databases can be mined and analyzed to develop quantitative measures of the publication output and impact of UC researchers. A recent Elsevier study showed that UC research publications accounted for 8.3 percent of all research publications in the United States between 2009 and 2013.
In assessing research output, it is important to consider not only publication volume but also publication quality. Using a field-weighted citation impact (FWCI), we can compare publication citation data across disciplines and compare the quality of UC research publication output to the state, national and global levels. The FWCI for the UC System as a whole is 2.15 across all disciplines, higher than both the world average (1.0) and the U.S. average (1.49) between 2009 and 2013.
In all fields, the impact of UC publications significantly exceeded U.S. national averages. UC’s publication impact is particularly high in the fields of arts and humanities, economics, computer science, engineering and medicine.
Source: Elsevier, “Research Performance of the UC System,” March 2015.
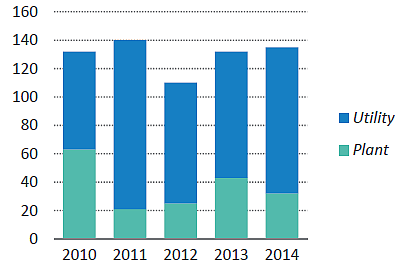
Licenses issued in California contribute to successful businesses. The number of active plant and utility licenses in California is growing.
9.6.1 Licenses for UC technology issued annually to California businesses, 2009–10 through 2013–14
Research is part of the mission of the University of California, and much of this research is basic, foundational research. However, some UC research leads directly to new inventions and innovations; bringing those innovations from the lab to the marketplace is an intrinsic part of UC’s public service mission. Innovations from UC take two paths to the marketplace: they may be licensed to an existing company or they may become the cornerstone of a new startup company. Both pathways ultimately benefit the economy of the state of California.
9.6.2 Active licenses for UC technology in California, 2009–10 through 2013–14
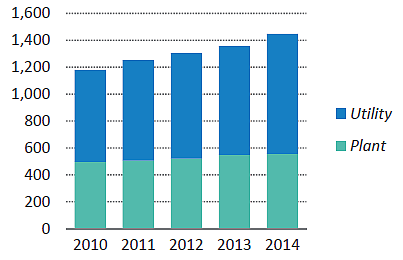
University inventions are classified as utility licenses or plant licenses. Utility licenses cover inventions protected by utility patents, such as processes, machines, manufactured items or compositions of matter. Utility licenses are often exclusive to the licensee. Plant licenses cover sexually and asexually reproducing plant varietals, and are often licensed via nonexclusive licenses to nurseries and distribution centers. From the high-tech centers of San Diego and Silicon Valley to the agriculture of the Central Valley, UC technology is licensed throughout California.
9.6.3 UC startups formed in California, 2009–10 through 2013–14
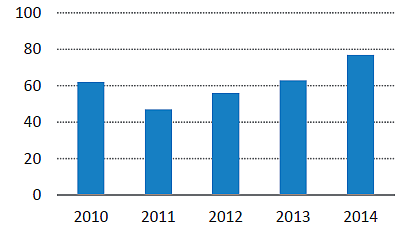
Source: UC Innovation Alliances and Services
UC startups are independently operating companies that formed to commercialize a UC technology. The vast majority (over 85%) of these startups were founded in California and have stayed in California. As of 2014, 430 UC startups are actively operating in California. These startups employ 5,178 people in California and bring in a combined $654 million in annual revenues.
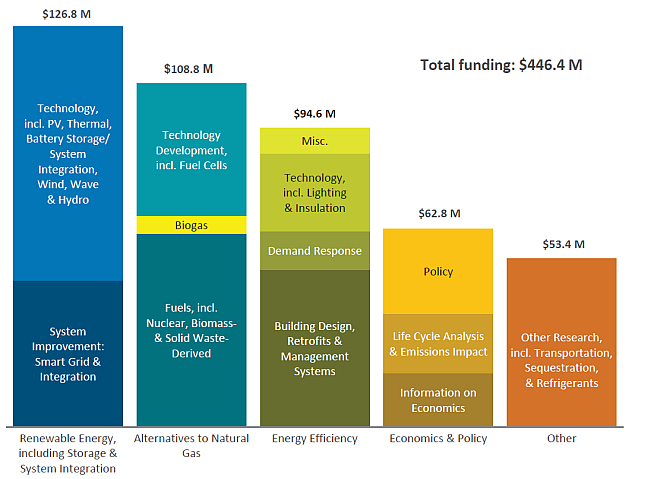
Over a five-year period, UC researchers secured over $440 million to develop technologies and management practices aimed at achieving the goals of UC’s Carbon Neutrality Initiative and addressing global climate concerns
9.7.1 UC strengths in carbon-neutrality research topics, Universitywide, Q4 2008 to Q3 2013–14
Source: UC Contracts & Grants System
In 2007, all ten UC campuses pledged to achieve carbon neutrality by 2050, establishing a timeline that would make UC the first public university to achieve this ambitious goal. In 2013, UC President Janet Napolitano strengthened that commitment by announcing the University of California Carbon Neutrality Initiative and advancing the carbon neutrality goal to 2025. To identify research strengths, gaps and areas where further investment would have the greatest impact, the Office of Research & Graduate Studies at the UC Office of the President compiled an inventory of all research awards to UC PIs over a five-year period on topics relevant to UC’s Carbon Neutrality Initiative.
Although the distribution of research activity among the major topic areas appears to be well-balanced, the subcategories within these areas reveal gaps. Most notably, research on the development of biogas from organic waste received relatively low support, with approximately $5 million total funding over the five-year period. This is particularly important, given the need to substitute alternative biogas fuels for the large quantities of natural gas currently used on campuses with large, natural-gas-fired co-generation facilities for heating and on-site electricity generation.