The broad scope of UC research
The California Master Plan for Higher Education designates the University of California as the primary state-supported academic agency for research. UC research contributes to the state and to the nation through discoveries that improve health, technology and the quality of life. Research represents the creation of new knowledge. Once that knowledge is created it can be communicated, curated and cultivated to benefit society.
UC has more than 800 research centers, institutes, laboratories and programs that span ten campuses, five medical centers, three national energy laboratories and numerous research facilities.
Evaluating the research enterprise
UC’s research may be assessed in a variety of ways: total expenditures; quality and impact; enhancement of UC students’ experience; contribution of findings to public knowledge; and economic and societal benefits. This chapter focuses on quantitative measures such as expenditures, employees and publications.
However, these measures do not present a comprehensive account of UC’s research. They underrepresent research achievements in the arts, humanities, social sciences and theoretical sciences, where work leaves less of a financial footprint, but still contributes to UC education and society.
A sample of research funded in 2015–16:
- UC Berkeley was awarded $12.5 million from the US. Department of Energy to support the UC/China Clean Energy Research Center for Water-Energy Solutions and Technologies.
- UC Davis received $28.8 million from the U.S. Agency for International Development to monitor the global emergence of pathogens from animals.
- UC Irvine was granted $7.0 million from the National Institutes of Health (NIH) to support the Institute for Clinical and Translational Science.
- Lawrence Berkeley National Laboratory received $15.8 million from the SLAC National Accelerator Laboratory to provide crucial accelerator components.
- UCLA received $21.9 million from the Cleveland Clinic Foundation for a multi-site clinical trial of the effects of using the sedative dexmedetomidine in cardiac surgery.
- UC Merced was granted $5.0 million by the National Science Foundation for five years of support for the Center for Cellular and Biomolecular Machines.
- UC Riverside was awarded $4.0 million by the U.S. National Institute for Food and Agriculture to study the effects of the huanglongbing pathogen on the citrus industry.
- UC San Diego received $32.6 million to support operations of the Simons Observatory in the Atacama Desert of northern Chile.
- UC San Francisco was granted $35.0 million by the Parker Institute for Cancer Immunotherapy to support cancer immunotherapy research.
- UC Santa Barbara’s Kavli Institute for Theoretical Physics received $4.6 million from the National Science Foundation.
- UC Santa Cruz was granted $7.3 million by the National Human Genome Research Institute for its Genome Browser.
- UC’s Division of Agriculture and Natural Resources was awarded $3.7 million by the California Department of Public Health for obesity prevention research and evaluation.
The true costs of conducting research
Direct research expenditures at UC during 2015–16 totaled over $4.4 billion, with federal funds providing more than half of the total. Private sources account for about 25 percent of research sponsorship — 13 percent from corporations and 12 percent from nonprofits. Nearly two-thirds of research expenditures in 2015–16 went to salaries and benefits. Only about 26 percent went to faculty; the majority supported staff researchers, and about one-fifth went to students and postdoctoral scholars.
Budgets for externally funded research include both a direct cost component — the actual amount spent on salaries, benefits, equipment and materials directly linked to the project — plus a percentage to cover the facilities and administration required to support the research project, including debt service, maintenance and libraries. These facilities and administration costs are called “indirect costs.”
In 2015–16, UC’s indirect cost recovery was just over $1 billion. The true indirect costs of research, however, are typically much higher than the rate that research sponsors are willing to pay to UC or, for that matter, to other research universities. Rates negotiated with federal agencies range from 53 to 57 percent across UC campuses, but this rate is still 18 to 20 percentage points below the true indirect costs. Non-federal research sponsors, including corporations, nonprofits and the state of California, have policies that limit indirect cost rates to well below federal rates. The true costs of UC research exceed recovered amounts by hundreds of millions of dollars annually, which must be made up from other sources.
Research results — enhancing instruction
UC’s research enhances the student experience. Faculty often incorporate their research results into their courses, providing UC students with access to insights and discoveries, sometimes before they are published. UC students also participate; the 2016 UC Undergraduate Experience Survey found over 40 percent of UC students had been involved in faculty-directed activity other than coursework, such as research or creative projects. Participation in research defines graduate education, and graduate student researchers make up a significant portion of the research workforce. In 2015–16, of UC’s 56,000 graduate students, about 15,000 were employed as paid research assistants. UC also trains about 6,400 postdoctoral scholars annually.
Research results — spurring the economy
Many businesses in California are based on technology developed at UC or rely on the skills of UC graduates, an important example of how cultivating research results can benefit society. The discoveries made through research become public knowledge through publications and the patent process. These innovations enhance industries, stimulate economies, increase security and improve health and well-being. Over the past two decades, UC has secured more licensable patents than any other U.S. research university. Since 1976, over 1,000 startup companies have been founded around UC inventions, with 85 percent based in California.
Research results — communicating and curating knowledge
Publications are perhaps the most visible results of UC research. UC produces about one-twelfth of the nation’s research publications. This chapter compares the volume and impact of UC research publications to nationwide averages and to the output of peer AAU institutions.
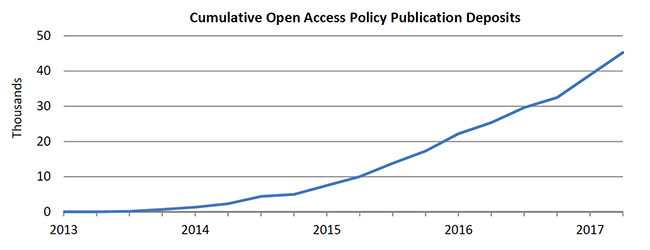
The books, periodicals and journals in which research findings are published are costly, which puts them beyond the reach of many researchers, students and journalists, especially in developing regions. To ensure that research findings become public, UC has adopted Open Access policies as part of its curation efforts, whereby articles by UC authors are made available through the eScholarship repository, operated by UC’s California Digital Library. Since the Open Access program began in 2012, there have been more than 45,000 publications deposited, and nearly one million article downloads worldwide.
Research results — improving global health
Clinical research projects are another example of cultivating new knowledge to benefit society. During 2015–16, UC began more than 1,000 new clinical trial research projects in addition to 2,500 already underway. Clinical trials occupy a unique position in academic research. These projects represent a crucial stage in the journey from a scientific discovery to an effective treatment. Of the research dollars that came to UC from businesses during 2015-16, 57 percent was directed toward clinical trials.
Research results — assessing climate change and charting the energy future
UC is a national and global leader in research on climate science, including monitoring atmospheric changes and global temperature rise and assessing the impacts of climate change on marine and land-based ecosystems as well as the built environment. UC scholars and students carry out some of these studies at the 39 Natural Reserve System (NRS) sites that are maintained by UC at locations around California, and that support a wide range of instructional, research and service activities. Most of UC’s climate science work is funded by federal agencies, notably the Departments of Defense and Energy, the Environmental Protection Agency, the National Oceanic and Atmospheric Administration and the National Science Foundation. Each year, UC receives an average of $160 million in federal funding to pursue climate research, and Lawrence Berkeley National Laboratory receives an additional $40 million from the Department of Energy for research on energy and the environment.
UC National Laboratories — science in the national interest
The three University of California-affiliated National Laboratories — Lawrence Berkeley (LBNL), Lawrence Livermore (LLNL) and Los Alamos (LANL) — are among the nation’s premiere multi-disciplinary research and development (R&D) laboratories. The University has played a major public service role as a manager of these three Department of Energy (DOE) national laboratories since their inception, consistent with the University’s mission of education, research and public service. The three labs, with annual budgets approaching $5 billion and a combined workforce of nearly 22,000, perform vital energy and national security research.
The National Laboratories also support UC’s educational mission. At Lawrence Berkeley National Laboratory, nearly 23 percent of employees are student assistants, graduate research assistants or postdoctoral scholars. At Lawrence Livermore National Laboratory, three percent of the workforce are postdocs, and at Los Alamos National Laboratory, almost 12 percent are postdocs or undergraduate and high school student assistants.
Looking forward — federal research funding
With federal funding supporting more than half of UC’s research, the vitality of UC’s research enterprise is dependent on agencies that may face reduced appropriations under the current administration. The long-term prospects for federal research sponsorship, particularly for climate and environmental science, remain uncertain.
Whatever changes in research priorities are embodied in the federal budget, one certainty is that the competition for federal funding will become even more intense. At the National Institutes of Health, only one proposal is funded for every five received, compared to a success rate of about 32% fifteen years ago. UC is highly competitive in garnering these awards, but this success comes at a cost. The administrative effort of drafting, reviewing, submitting and tracking proposals is one of the less-visible costs of conducting research — costs that are not fully recovered from federal sponsors.
For more information
9.1 RESEARCH EXPENDITURES
Federal funds support most of the research work done at UC.
9.1.1 Direct research expenditures by source, Universitywide, $ billions, 1997–98 to 2015–16
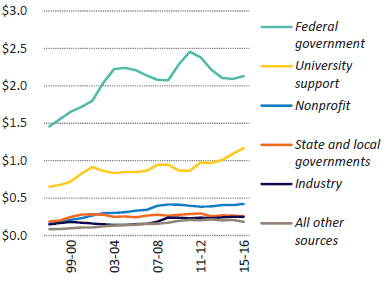
Source: UC Corporate Financial System1
UC’s direct research expenditures during 2015–16 amounted to about $4.4 billion. Of this total, 48 percent came directly from federal agencies. This is the same percentage as last year, which is lower than any time in the previous 15 years. A further seven percent represents federal flow-through funds that came to UC as sub-awards from the state, corporations, nonprofit organizations or other universities. Together, about 55 percent of UC’s research expenditures started as federal funds. About three-quarters of UC’s federal research funds were provided by just two agencies: the National Institutes of Health and the National Science Foundation.
Fluctuations in federal appropriations have a major impact on UC’s research. Cutbacks at federal agencies starting in 2006 ended a long period of growth. This downturn was temporarily reversed during 2009–10 by the American Recovery and Reinvestment Act, which provided over $1 billion in research funds to UC. Federal appropriations have been relatively stable for the last two years, but this may change with the current administration.
University support, accounting for almost 27 percent of all 2015–16 research expenditures, derives from a variety of sources. These funds include UC general funds, state government specific appropriations, endowment income and gifts.
1 Amounts have been adjusted for inflation and do not include accrual funds for postemployment retirement benefits or indirect cost recovery funds.
Salaries and benefits represent more than half of all research expenditures.
9.1.2 Total research expenditures by type, Universitywide, $ millions, 2015–16
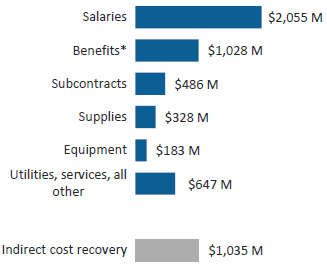
* Includes post-employment benefit accruals. Source: UC Corporate Financial System
When the over $1 billion in recovered indirect costs are included, total research expenditures during 2015–16 amounted to about $5.8 billion, representing almost one-fifth of UC’s total expenditures. About one quarter of research salaries went to faculty.
| Research salary distribution |
$ millions |
% |
| Faculty |
543 |
26% |
| Academic researchers |
325 |
16% |
| Other staff |
731 |
36% |
| Postdoctoral researchers |
241 |
12% |
| Students |
214 |
10% |
| Total |
2.055 |
100% |
In 2015–16, funded research projects provided employment for about 27,500 full-time-equivalent (FTE) personnel. This represents almost 19 percent1 of the total UC workforce when student employees are included.
9.2.1 Research workforce by discipline, FTE, Universitywide, 2015–16
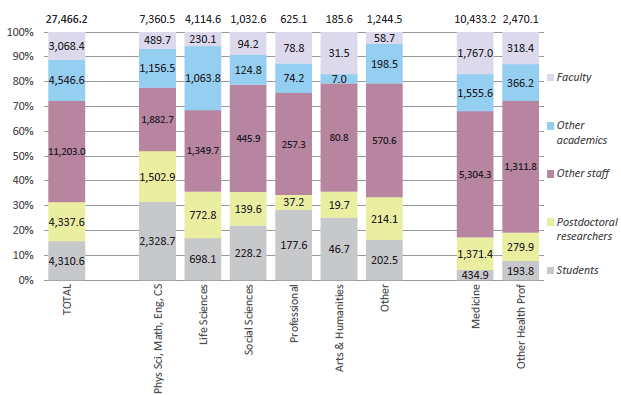
Source: UC Corporate Personnel System2
A diverse community of faculty, other academics, postdoctoral researchers, graduate and undergraduate students, professional researchers and support staff all participate in UC’s research enterprise. Student researchers (primarily graduate students) contribute to research in all disciplines and comprise almost one-third of the paid research workforce in the physical sciences and technology fields.
The 2015–16 research workforce is about 2 percent larger than it was the prior year, due principally to an increase in the numbers of medical researchers.
The figures shown above include only staff and students paid through an externally funded research program or by UC’s own research funds. This does not capture the effort of faculty and students who engage in research in the normal course of their work, or the staffers who provide administrative, facilities and equipment maintenance support as part of the overall University mission. In disciplines without significant external research funding, such as the arts and humanities, this work constitutes the lion’s share of the total research effort.
1 UC has about 148,000 full-time-equivalent employees.
2 Data shown here represents full-time-equivalent personnel receiving earnings from research accounts.
Postdoctoral scholarsare an integral part of the research function in many fields, and the training they receive at UC helps to create the next generation of scholars and researchers.
9.2.2 Postdoctoral scholars by discipline, UC Campuses, Fall 2016
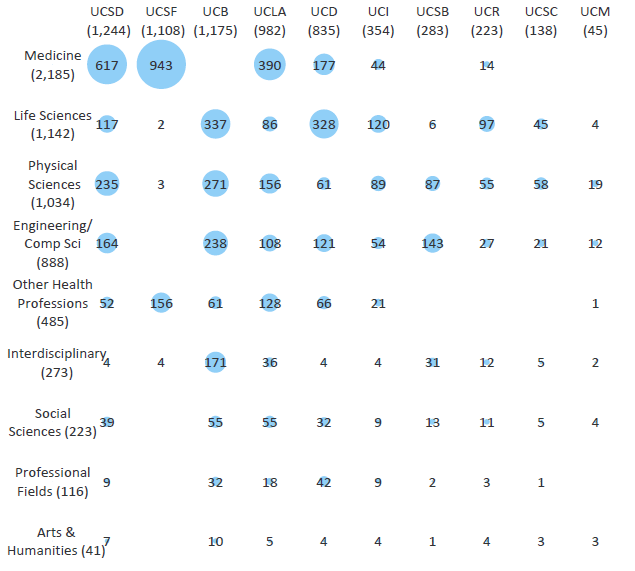
Source: UC Information Center Data Warehouse, October 2015 Payroll Data1
There are about 6,400 postdoctoral scholars at UC. Not all have full-time appointments. Postdoctoral scholars are paid mainly from research grants, and for this reason are more prominent in fields with greater external research funding. Postdoctoral scholars contribute to instruction in the laboratory sciences by working side by side with graduate students. They may also have a formal supervisory function in the laboratory.
1 Includes all postdoctoral scholar titles: employee, fellow and paid direct. Includes those who may hold concurrent titles in other academic or staff categories. Professional Fields include architecture & environmental design, business & management, communications, education, home economics, law, library science and social welfare. Other health professions & clinical sciences include dentistry, nursing, optometry, other health professions, other health sciences, pharmacy, public health and veterinary medicine.
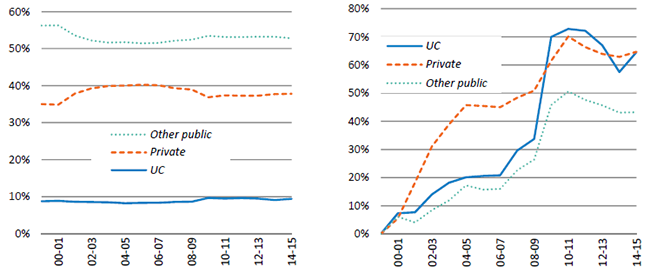
The University of California performs nearly one-tenth of all the academic research and development conducted in the United States.
9.3.1 UC share of U.S.research expenditures,
UC and comparison institutions, 1999–2000 to 2014–15
Source: IPEDS
UC’s contribution to academic research and development activity in the United States has remained constant over the last decade, at between 9 and 10 percent. Over this period, cumulative increase in UC’s research expenditures exceeded the average frowth at other public universities. This reflects both UC’s competitiveness in securing federal awards and UC’s successful relationships with the private sector.
UC is the largest single recipient of funding from the two federal agencies principally responsible for academic research: the National Institutes of Health and the National Science Foundation. UC generally receives 5 to 6 percent of NIH’s annual appropriations for research and 7 to 8 percent of NSF’s annual appropriations.
All research universities experienced a decline in research expenditures during 2012–13 and 2013–14, as stimulus funds from the American Recovery and Reinvestment Act were spent and when Congress enacted cutbacks on research appropriations. The decline at UC was steeper than at private and other public universities on average, largely because UC was successful in attracting over $1 billion in stimulus funds. The Federal Bipartisan Budget Act of 2015 called for increased agency research funding for the next two years, and this is reflected in UC’s research expenditures for 2014–15 and 2015–16 (as evidenced in Indicator 9.1.1). Whether this level of research funding continues depends in large part on the federal budget priorities of the current administration and Congress.
Inflation-adjusted expenditures for research in the medical fields have increased by 92 percent since 1997–98, compared to 44 percent for all other disciplines.
9.3.2 Direct research expenditures by discipline, Universitywide, 1997–98 to 2015–16
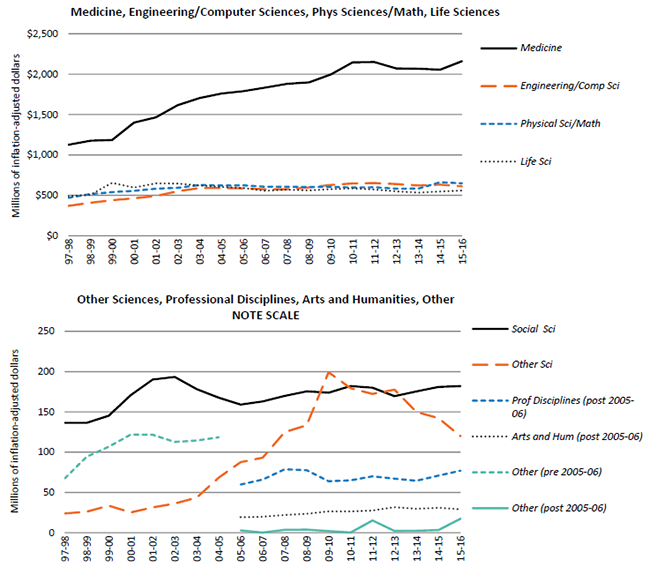
Prior to 2005–06, “Other” included professional and arts and humanities. Source: UC Corporate Financial System.
Research expenditures in all STEM (Science, Technology, Engineering and Mathematics) and medical fields represented over 90 percent of total research expenditures each year during the past decade. This reflects the availability of funding and parallels the nationwide pattern.
Measures based on expenditures substantially underrepresent research activity in the arts and humanities, social sciences and professional disciplines, which make important contributions to scholarship and the quality of life yet have relatively little access to external funding.
Annual research expenditures per ladder-rank faculty are higher at UC than its comparison peers.
9.3.3 Average inflation-adjusted research expenditures per ladder-rank faculty, UC and AAU comparison universities, 2005–06 to 2014–15
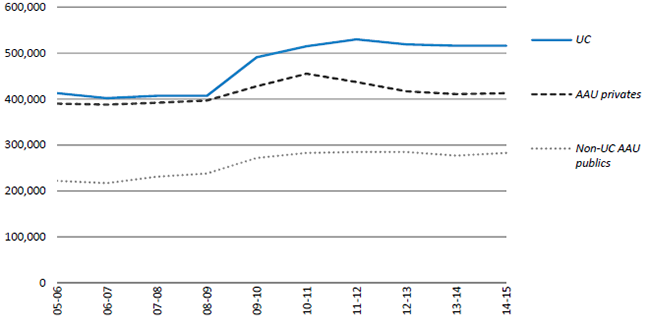
Source: IPEDS
UC faculty are extremely successful at attracting research support from both government and private sponsors. On average, UC annually conducts $516,000 in research per tenured and tenure-track faculty member, which surpasses the average of $413,000 per faculty member for American Association of Universities (AAU) private institutions and $283,000 for AAU public institutions.
The largest single source of research sponsorship is the National Institutes of Health, and campuses with medical schools and hospitals are in the best position to compete for these funds. UC’s second-largest source of research support is the National Science Foundation.
9.3.4 Average research expenditures per ladder-rank faculty, UC campuses, 2014–15
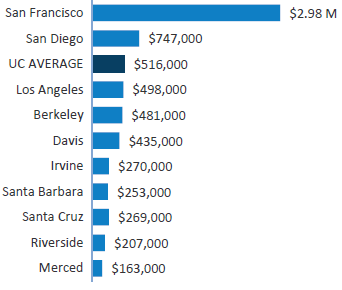
UCSF is an exclusively health science campus, where many non-ladder-rank (clinical) faculty conduct significant research.
UC’s Open Access policies have already resulted in a growing body of freely available research publications in the eScholarship online repository, expanding the global reach of UC’s research findings.
9.4.1 Open Access Project Initiative, Universitywide, March 2013 to March 2017
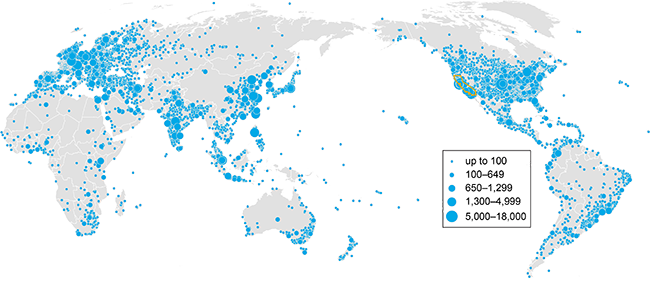
Source: California Digital Library
This map shows the geographic distribution and concentration of the nearly one million downloads of articles deposited under the UC Academic Senate's Open Access policy into eScholarship, a repository managed by UC’s California Digital Library. There are currently over 45,000 articles covered by the Open Access policy available in the repository, 35,000 of which were deposited just in the last two years.
This increased deposit rate is due to an automated publication management system that was implemented in 2015. The recent application of these policies to all UC employees, not just Senate Faculty, by the Presidential Open Access policy promises to further accelerate the growth of publications in eScholarship. The result of this program is a broader global distribution of research findings to the public.
The University of California is a major research presence at both the state and national levels, producing about nine percent of the nation’s research publications.
9.5.1 UC research publication performance, by discipline group, Universitywide, 2011 to 2016
Publication databases can be analyzed to develop measures of the output and impact of UC researchers. The SciVal® research performance system, which draws on Elsevier’s Scopus publication database, shows that UC researchers generated over 337,000 publications between 2011 and 2016 — a scholarly output of about 180 publications per day across the UC system. This represents 8.9 percent of all research publications in the United States.
The quality and impact of UC research publications can be quantified as well. The SciVal® system measures the Field-Weighted Citation Impact (FWCI) to assess research performance, compiling publication citation data across disciplines and comparing the citations of UC research output to state, national and global norms. With the global level set to a baseline of 1.0, the FWCI for the UC system as a whole is 2.05 across all disciplines, higher than both the U.S. average of 1.46 and the AAU average of 1.73. For UC as a whole, the average number of citations per publication is 12.9.
UC’s publication impact is particularly high in the fields of arts and humanities, economics, computer science, engineering and medicine.
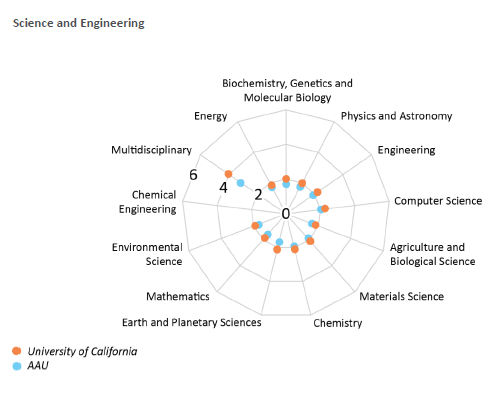
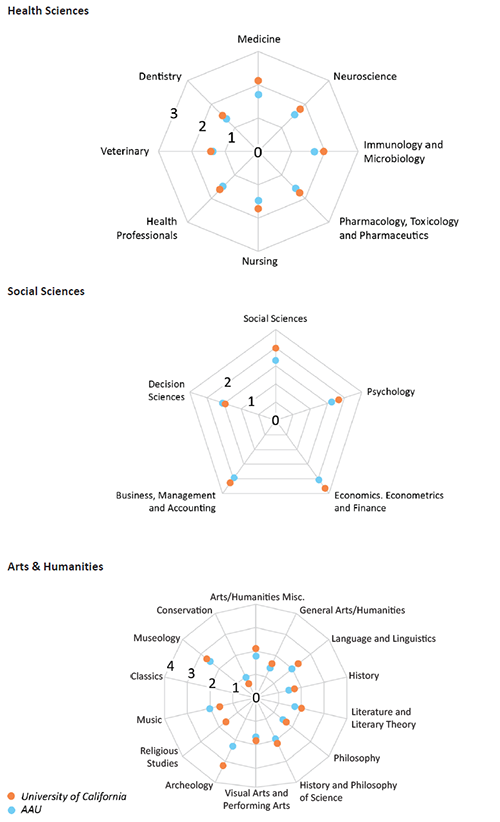
Source: SciVal ® database, Elsevier B.V., http://www.scival.com (downloaded April 19, 2017)
The three UC-affiliated DOE National Laboratories conduct critical research on national nuclear security, alternative energy, conservation technologies and climate science.
9.5.2 Annual expenditures, $ millions, UC-affiliated National Laboratories, 2012 to 2016
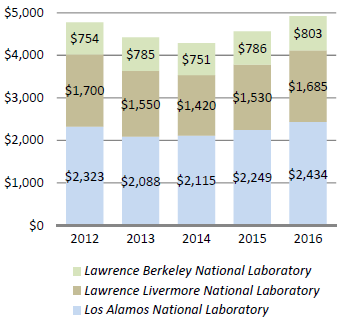
Of the 17 National Laboratories funded by the U.S. Department of Energy, three are managed by the University of California. Lawrence Berkeley National Laboratory, conducts unclassified research across a wide range of disciplines, including new energy systems, quantitative biology, nanoscience environmental solutions and integrated computing as a tool for scientific discovery.
Lawrence Livermore and Los Alamos National Laboratories are national security laboratories, working to ensure the safety, security and reliability of the nation’s nuclear deterrent, to reduce global threats and to solve emerging energy challenges.
Together, the three labs operate annual budgets approaching $5 billion with a combined workforce of nearly 22,000.
9.5.3 Workforce headcount totals, UC-affiliated National Laboratories, 2012 to 2016
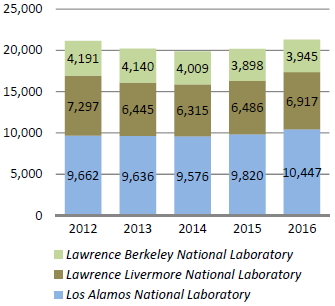
Source: UC National Laboratories, US DOE
The National Laboratories also offer specialized research facilities accessible to UC faculty and the broader academic community. This provides researchers with some of the nation’s most advanced tools of modern science, including cutting-edge, high-performance computing platforms for scientific research, advanced light sources and neutron sources. The three UC-affiliated National Laboratories offer nearly forty such designated user facilities and shared R&D facilities – including LBNL’s National Energy Research Scientific Computing Center, LLNL’s National Ignition Facility, and the Los Alamos Neutron Science Center.1
1https://energy.gov/technologytransitions/technology-transitions-facilities-database
Licenses issued in California contribute to successful businesses. The number of active plant and utility licenses in California is growing.
9.5.4 New Licenses for UC technology issued to California businesses, 2010–11 through 2015–16
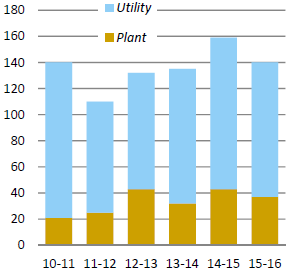
Research is part of UC’s mission, and much of this research is basic, foundational research. However, some UC research leads directly to new inventions and innovations; bringing those innovations from the lab to the marketplace is an intrinsic part of UC’s public service mission.
Innovations from UC take two paths to the marketplace: they may be licensed to an existing company or they may become the cornerstone of a new startup company. Both pathways ultimately benefit the economy of the state of California.
University inventions are classified as utility licenses or plant licenses. Utility licenses cover inventions protected by utility patents, such as processes, machines, manufactured items or compositions of matter. Utility licenses are often issued exclusive to the licensee. Plant licenses cover sexually and asexually reproducing plant varietals, and are often licensed via nonexclusive licenses to nurseries and distribution centers. From the high-tech centers of San Diego and Silicon Valley to the agriculture of the Central Valley, UC technology is licensed throughout California. As of 2016, UC’s license portfolio in California included more than 1,200 utility and plant licenses to more than 550 separate companies.
UC technology licenses active in California, 2016
|
Utility |
Plant |
Total |
| Active Licenses |
642 |
577 |
1,219 |
| Number of Licenses |
407 |
150 |
557 |
9.5.5 UC startups formed per year in California, 2010–11 through 2014–15
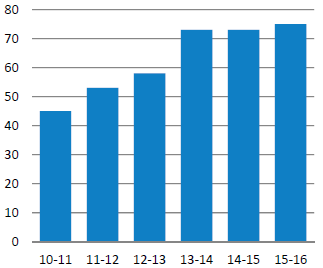
UC startups are independently operating companies that were formed to commercialize a UC technology. The number of startups in California has increased to about 75 companies each year.
Source: UC Innovation Alliances and Services