History
As a public institution of higher education, the University of California is committed to making a college education affordable for all Californians. As a partner in this effort, the California Legislature began providing the University with state funding in 1886 amid booming enrollment. In 1899, the San Francisco Examiner lauded the University for its efforts, saying, “It is one of the glories of the University of California that, for the most part, its students are poor. It is carrying out the purpose of its foundation to put children of citizens of small means on the same footing in opportunities for education as the children of the rich.” In 2017, the New York Times’ College Access Index ranked six UC campuses in the top ten colleges in the nation for their access for low-income students and high rates of graduating them.
It takes a village (and a University) to educate the populace—from William Randolph Hearst offering academic scholarships to women in 1891 to the Evelyn and Walter Haas, Jr. Fund providing $1 million for scholarships to undocumented students in 2012. Since 1972, federal grants from the Pell Grant program, named for U.S. Senator Claiborne Pell, have assisted low-income students in attending UC. Since 1977, California’s generous Cal Grant program has enabled California resident students who meet a minimum GPA from low- and middle-income families to achieve their dream of attending UC. Throughout its history, the University has augmented the federal grants and state-funded Cal Grants with institutional grants and other sources of student financial aid to make and keep a UC education affordable. UC provides significant support to students, making it possible for 56% of UC undergraduates to pay no tuition.
Goals
The goal of the University’s undergraduate financial aid program is to ensure that the University remains accessible to all academically eligible students, regardless of their financial resources.
Affordability is among UC’s highest priorities. The University has maintained a strong record of enabling families from all income levels to finance a high-quality education, and it closely monitors the impact of its pricing decisions and financial aid programs.
Maintaining access
The total cost of attendance and the composition of undergraduates in terms of financial resources set the framework for what is required to provide adequate financial support.
For in-state students who live on campus, the total annual cost of attendance, which comprises tuition and fees and other expenses (e.g., living and personal expenses, books and supplies, transportation and health care), has remained relatively flat over the last several years at about $34,500. This figure compares to about $27,000 on average at other Association of American Universities (AAU) public institutions and around $67,500 for AAU private institutions.
The income profile indicators in this chapter demonstrate that the University remains accessible to low-income students. Between 2008–09 and 2016–17, the proportion of UC in-state undergraduates in the lowest income category increased from 13 percent to 20 percent, with offsetting declines among upper- and upper-middle-income families. These trends reflect both the manageability of UC’s net cost for low- and middle-income families, and the decline in the incomes of UC families since the 2009 economic recession.
In fall 2017, 38 percent of all UC undergraduates received Pell Grants, which are federal grants for low-income students with family incomes typically under $50,000.
Financing a UC education
UC is able to provide access to students across the economic spectrum thanks to a progressive financial aid program that considers how much parents can afford; federal, state and University gift aid or grants; and a manageable student “self-help” contribution from work and/or borrowing.
Gift aid dramatically reduces the net cost of attendance for students and enables those from low- and middle-income backgrounds to enroll in sizable numbers and proportions. The resulting inflation-adjusted net cost of attendance for in-state students from families in the lowest income bracket (less than $56,000) has declined or remained stable since 2004–05.
Federal and state governments provide critical support through the Pell Grant and Cal Grant programs. In addition, UC’s commitment to affordability is evident in the University’s strong systemwide financial aid program. This program helps cover tuition and fee costs as well as non-fee costs such as room, board and book expenses. As a result of this robust institutional financial aid program which combines support from different sources, 56 percent of California resident undergraduates paid no tuition in 2016–17.
Both UC and California have made it a priority to provide financial support to undocumented students. Approximately 4,100 undocumented students received Cal Grants or need-based UC grants in 2016–17, totaling $86.2 million. This past year saw the expansion of the California DREAM Loan program, which provides student loans to undocumented Assembly Bill (AB) 540-students at CSU and UC. The state Legislature provided $2.5M in UC’s 2017–18 budget for the program, which has been matched by UC’s own funding of another $2.5M. Nearly 3,000 students now have access to student loans for the first time as a tool to finance their education. Undocumented students who qualify for a waiver of nonresident supplemental tuition under AB 540 were already eligible for Cal Grants and UC grants since 2013 under the California Dream Act.
An undergraduate’s self-help requirement can be met through a combination of work and loans. UC relies on student surveys — including the University of California Undergraduate Experience Survey (UCUES) and Cost of Attendance Survey (COAS) — to measure how much students work. UCUES data show that over 50 percent of undergraduates do not work. Studies indicate that 20 hours of work per week is the threshold at which undergraduate academic performance may be adversely affected, and UC’s financial aid programs are structured to expect no more than 20 hours. Nevertheless, in the most recent UCUES survey, 10 percent of students reported working more than 20 hours per week, the same share as two years earlier.
For the academic year 2016–17, about 37 percent of undergraduates relied on federal student loans to help finance their education, with loan amounts averaging $5,769. Parental borrowing under the federal PLUS program remained at about 6 percent, with the average PLUS loan amount at about $16,000 per year.
Since 2014–15, California’s Middle Class Scholarship program has provided a new source of gift assistance for students at UC and the California State University with household incomes of up to $164,000 who receive limited or no need-based financial aid. In 2016–17, UC students received $17.7 million in Middle Class Scholarship awards.
Limiting cumulative debt
The proportion of undergraduates graduating with debt is lower than a decade ago. About 50 percent of the class of 2016–17 graduated with debt, with an average amount of $20,600. This translates into a monthly repayment amount of about $220 for 10 years at a 5 percent annual interest rate. This level of debt is manageable considering that a typical graduate who takes out loans earns about $3,300 a month within two years of graduation.
Comparison data show the 2014–15 cumulative debt for UC undergraduates was $21,000, compared to $27,500 for public 4-year institutions and $34,900 for private, nonprofit 4-year institutions.
Looking forward
In early 2017, the Regents and the UC President called for a review of the University’s current Education Financing Model (EFM) to assess its effectiveness in assuring the affordability of a UC undergraduate education to all qualified students regardless of family resources. The working group conducting the review recognized that UC both enrolls a greater proportion of low-income students than any other top research university, and is successful in graduating them. The working group also made several recommendations for improving the EFM, including advocating for additional Cal Grant eligibility for summer terms, improving the measurement of total cost of attendance, investigating strategies to limit housing and health care cost increases, and expanding financial literacy training for students.
For more information
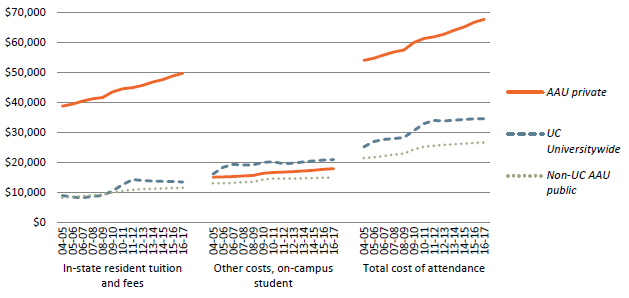
UC resident tuition and fees and total costs have remained relatively flat over the last several years, and while they still exceed the national average for AAU public institutions, they remain below the average for AAU private institutions.
2.1.1 Total cost of attendance for undergraduate in-state residents, Universitywide and comparison institutions, 2004–05 to 2016–17
Source: IPEDS1
The total cost of attending college includes tuition and fees as well as living expenses, books and supplies, transportation, health insurance and personal expenses. The total cost of attendance is higher at UC than at AAU (Association of American Universities) public comparison institutions partly because of the relatively high cost of living in California.
After increases during the great recession, UC tuition and fees and the total cost of attendance have remained relatively flat in the past several years.
1 Charges are for in-state students living on campus. Averages are simple averages. Weighted averages for UC can be found at here. A list of the 28 non-UC AAU public and 26 AAU private institutions in the comparison groups can be found in the data glossary.
Regardless of income, the net cost of attendance after financial aid for CA resident students has remained stable or declined since 2011–12. The net cost of attendance for nonresident students is substantially higher and continues to grow.
2.1.2 Net cost of attendance by family income and California residency, Universitywide, 2016 inflation-adjusted dollars, 2002–03 to 2016–17
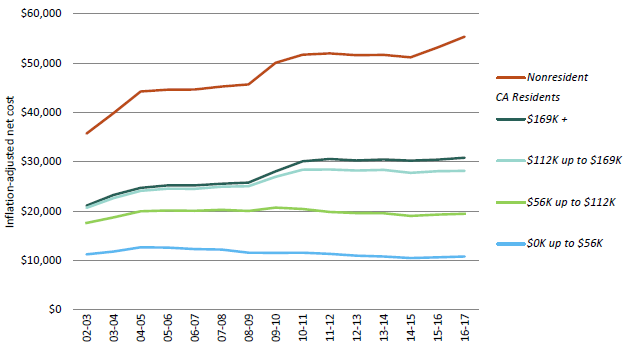
Source: UC Corporate Student System1
A measure of the University’s affordability is its average net cost of attendance. This represents the actual cost of attending the University for undergraduates after taking into account scholarships and grants. Scholarships and grants reduce the net cost of attending UC for students at all income levels but have the greatest impact on students from low- and middle-income families.
The availability of scholarships and grants has mitigated the impact of cost increases on students from families earning less than $100,000.
Between 2002–03 and 2016–17, the net cost declined by about $700 in inflation-adjusted dollars for in-state students in the lowest income category due to this scholarship and grant support.
Nonresident students face a much higher net cost of attendance since they face annual supplemental tuition charges of approximately $28,000, and since 2016–17 have not been eligible to receive institutional need-based grant aid.
1Income ranges are approximate. Independent students are excluded. Net cost is the full cost of attendance less any grants, scholarships and fee exemptions. Income is based on amounts reported in either the Free Application for Federal Student Aid (FAFSA) or the UC Application for Undergraduate Admission or, if missing, is imputed based on demographic profiles.
UC enrolls a higher percentage of Pell Grant recipients than any other top research university in the country.
2.2.1 Undergraduate Pell Grant recipients, UC and comparison institutions, 2015–16
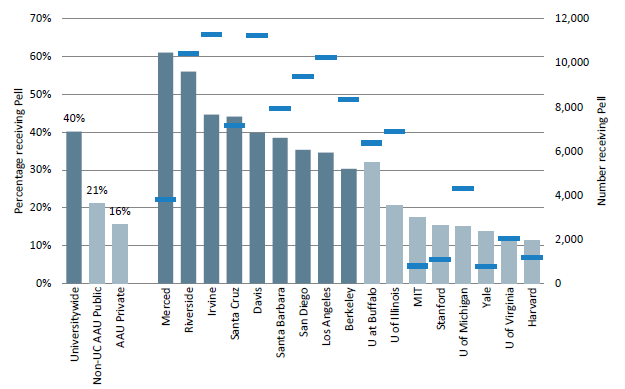
Source: IPEDS1
The percentage of undergraduate students with Pell Grants, a federal aid program for low-income students, provides a useful means to compare different institutions in terms of their accessibility for low-income students. It is also a useful indicator for assessing the socio-economic diversity of an institution’s undergraduate student population.
The data shown represent the most recent year that data on comparison institutions are available. The proportion of UC undergraduates receiving Pell Grants went up from 31 percent in 2008–09 to 40 percent in 2015–16. This is primarily a result of increased federal spending, which made more students eligible for Pell Grants, as well as the economic downturn, which caused broad declines in family income. In fall 2017, 38 percent of UC undergraduates and 45 percent of California residents received Pell Grants. Nationally, the percentage of Pell Grant recipients has declined since 2010-11 partially due to a recovering economy.
1 Percentage reported is that of students who received Pell Grants at any time during the 2015–16 year as a percentage of all undergraduates. Note that Pell Grant eligibility criteria change annually because of the federal appropriations process and other formula changes. Thus, trend analysis of Pell recipients would not be a valid measure of changes in low-income students but rather would reflect the changes in eligibility criteria. A list of the institutions in the AAU comparison groups can be found in the data glossary.
A large proportion of UC students come from low-income families, especially at UC’s newer campuses.
2.2.2 Undergraduate income distribution, Universitywide and UC campuses, 2016 inflation-adjusted dollars
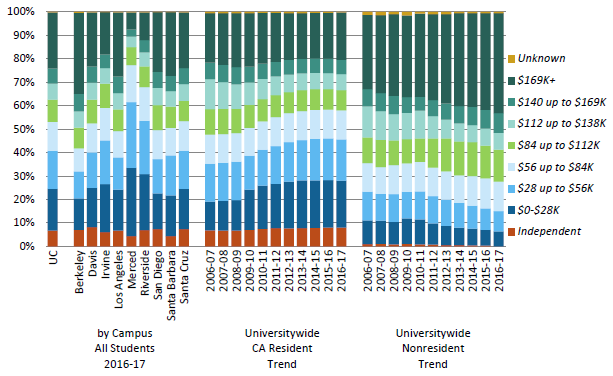
Source: UC Corporate Student System1
While all UC campuses enroll a significant proportion of low-income students, the proportion varies by campus and California residency.
In-state students are more likely to be from low-income families, with 20 percent in the lowest income category in 2016–17. Since 2008–09, the proportion of low-income California resident students increased noticeably, with an offsetting decline among upper- and upper-middle-income families. During the last two years, however, the income distributions of California resident families have stabilized.
This suggests that the University’s financial aid programs keep the net cost of attendance within reach of California resident and low-and middle-income families.
Conversely, more than 40 percent of nonresident students came from families in the highest income category in 2016–17. This proportion has increased steadily over the years while those in the lower- and middle-income categories have decreased.
1 Note that prior to 2007–08, an increasing number of students at one campus with parent incomes above $100,000 were incorrectly categorized as having an income of $100,000. This problem was fixed in 2007–08, resulting in an apparent (but not actual) decline in the percentage of students shown in the $107,000 to $134,000 category and a corresponding increase in the percentage shown in higher income categories.
The share of UC students who felt that the cost of attendance was manageable has been relatively stable over the past several years.
2.3.1 Student response to “With grants and scholarships, if any, the total cost of attending the school is manageable," Universitywide and comparison institutions, 2011–12 to 2015–16
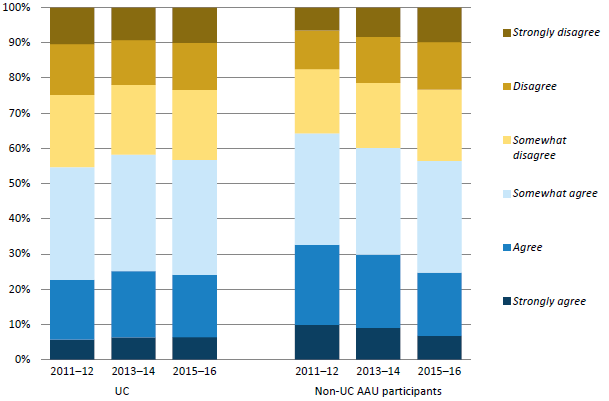
Source: UCUES1
Fifty-seven percent of UC undergraduates in spring 2016 felt that the cost of attendance was manageable. This figure was 58 percent in spring 2014 and 55 percent in the spring 2012 UCUES survey. Fifty-eight percent of survey respondents at other participating AAU institutions in 2015–16 agreed that the cost of their education was manageable.
The list of non-UC AAU participants in this comparison was not the same for all three years shown. The non-UC schools included in 2011–12 were U Minnesota, Rutgers U, U Pittsburgh, USC, Texas A&M U and U Virginia. In 2013–14, additional schools included U Michigan, Indiana U, Purdue U, U Iowa and U Washington.
1 SERU is the Student Experience in the Research University survey, which is administered at a number of AAU institutions.
The average inflation-adjusted debt at graduation of student borrowers increased by 7.9 percent (from $19,100 to $20,600) over the past 15 years.
2.3.2 Student loan debt burden of graduating seniors, inflation-adjusted, Universitywide, 2000–2001 to 2016–17 (average debt of those with debt shown above each year)
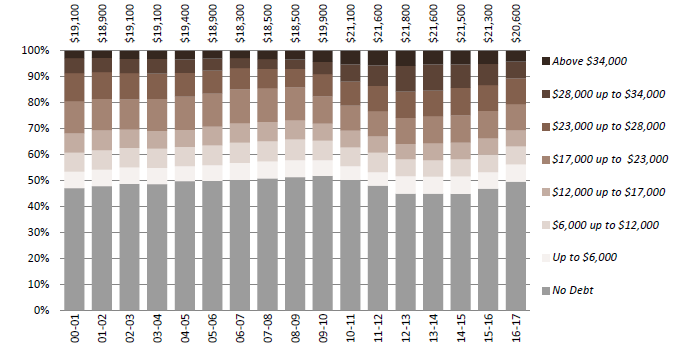
Source: UC Corporate Student System1
Fifty percent of UC undergraduates graduate with no debt at all. For those who do borrow, the average student loan debt at graduation in 2016–17 was about $20,600. The monthly repayment for this amount is about $220 for 10 years at the 5 percent average interest rate that typically applies to student loans. Lower payments are available with longer repayment periods. For more information about estimated loan repayment amounts, using this rate, visit the “Loans and Earnings” tab of the UC Alumni-at-work dashboard at: https://www.universityofcalifornia.edu/infocenter/uc-alumni-work
These figures reflect the borrowing of all graduating UC students. California resident students, however, are more likely than out-of-state students to graduate with debt. In 2016-17, about 56 percent of UC graduates who originally entered as California resident freshmen had student loan debt upon graduation, compared to only 17 percent of out-of-state students. In-state graduates’ average debt, however, was significantly lower than that of the out-of-state students who borrowed ($20,100 vs. $28,700).
1 Figures are adjusted for inflation in 2016 dollars using CA CPI-W. Borrowing shown here represents loans coordinated through the campus financial aid offices; some families also borrow from outside sources, which are not captured in this indicator. Data only include graduates who originally entered as freshmen.
Despite recent increases, the proportion of students graduating with loan debt across all incomes was still lower in 2016–17 than it was 15 years ago.
2.3.3 Student loan debt burden of graduating seniors by parent income, Universitywide, 2000–2001 to 2016–17
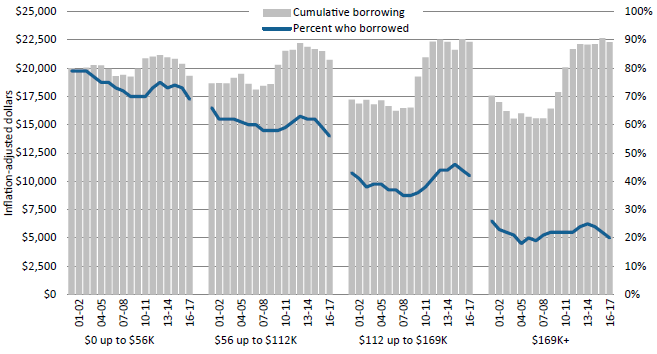
Source: UC Corporate Student
The proportion of students who borrow decreased steadily from 2000–01 through 2009–10 for students in nearly every income category. From 2010–11 through 2012–13, student borrowing increased, both in percentage and in cumulative amount. This uptick in borrowing may reflect a combination of higher costs and a reduction in other borrowing alternatives (e.g., home equity loans). In the last year however, student borrowing has decreased for all income categories.
UC student debt remains below the national average for both public and private non-profit 4-year institutions.
2.3.4 Average cumulative loan debt, UC and national comparison institutions, 2014–15 graduates
|
Berkeley
|
$18,012
|
|
Davis
|
$19,798
|
|
Irvine
|
$20,853
|
|
UC AVERAGE
|
$21,018
|
|
Santa Barbara
|
$21,207
|
|
Merced
|
$21,411
|
|
Los Angeles
|
$21,831
|
|
San Diego
|
$21,895
|
|
Riverside
|
$21,649
|
|
Santa Cruz
|
$22,825
|
|
|
|
|
Public 4-year
|
$27,550
|
|
Private nonprofit 4-year
|
$34,900
|
|
National Average
|
$30,100
|
Source: TICAS. National average excludes private, for-profit institutions.
1Figures are adjusted for inflation in 2016 dollars using CA CPI-W. Borrowing shown here represents loans coordinated through the campus financial aid offices; some families also borrow from outside sources, which are not captured in this indicator. Independent students and students with unknown parent incomes are not shown. Data only include graduates who originally entered as freshmen.
By five years after graduation, all of UC’s baccalaureate programs have debt-to-earnings ratios of less than 10 percent.
2.3.5 Debt-to-earnings ratios for UC undergraduate alumni at two and five years after graduation, Universitywide and by Campus, Undergraduate graduating cohorts 1999-2014, with student loan debt who are working in California
|
|
Debt-to-Earnings 2 Years After Graduation
|
Debt-to-Earnings 5 Years After Graduation
|
|
Campus
|
% of programs with <10% debt-to-earnings
|
Min
|
Median
|
Max
|
% of programs with <10% debt-to-earnings
|
Min
|
Median
|
Max
|
|
Berkeley
|
100%
|
2%
|
4%
|
7%
|
100%
|
1%
|
3%
|
6%
|
|
Davis
|
98%
|
2%
|
4%
|
11%
|
100%
|
2%
|
3%
|
8%
|
|
Irvine
|
98%
|
3%
|
5%
|
10%
|
100%
|
2%
|
4%
|
6%
|
|
Los Angeles
|
100%
|
2%
|
5%
|
9%
|
100%
|
2%
|
3%
|
8%
|
|
Merced
|
75%
|
4%
|
8%
|
11%
|
100%
|
3%
|
4%
|
5%
|
|
Riverside
|
89%
|
3%
|
6%
|
13%
|
100%
|
3%
|
4%
|
8%
|
|
San Diego
|
100%
|
3%
|
5%
|
9%
|
100%
|
2%
|
4%
|
7%
|
|
Santa Barbara
|
98%
|
3%
|
5%
|
11%
|
100%
|
2%
|
4%
|
7%
|
|
Santa Cruz
|
96%
|
3%
|
6%
|
11%
|
100%
|
2%
|
4%
|
7%
|
|
UC
|
97%
|
2%
|
5%
|
13%
|
100%
|
1%
|
3%
|
8%
|
Source: AEO ( CA Employment Development Department), student financial aid and degree data1
UC’s baccalaureate programs graduate students who go on to achieve positive earnings trajectories. It is also important to consider these earnings in the context of any student loan payments graduates might be responsible for making. The University of California’s financial aid policy sets its debt manageability threshold at 9 percent. It considers debt that requires anywhere from 5 to 9 percent of a graduate’s monthly earnings to be manageable. With median monthly gross earnings at $3,139 per month and the estimated loan repayment for those taking out loans at $167 per month, this equates to a 5% debt-to-earnings ratio at two years after graduation. About 97 percent of UC baccalaureate programs systemwide have a debt-to-earnings ratio of 10 percent or less at two years after graduation and 100 percent of them do at five years after graduation.
Some arts, humanities and social science programs have debt ratios that exceed 10 percent 2 years after graduation. This stems from a variety of factors, including the lower average earnings associated with industries in which these graduates tend to work in. (See 3.3.5 for earnings by major and industry in Chapter 3.)
1 Under a standard ten-year repayment plan at five percent interest.