Accountability Report 2016

Chapter 11:

Goals

Under California’s Master Plan for Higher Education, the University of California is delegated the primary responsibility in public higher education for doctoral education. For the health professions, this means that UC is the only California public institution chartered to grant the following professional degrees: D.D.S. (Doctor of Dental Science), M.D. (Doctor of Medicine), O.D. (Doctor of Optometry), Pharm.D. (Doctor of Pharmacy) and D.V.M. (Doctor of Veterinary Medicine). Along with other private educational institutions, UC also provides doctoral education leading to Ph.D. degrees in Nursing and Public Health, as well as the Dr.PH (Doctor of Public Health) degree.

UC health sciences programs are national and international leaders in teaching, research and clinical care. In support of these programs, UC provides leadership and strategic direction to advance the missions of the University’s 17 health professional schools and 12 hospitals, referred to collectively as UC Health.1

A significant portion of UC’s mission of instruction, research and public service, as measured in terms of operating expenditures, occurs under the auspices of UC Health. In 2014–15, operating expenditures for UC Health, including UCSF Benioff Children’s Hospital Oakland, rose to about $14.8 billion, about half of the University’s total operating expenditures. Of this amount, the largest component was $7.9 billion expended by the medical centers in the delivery of health care services. Other major components include $2.5 billion for instructional activities and $2.1 billion spent on research.

In fall 2015, about 41 percent of all UC faculty worked in health science disciplines. (More information about the health science faculty is presented in Chapter 5 – Faculty and Other Academic Employees.)

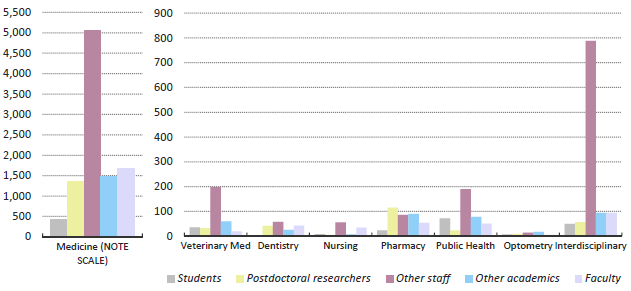
In fall 2015, 42 percent of postdoctoral fellows were in health science disciplines.2

Educating health care professionals

The University of California operates the largest health sciences instructional program in the nation, enrolling more than 14,000 students annually. The systemwide instructional program includes six schools of medicine and three smaller medical education programs (located at Berkeley, in Fresno and at the Charles R. Drew University of Medicine and Science in Los Angeles); three schools of nursing (and one program in nursing science at Irvine); two schools each of dentistry, pharmacy and public health; and one school each of optometry and veterinary medicine. The long-standing medical education program that operated jointly between UC Riverside and UCLA for more than 30 years transitioned in 2013 to an independent UC medical school.

A focus on medical research

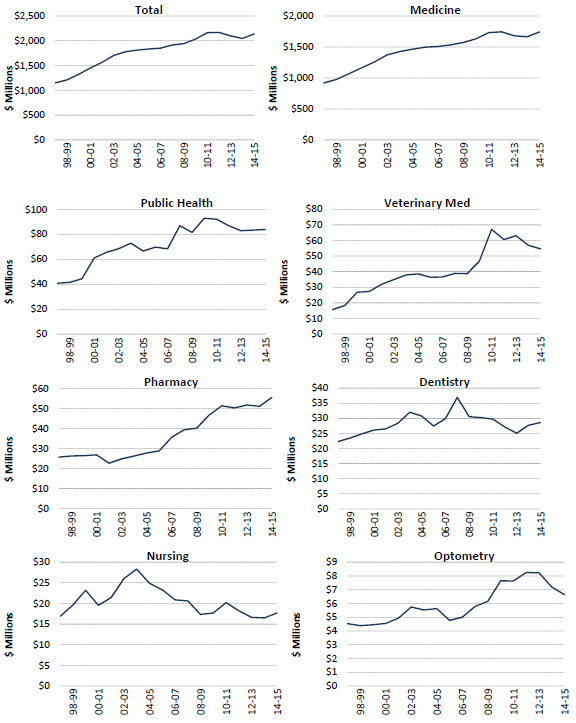
Health science research expenditures represent the single largest disciplinary focus of UC’s research enterprise. Half of UC’s total research expenditures were for medical research, including related fields such as public health and veterinary medicine. More than half of the funding for this medical research was provided by federal agency awards to UC.

Clinical trial research is an increasingly important component of UC’s medical research enterprise. During 2014–15, there were more than 2,900 clinical trials underway systemwide, and of the $2.3 billion UC received that year in medical research awards, about 14 percent of the total was targeted for clinical trials. More than 87 percent of these clinical trial projects were sponsored by businesses.

These clinical trials occupy a unique position in UC’s research enterprise. They represent the final stage in the journey from a scientific discovery or innovation to an effective therapy or treatment that could significantly enhance global health.

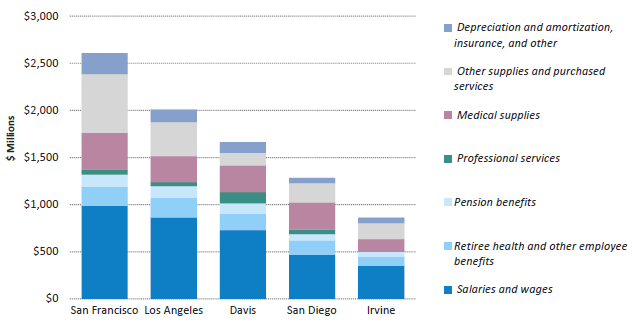
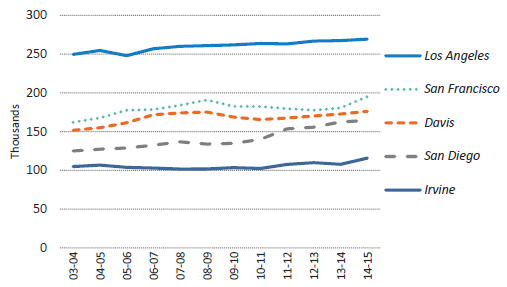
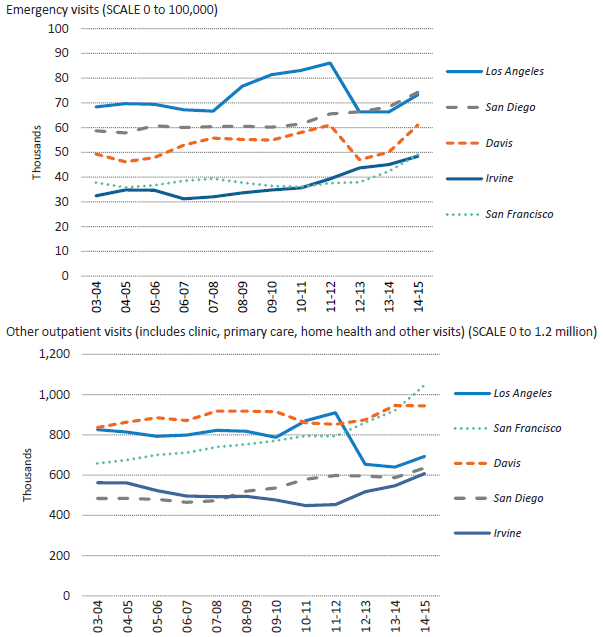
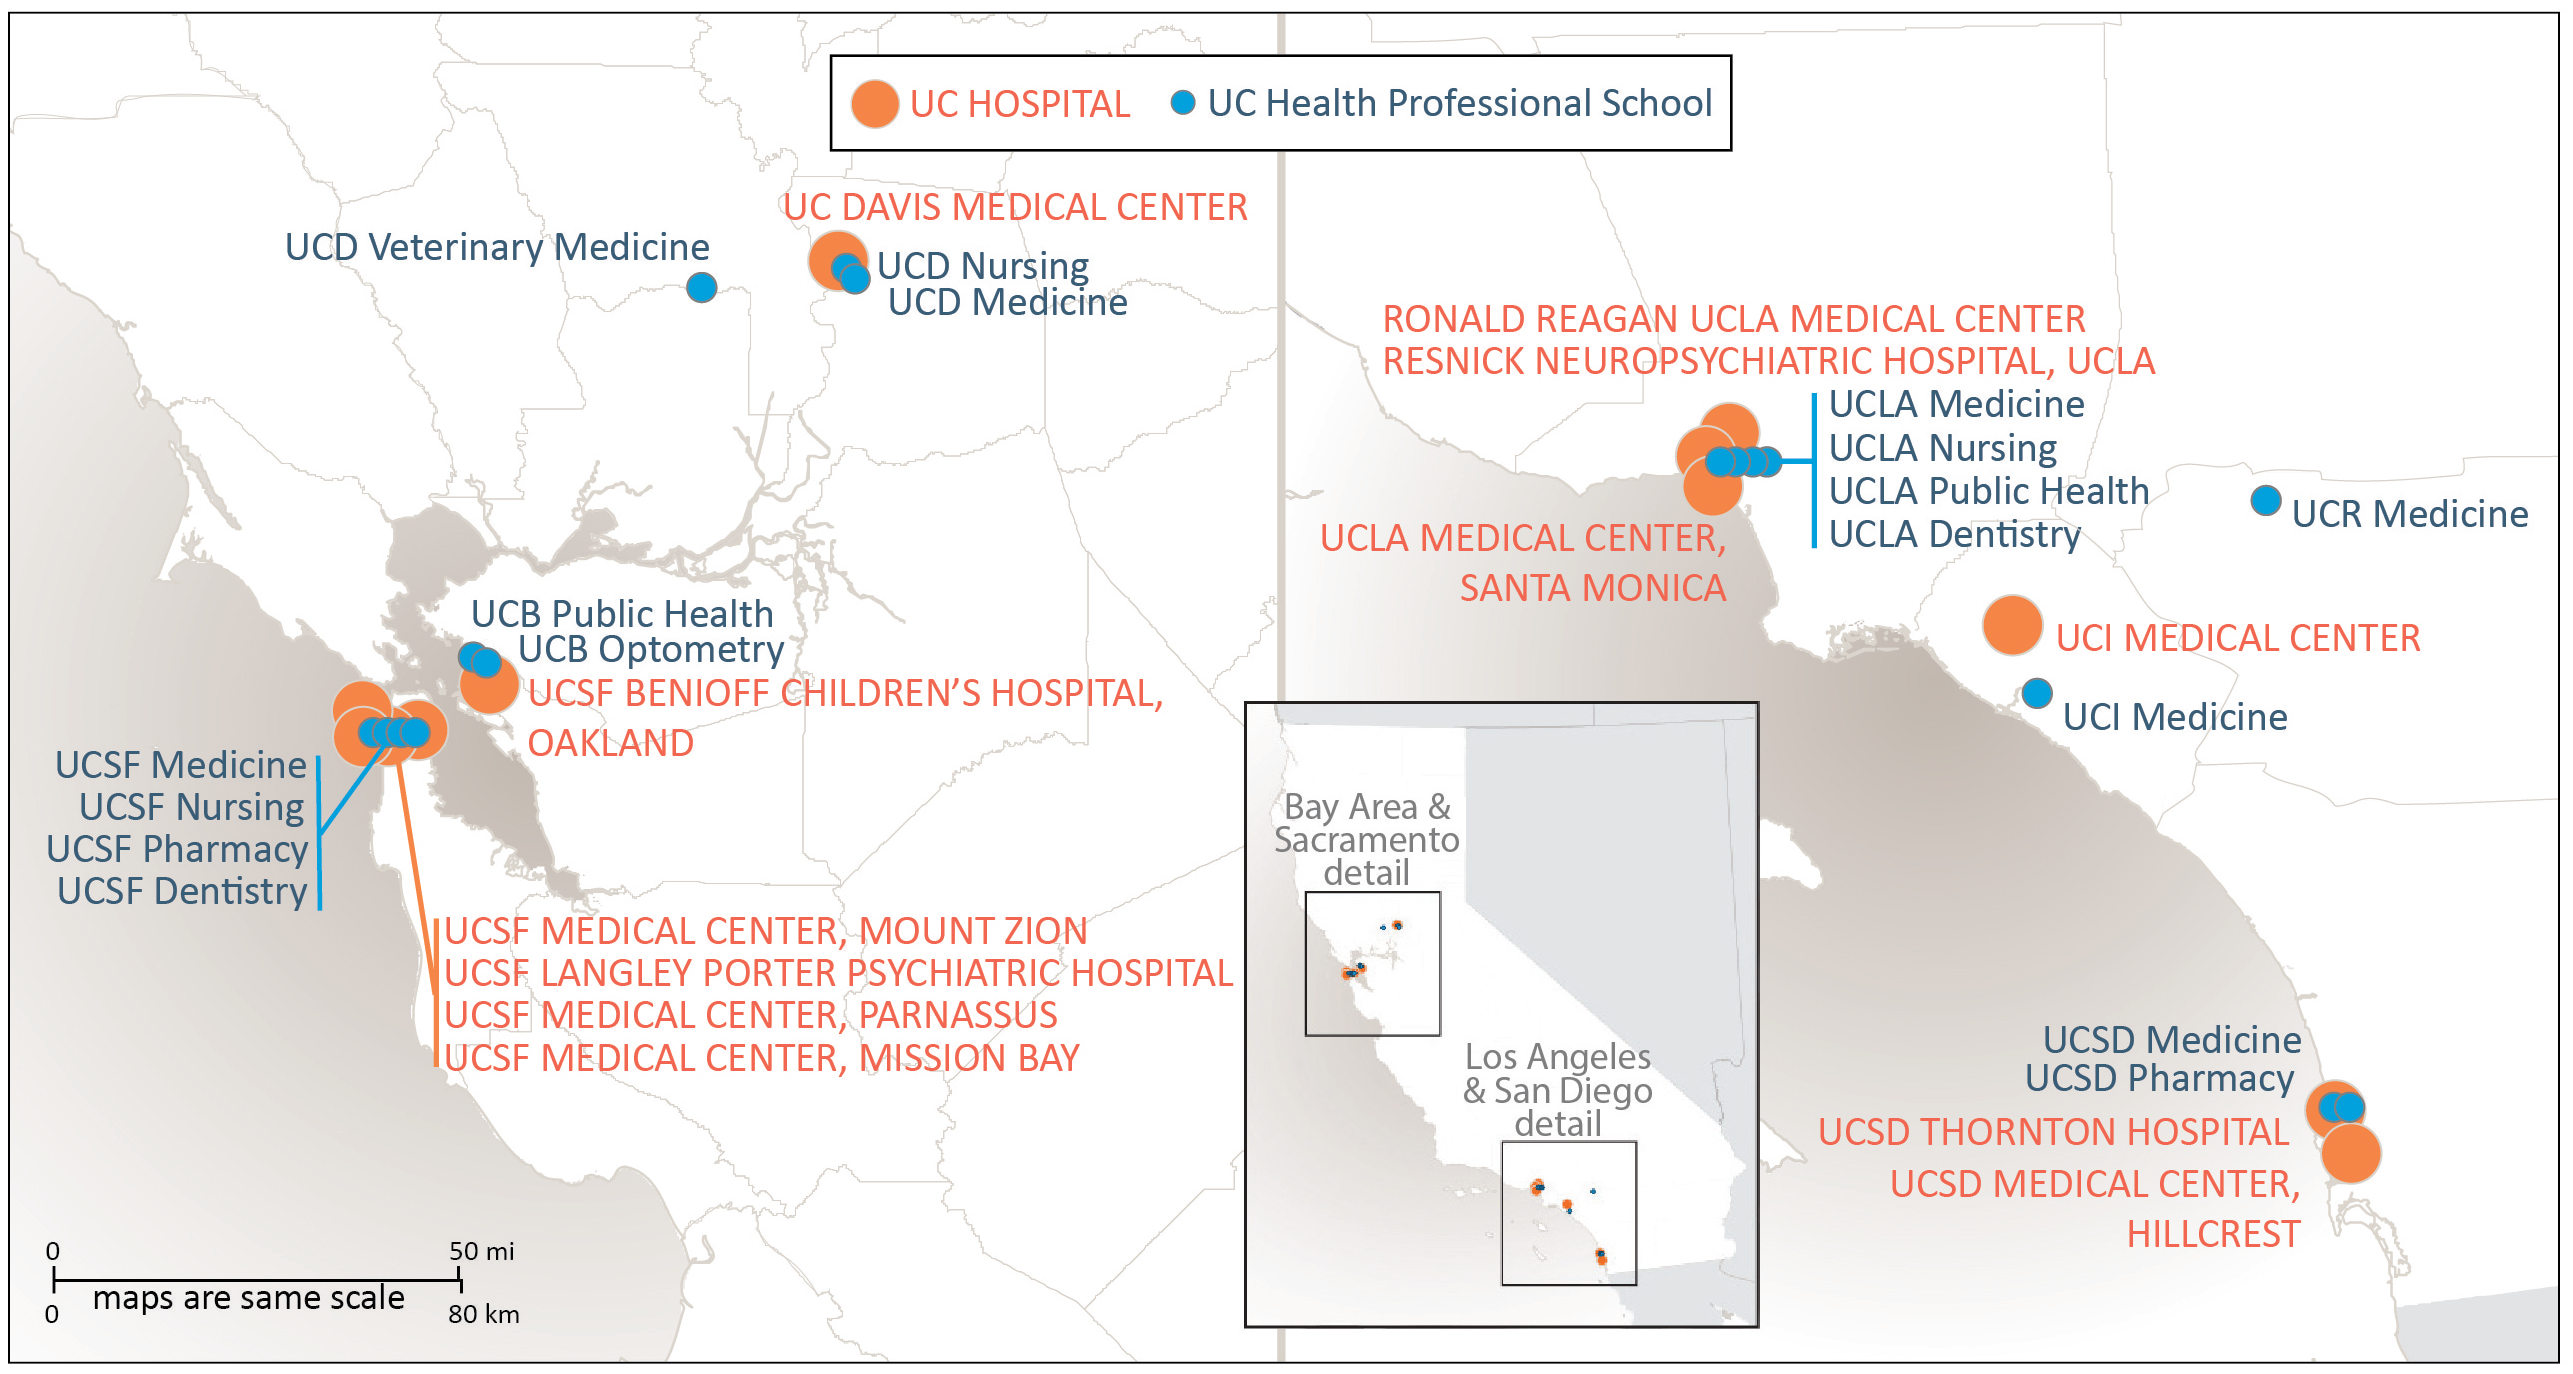
The University of California’s five academic medical centers (Davis, Irvine, Los Angeles, San Diego and San Francisco) provide a vast resource for the clinical training programs of UC health professional schools. These centers prepare future generations of health professionals; they catalyze major advances in biomedical and clinical research; and they serve as California’s fourth-largest health care delivery system, with about 41,000 employees, including more than 12,000 nurses. UC operates or staffs five major trauma centers, providing half of all transplants and one-fourth of extensive burn care in the state. UC hospitals are also designated as Ebola treatment centers for the state. UC medical centers manage more than 165,000 inpatient admissions, 356,000 emergency room visits and 4.5 million outpatient visits each year. Nearly 60 percent of patient days at UC medical facilities are for patients covered by Medicare or Medi-Cal, or who lack health insurance. In support of the University’s teaching, research and public service missions, UC health programs also maintain active relationships with more than 100 affiliated Veterans Affairs facilities, as well as county and community-based health facilities located throughout California.

In view of the size and contributions of health-related programs across the UC system, select performance indicators related to students, faculty and research are included both in this chapter and in the respective sections of this report that are devoted to those subject areas. For example, indicators related to students enrolled in UC professional degree programs are also included in Chapter 4 (Graduate Academic and Graduate Professional Students). Chapter 5 (Faculty and Other Academic Employees) includes indicators related to UC faculty appointments, headcounts and conferral of doctoral degrees. Information regarding diversity is found in Chapter 7. Research workforce indicators for medicine and health sciences, as well as indicators for general funding and expenditures, are included in Chapter 9 (Research — Increasing Public Knowledge).

In addition, this chapter includes information and performance indicators for various aspects of the University’s health sciences system, including regarding health professional degree students, health sciences instruction and research expenditures, and the health sciences academic workforce. This section also includes a number of indicators and metrics related to the University’s health care delivery system.

UC Health Locations

Looking forward

California’s population is growing, aging and increasing in diversity. Already the most populous state in the nation, California’s population is projected by the Department of Finance to grow 39 percent from 2012 to 2060. Statewide shortages and maldistribution of health care providers already exist in many health professions. These challenges will grow as health care reforms drive increasing demand for quality and accountability in the delivery of health services. At a time of unprecedented budgetary challenges, the financial success of UC medical centers has been an important resource for helping to back-fill diminishing state support for UC schools of medicine. However, the changing environment for health care signals changes that threaten this financial success and the ability of the medical centers to help support the academic mission of UC medical schools. Among these financial challenges are reductions in federal and state spending for programs such as Medicare, Medi-Cal and the National Institutes of Health, and challenges associated with the implementation of health care reform.

Notwithstanding these challenges and the uncertainties related to health care reform, UC Health is working to support new initiatives to help meet current and future health care needs. Within the health professions, these include the opening of the Betty Irene Moore School of Nursing at UC Davis; the creation of new programs at each UC medical school in medical education focusing specifically on the needs of medically underserved communities; and the opening of a new medical school at UC Riverside, concentrating on the needs of California’s Inland Empire. This is the first new allopathic (M.D.-granting) medical school to open in California in more than 40 years.

To recognize and accelerate implementation of innovative practices in clinical care, UC Health launched the UC Center for Health Quality and Innovation in 2010. The center promotes innovations in clinical care that improve patient outcomes and quality of care within the UC system and beyond. These and other activities are among the many initiatives now underway at UC to help improve quality, access and value in the delivery of health services.

Leveraging Scale for Value

The Leveraging Scale for Value (LSFV) initiative is the systemwide approach to creating value and improving outcomes. LSFV includes work on revenue cycle, supply chain and information technology (IT). The supply chain/procurement teams across UC Health are implementing a strategy of cost reduction and standardization by partnering with the clinical enterprise and other key stakeholders. LSFV delivered $52 million in savings for FY 2015 and is on track to deliver $100 million for FY 2016. The supply chain/procurement goal is expected to grow to $150 million in FY 2017.

New Governance Model for UC Health

In November 2015, the University of California Board of Regents adopted amendments that streamlined the oversight of UC Health to support the continued growth of UC’s academic medical centers. The Regents’ governance of UC Health continues through a modified Committee on Health Services, with seven voting regents and eight non-voting advisory members who are leaders in health care delivery, health policy and academic medicine. The committee has primary responsibility for strategic plans and budgets for UC’s clinical enterprise; patient care quality, cost and access; certain health care transactions; compensation for certain UC Health senior leaders; and various systemwide UC Health Initiatives.


1 Data in this chapter exclude UCSF Benioff Children’s Hospital Oakland except where noted.

2 Statistics are by headcount rather than FTE. Headcount numbers tend to be larger than FTE, especially in the health sciences, because non-ladder-rank health science faculty, such as clinical faculty, are more likely to have joint or partial appointments.


FOR MORE INFORMATION

The UC Health website provides an in-depth description of UC Health facilities and activities.


Medicine is by far the largest UC health professional discipline. Medical students and residents together make up roughly two-thirds of all UC health professions students.

11.1.1 State-supported graduate health sciences students, by discipline, Universitywide, Fall 2015

11-1-1

Source: UC Information Center Data Warehouse

Health sciences students are in one of three program categories: professional degree programs, academic programs or residency programs. Professional degree programs lead to degrees such as M.D., D.D.S and D.V.M. Academic programs lead to a master’s or Ph.D. Residents are professional school graduates (i.e., dental, medical, optometry, pharmacy and veterinary medical schools) who participate in specialty training programs after completing their degree programs.

The other UC health science students shown above are in health-related life science disciplines, such as biomedical science, bioengineering, pharmacology, neuroscience and epidemiology.


Health science professional degree fees have leveled off after incurring sharp increases during years of declining state support.

11.1.2 Average total charges1 for UC health professional degree students Universitywide, 2004–05 to 2015–16

11-1-2

Source: UC Budget Office and UC campuses


Student charges include tuition and fees assessed systemwide to all students, along with professional degree supplemental tuition, campus-based fees and health insurance assessed at the campus program level.

Professional degree fees (now referred to as professional degree supplemental tuition) vary across programs and across campuses; the figures shown above are the averages across all campuses with the associated programs.

State support for UC’s professional schools declined significantly during recurring state fiscal crises, resulting in a dramatic increase in professional fees.

Calculated as the mean of total California resident charges at each campus. Includes mandatory tuition and fees (educational and student services), professional degree supplemental tuition, health insurance, campus-based fees and other fees where applicable. Averages are simple averages based on campus amounts; the number of students in each program is not taken into account.


Many UC health professional degree students borrow to help pay for their education and average debt levels are increasing.

11.1.3 UC health student debt at graduation, Universitywide, 1999–2000 to 2014–15

11-1-3

Source: UC Corporate Student System1

Increases in tuition over the past decade have coincided with increased debt burdens for UC health professional degree students. Increases in the average student debt of graduates of UC schools of dentistry, veterinary medicine, medicine, pharmacy, optometry and nursing are illustrated in the figure shown above, and are representative of debt patterns for other health science professional programs.

At least one-third of the revenue from professional school fees is used to provide financial aid to help maintain the affordability of a professional school education and provide loan forgiveness for graduates in low-earning positions. Nonetheless, the increasing educational debt burden for graduates of UC’s professional degree health science programs raises concerns about the University’s ability to recruit the most highly qualified students. Anticipated debt levels are also identified as a major concern by students who have previously expressed interest in primary-care careers and/or practicing in a medically underserved community or health professional shortage area.

1 Average debt is for those with debt.


Medical and dental practice income supported over half of the instructional expenditures in the health sciences in 2014–15 (primarily for their respective educational programs).

11.1.4 Health sciences instructional expenditures, Universitywide, 2014–15

11-1-4

Source: UC 2015–16 Budget for Current Operations and UC Budget Office

The continuing financial success of the medical centers is crucial to the programmatic success of many of the University’s health professional schools, especially the schools of medicine. Overall, approximately $1.2 billion from the medical centers goes to health system support. Roughly 65 percent is in the form of purchased services, such as support for a faculty medical director or director of the residency program, while 35 percent is in the form of cash support for programs, such as the recruitment of a new program director.

State and UC general funds provided about 15 percent of expenditures in health sciences instruction.

Academic and staff salaries and benefits constitute nearly three-quarters of all health sciences instructional expenditures.


Recent increases in federal research funding have resulted in an overall increase in health research activity systemwide.

11.2.1 Research expenditures, by health science discipline [Note Scales], Universitywide, 1997–98 to 2014–15

11-2-1

Source: UC Corporate Financial System. All amounts are adjusted for inflation.


Research in medicine constitutes the bulk of health science research and involves by far the largest number of faculty, staff and students.

11.2.2 Health science research workforce FTE [Note Scales], Universitywide, 2014–15

11-2-2

Source: UC Corporate Personnel System. Categories are based on UAS discipline assignment.

The approximately 12,500 FTE shown above represent about 27,000 headcount personnel. Students and staff assistants often have part-time appointments. Faculty and academics, in addition to their research duties, have joint appointments as instructors, administrators and clinical service providers.

Other academics are primarily project scientists, professional researchers, specialists, and medical interns and residents. Other staff includes research associates, technicians, laboratory services, computer programmers/analysts, social services and administrative support.


In 2014–15, UC’s five medical centers represented a health care delivery enterprise of nearly $8.5 billion.

11.3.1 Medical center operating expenses, Universitywide, 2014–15

11-3-1

Source: UC Medical Centers Audited Financial Statements.

In 2014–15, operating expenditures for UC’s five medical centers amounted to about $8.5 billion (including depreciation and amortization). UCSF Benioff Children’s Hospital Oakland operating expenses for medical services, not shown in this chart, represented an additional $542 million.


The majority of medical center staff members are in UC’s Professional and Support Staff (PSS) personnel program; the majority of these are unionized.

11.3.2 Medical center staff FTE, by personnel program, Universitywide, Fall 2004 to fall 2015

11-3-2

Source: UC Corporate Personnel System

Three unions — AFSCME Patient Care Technical Union, the California Nurses Association and the UPTE Health Care Professionals — represent more than 90 percent of the unionized medical center employees.


UC hospitals provide almost 900,000 inpatient days a year and serve a significant number of patients statewide.

11.3.3 Hospital inpatient days, UC medical centers, 2003–04 to 2014–15

11-3-3

Source: UC Medical Centers’ Audited Financial Statements1

The University’s academic medical centers operate in highly dense areas located throughout the state, including Orange, Sacramento, San Diego and Los Angeles counties, as well as the San Francisco Bay Area. Three of the five centers are former county hospitals. Each medical center has several primary care and specialty clinics distributed across the communities it serves.

In addition to providing primary and specialty care, UC medical centers treat critically ill newborns, care for cancer patients, and treat half of all transplant patients and one-quarter of extensive burn cases in California. As tertiary and quaternary care centers, they also treat patients who require highly specialized and intensive care, and who are referred from other hospitals that lack the resources and expertise to care for them.

“Inpatient days” represents the total number of days that all patients spend in a hospital bed. The graph presented here displays the total number of inpatient days at the five UC medical centers.

1 UCLA Medical Center = UCLA Medical Center, Ronald Reagan, Santa Monica and Resnick Neuropsychiatric
UCSD Medical Center = UCSD Medical Center, Hillcrest and Thornton
UCSF Medical Center = UCSF Medical Center, Parnassus and Mount Zion


UC medical centers handle almost 4.5 million outpatient visits per year.

11.3.4 Outpatient visits, UC medical centers, 2003–04 to 2014–15

11-3-4

Source: UC Medical Centers Audited Financial Statements. Note that year-over-year comparisons are problematic due to methodology changes at Los Angeles as well as a major facility going temporarily offline.

Outpatient visits are defined as visits during which patients see either a physician or a nurse practitioner in a clinic. Visits to other units, such as radiology, laboratory and physical therapy, are not counted as outpatient visits.

The medical centers provide a full range of health care services and are sites for testing the application of new knowledge and the development of new diagnostic and therapeutic techniques.


The cases treated by UC medical centers tend to be more complicated than is typical for medical centers and hospitals in California.

11.3.5 Patient complexity, UC medical centers and California median, 2003–04 to 2014–15

11-3-5

Source: UC Medical Centers’ Audited Financial Statements and the CA Office of Statewide Health Planning and Development

The Case Mix Index (CMI) is a standard hospital metric for addressing the question: “How sick are our patients?” Hospitals with patients who tend to be more seriously ill score higher on the index, which translates into more resources used per patient by the hospital and into higher costs. A patient of average complexity scores 1.0 on the index. The index has been rising at each of the medical centers, reflecting growth in highly complex care, including complex surgical cases and transplants.

The patient mix at the UC medical centers reflects the role of these centers as tertiary referral hospitals that often serve sicker patients and those with the most complex cases. As noted earlier, they treat critically ill newborns, care for cancer patients and treat half of all transplant patients and one-quarter of extensive burn cases in California.