Chapter 3:
Undergraduate Student Success
Goals
The University of California seeks to enable all freshmen and transfer entrants to complete their undergraduate degrees in a timely fashion and to ensure that their education prepares them to be the next generation of leaders for California, the nation and the world.
Improving graduation rates
By traditional graduation rate measures, UC’s undergraduates are highly successful.
UC’s four-year graduation rates for freshmen have risen significantly over the past 15 years — from 46 percent for the 1997 entering cohort to 64 percent for the 2011 cohort. The most recent six-year graduation rate is 85 percent, which increases to 88 percent when including students who transfer to non-UC institutions and still graduate within six years. In addition, time to degree has steadily improved over time with freshman entrants taking on average 4.1 years to graduate.
Transfer entrants have made similar gains, with average two-year graduation rates increasing from 37 percent for the 1997 entering cohort to 55 percent for the 2013 cohort. The most recent four-year graduation rate for transfers (2011 entering cohort) is 88 percent.
Researching factors that affect graduation rates
This year’s report includes graduation rates by race/ethnicity. Many factors are at play here, from socioeconomic background to peer effects to academic preparedness. These factors may explain some of the difference in graduation rates, and these factors may intersect and be cumulative.
For instance, an underrepresented minority student may experience attending a poorly performing high school differently from a nonunderrepresented student, and being both low-income and first-generation will often affect a student more than just having one of those characteristics, even though they are closely correlated.
Holding a job while attending school is often thought to negatively affect graduation rates. However, undergraduates have to work a significant number of hours (i.e., 21 hours or more) for employment to play a role, and a very small proportion of undergraduates work that many hours while attending school.
Undergraduate outcomes
The number of undergraduate degrees awarded by UC over the past 15 years has grown by 50 percent, from about 32,700 in 1999–2000 to 49,200 degrees in 2014–15. Increases in the size of the entering freshman class and improving graduation rates have contributed to these positive developments. Over one-third of the undergraduate degrees awarded by UC in 2014–15 were in STEM disciplines (science, technology, engineering and mathematics).
Four years after graduation, more than a quarter of bachelor’s degree recipients have enrolled in graduate or professional programs.
Analysis of wage data reported for UC alumni working in California shows differences in earnings depending on the student’s major. Generally, the earning capacity of UC alumni increases rapidly; ten years after graduation, alumni have doubled what they were earning at two years post-graduation. Success in the California labor workforce is seen across all socioeconomic groups, including students whose families qualified for federal Pell Grants. Within five years of graduation, Pell Grant recipients earn an average income higher than their parents’ combined incomes during the time those students attended UC (approximately $50,000).
California employment data for UC bachelor’s degree recipients also illustrate the benefits of a UC degree. They show that, by ten years after graduation, approximately 30 percent of life science majors work in health care and social assistance; more than 15 percent of engineering/computer science majors are in the internet and computer systems industry and another 12 percent are in engineering services; and 11 percent of social science majors are employed in K–12 education.
Looking forward
Despite UC’s record of success, there are continued systemwide and campus efforts to improve undergraduate outcomes.
The March 2016 Performance Outcomes report, UC’s annual report to the California Legislature, showed that when comparing Pell and non-Pell recipients, there is a gap in graduation rates at the four-year mark that all but disappears by six years for freshmen. Graduation rates at UC tend to be lower for socioeconomically disadvantaged students (especially African-American and Hispanic/Latino males) and for students from first-generation families.
As part of the 2015 state budget agreement, the Office of the President, working with the campuses, developed a report to provide guidance to campuses on advising practices that support timely graduation of students and help reduce the achievement gap among different socioeconomic cohorts of UC students. This “Advising Strategies to Support Timely Graduation” report highlights programmatic strategies, technology and tools and organizational improvement strategies that support student success and timely graduation. President Napolitano provided the report to campus leadership in January 2016, encouraging them to share it with campus advisors and adopt those strategies that will best meet the needs of their students. The report is also published on the Office of the President website.
For more information
Four-year graduation rates for students who enter as freshmen have improved substantially since 1997. They are better than average graduation rates at AAU public institutions, and some campuses approach the average rates of the AAU private institutions.
3.1.1 Freshman graduation rates for all students, UC and comparison institutions, Cohorts entering fall 1997 to 2011
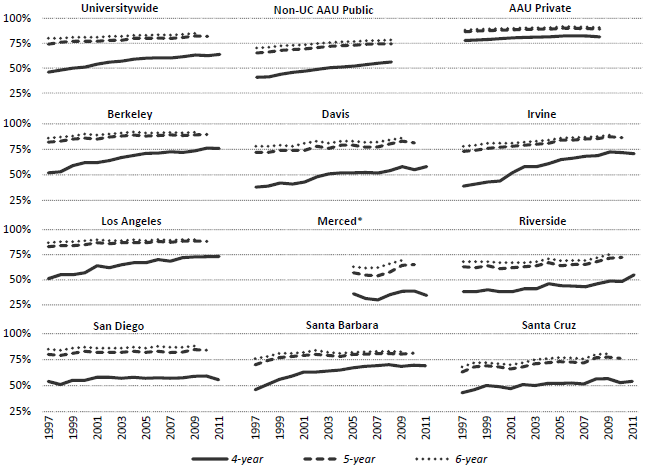
Source: UC Corporate Student System and IPEDS1
UC’s four-year graduation rates for freshmen have risen significantly over the past 15 years — from 46 percent for the 1997 entering cohort to 64 percent for the 2011 cohort. The steady improvement in graduation rates is due to many factors, including campus efforts to encourage four-year completion, improvements in the academic preparation levels of incoming students and the current costs of a UC education, which motivate students to complete their educations more quickly.
The six-year graduation rate of UC freshmen is actually close to 90 percent when students who finished their degree at a non-UC institution are included.
3.1.2 Freshman graduation rates, including those who graduated from a non-UC institution, Universitywide and UC campuses, Cohort entering fall 2009
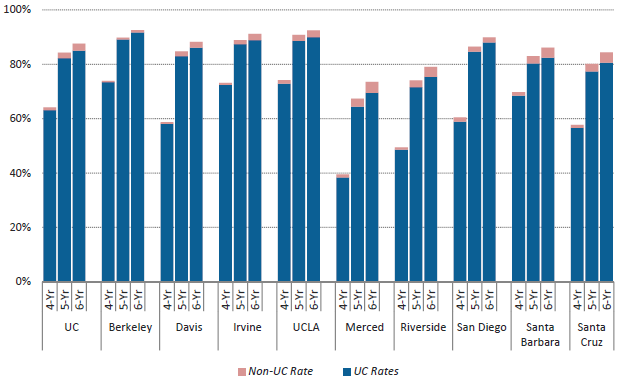
Source: UC Corporate Student System and the National Student Clearinghouse1
The extended graduation rate of students who begin their studies as freshmen at UC includes a small number who transferred to a non-UC institution and completed their bachelor’s degree within four, five or six years.
By this measure, UC’s overall six-year graduation rate is about 88 percent. The effect of the extended graduation rate varies by UC campus, with Berkeley having very few students who transfer out and earn a degree outside of the UC system, while the six-year rates at Merced, Santa Barbara and Santa Cruz improve by as much as 4 percentage points when students who complete their degree at a non-UC school are counted.
Graduation rates for students who entered as transfer students grew steadily for classes entering between 1997 and 2004 but have leveled off since then.
3.1.3 Transfer graduation rates, Cohorts entering fall 1997 to 2013
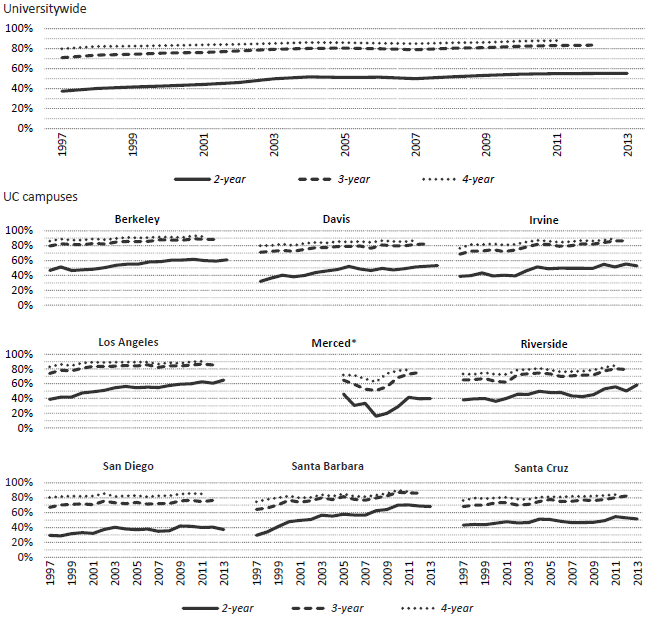
Source: UC Corporate Student System1
The two-year graduation rate for transfers is currently at 55 percent. The four-year rate is 88 percent, compared to 85 percent for the six-year freshman graduation rate.
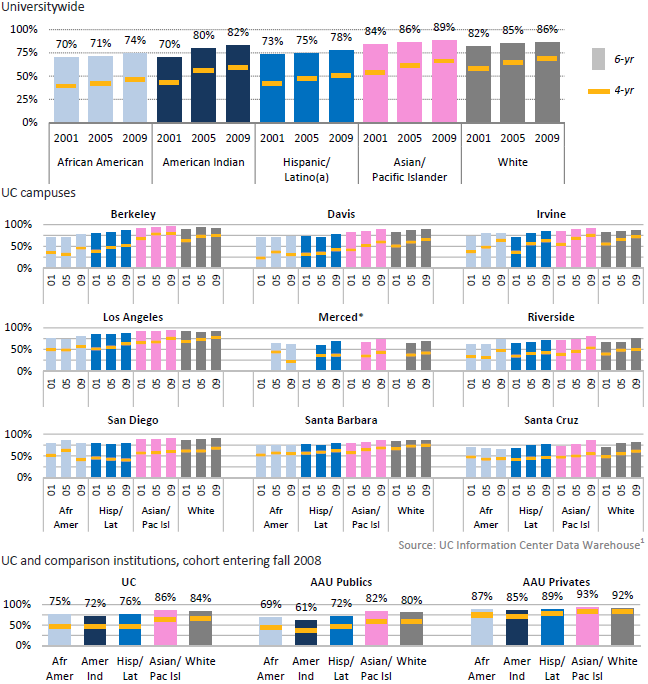
Freshman graduation rates have increased for all racial/ethnic groups, although
graduation gaps remain between underrepresented (African American, American Indian and Hispanic/Latino(a)) and white and Asian undergraduates.
3.1.4 Freshman graduation rates by race/ethnicity, Cohorts entering fall 2001, 2005 and 2009
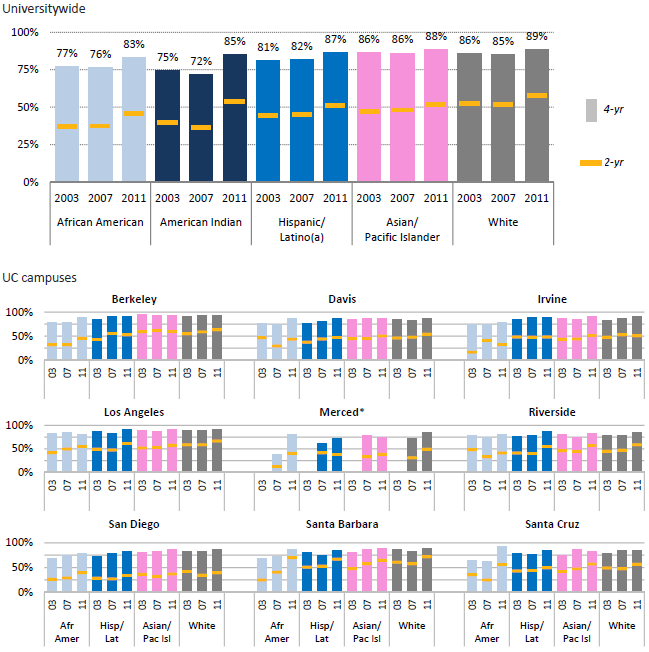
Transfer graduation rates by race/ethnicity have increased, with similar variation among groups as seen in freshmen.
3.1.5 Transfer graduation rates by race/ethnicity, Cohorts entering fall 2003, 2007 and 2011
Four‐year graduation rates among freshman Pell Grant recipients have increased by 13 percentage points since the entering cohort of fall 2000.
3.1.6 Freshman graduation rates by Pell Grant receipt status, Cohorts entering fall 2000 to 2011
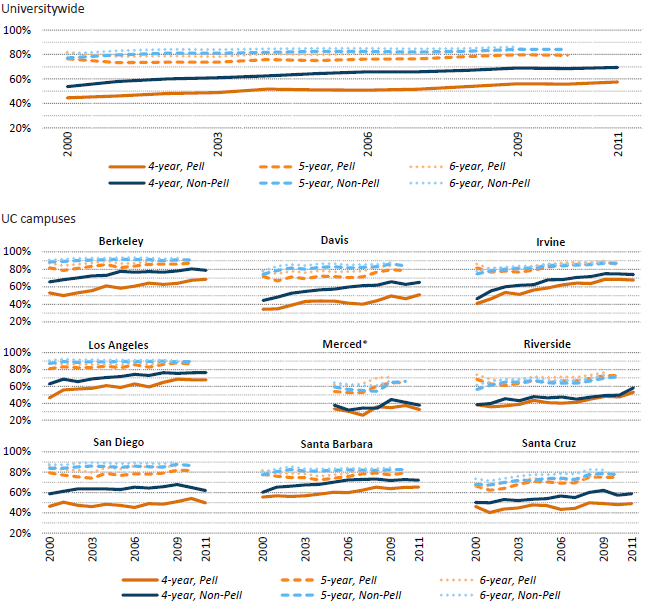
Pell Grant recipients graduate at comparable rates to non‐Pell recipients. Although there is an 11‐percentage‐point gap at the four‐year mark between Pell recipients and non‐Pell recipients, this gap is reduced to 3 percentage points at the six‐year mark.
Graduation rates among transfer students who received Pell Grants are comparable to other students, especially at the three‐ and four‐year marks.
3.1.7 Transfer graduation rates by Pell Grant receipt status, Cohorts entering fall 2002 to 2013
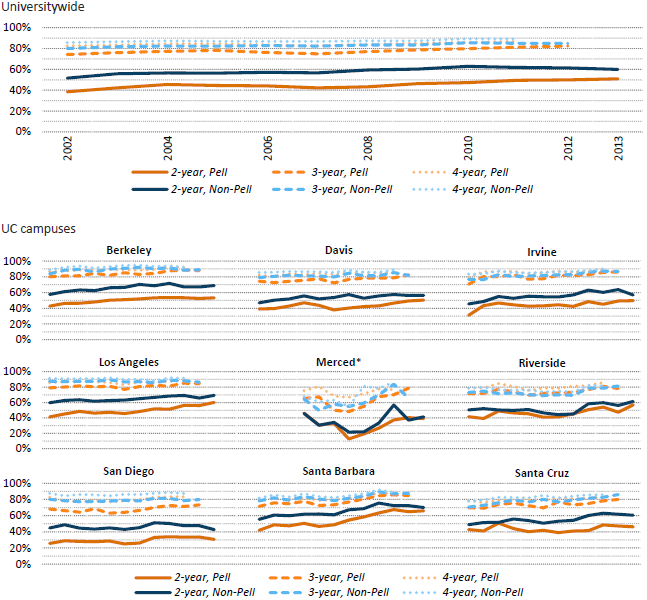
Since the entering cohort of 2002, the two‐year graduation rate of transfer students who received Pell Grants has improved more dramatically than the rates of other students (12 percentage points for Pell students, compared to 8 percentage points among non‐Pell Grant recipients).
Similarly to freshmen, the initial gap in graduation rates between Pell and non‐Pell students (9 percentage points at the two‐year mark) shrinks substantially two years later (2 percentage points at the four‐year mark).
As graduation rates rise, undergraduate students at UC are also graduating more quickly.
3.1.8 Average time to degree, Cohorts entering fall 1994 to 2008
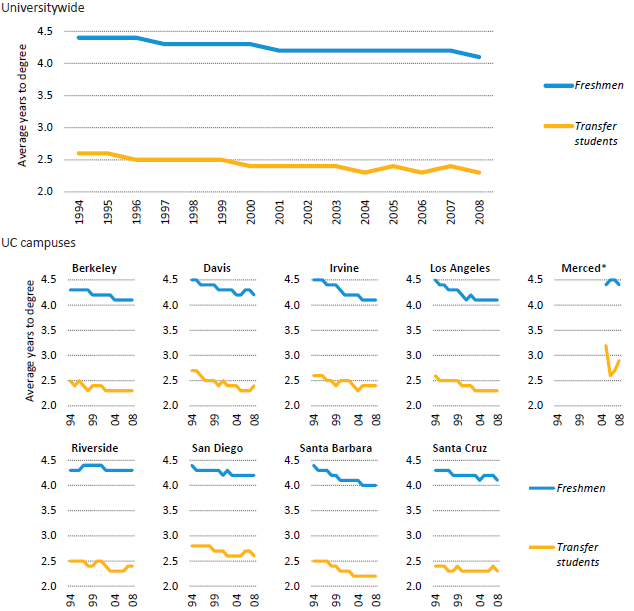
The average time taken to earn a bachelor’s degree at UC has decreased fairly steadily since 1994. Students entering as freshmen take an average of 4.1 years, which is about 7 percent less than in 1994. For students entering as transfers, the average time to degree is 2.3 years, about 12 percent less than in 1994.
Freshman retention rates are high, but there is room for some improvement.
3.2.1 Freshman first-year retention rates, Cohorts entering fall 2006 to 2014, UC and comparison institutions (NOTE SCALE)
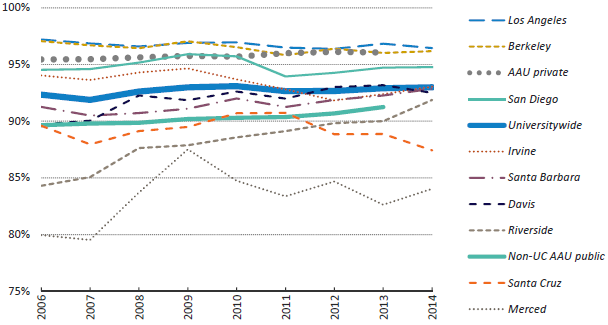
Source: UC Corporate Student System for UC data; IPEDS for comparison data1
Improving first-year retention is key to raising graduation rates.
Studies of retention data divide students into two groups: those who leave UC in good academic standing (i.e., GPA ≥ 2.0) or transfer to another UC campus, and those who leave UC in poor academic standing (i.e., < 2.0).
The strategies needed to address retention vary based on this distinction. For students leaving UC in good academic standing, some campuses are considering expanding honors programs or providing opportunities for undergraduate research as early as the freshman year.
For those leaving in poor academic standing, some UC campuses are using summer bridge or early orientation programs so that students have a productive jump-start on a smooth transition to campus life. Other campuses are looking into housing and residential programs and cohort programs to integrate undergraduates into college.
Transfer retention rates are fairly stable.
3.2.2 Transfer retention rates, Cohorts entering fall 2006 to 2014, UC campuses (NOTE SCALE)
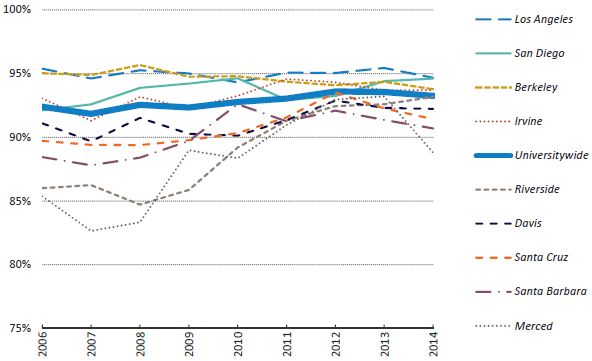
Source: UC Corporate Student System1
For transfer students, the retention rate has been fairly steady at most campuses for the last two years. Campuses vary in terms of whether transfer students are more likely to leave in poor or good academic standing, and very few leave for another UC campus.
Like entering freshmen, transfer students benefit from a smooth transition to campus in their first year. Several UC campuses have summer programs to support transfer students.
On average, both lower‐division and upper‐division undergraduate students take more units per term now than they did 15 years ago. There is variation in this trend among campuses, but the overall pattern may be a contributing factor in the shorter time to degree observed among undergraduates.
3.2.3 Average number of attempted units per student per term, Academic years 1999–2000 to 2014–15 [NOTE SCALES]
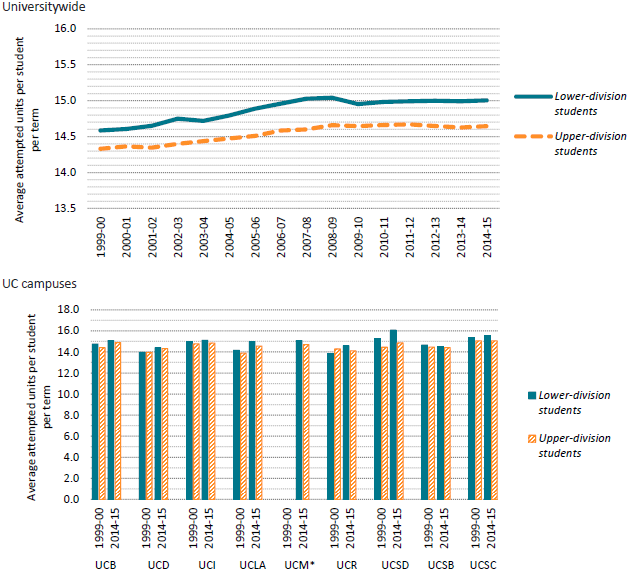
Source: UC Corporate Student System1
Not only are students attempting more units, they are successfully completing more units each year. The average percent of attempted units per year that both lower‐ and upper‐division students complete has increased from 91 to 93 percent over the last 15 years.
Social science, life sciences, and arts and humanities are the largest segments of bachelor’s degree recipients.
3.3.1 Undergraduate degrees awarded by discipline, UC and comparison institutions, 2000–01 and 2013–14
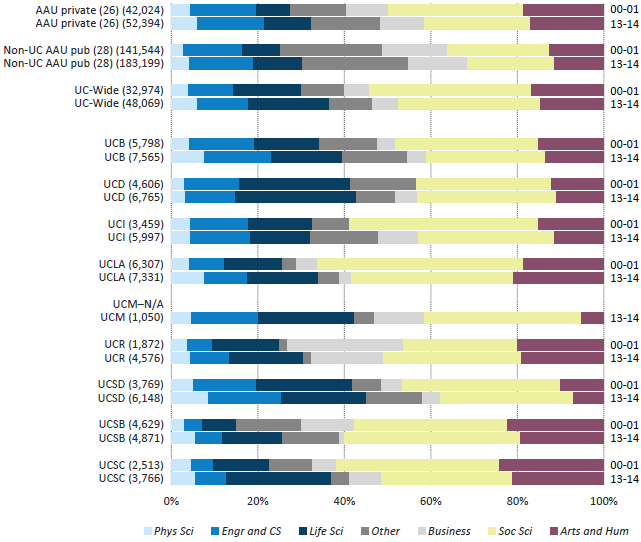
Source: IPEDS
About 37 percent of all undergraduate degrees awarded by UC in 2013–14 were in science, technology, engineering and mathematics (STEM) fields. This is higher than the proportion at AAU public and private comparison institutions (30 and 32 percent, respectively). Indicator 10.3.1 shows UC’s share of the degrees awarded in the state of California.
Students report increasing levels of engagement in class and with faculty members. The predominant area of engagement is class discussion, with about 98 percent of students reporting some level of participation. Almost 50 percent of students have worked with a faculty member on an activity other than coursework.
3.3.2 Student responses to questions about areas of engagement, Universitywide, Spring 2012 and spring 2014
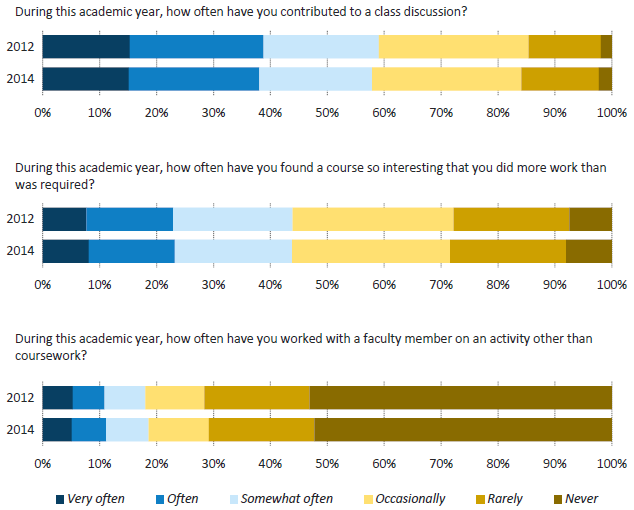
Source: UCUES
Levels of student engagement have been relatively stable over the last two surveys, which were administered in 2012 and 2014. About 84 percent of students report that they contribute to class discussions at least occasionally, and about 71 percent have either occasionally or often gone beyond required coursework in a class they found interesting. Twenty‐nine percent have worked with faculty on a research or creative project beyond coursework, at least occasionally.
Survey data suggest that graduating seniors’ satisfaction with their overall academic experience has remained high over the last three UCUES survey administrations.
3.3.3 Student satisfaction with overall academic experience, Bachelor's degree recipients who entered as freshmen, Universitywide and UC campuses, Spring 2010 to 2014
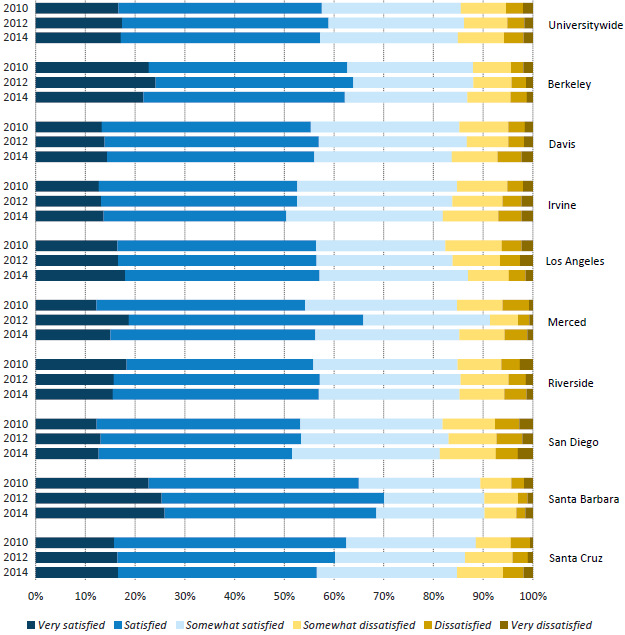
Source: UCUES
For the UC system overall and for most campuses, the percent of seniors who are satisfied (somewhat through very satisfied) has remained relatively stable.
Across disciplines, undergraduate degree recipients tend to double their earnings between two and ten years after graduation.
3.3.4 Inflation-adjusted average alumni wages by selected majors, two, five and ten years after graduation, UC Universitywide, 2000 to 2012 exit cohorts
|
|
After two years
|
After five years
|
After ten years
|
| Arts & Humanities |
Philosophy |
$34,456
|
$52,212
|
$78,559
|
|
History |
$34,974
|
$52,037
|
$72,454
|
|
Foreign Language |
$33,661
|
$48,088
|
$67,564
|
|
English/Literature |
$33,954
|
$49,152
|
$65,951
|
| |
|
|
|
|
| Professional/ Interdisciplinary |
Cognitive Science |
$50,282
|
$74,496
|
$109,257
|
|
Business |
$52,776
|
$70,986
|
$103,068
|
|
Legal Studies |
$45,026
|
$65,327
|
$97,958
|
|
Ag. Business |
$50,976
|
$69,511
|
$97,096
|
|
Communications |
$40,122
|
$58,283
|
$81,077
|
|
International Studies |
$37,352
|
$53,589
|
$74,536
|
|
Architecture |
$44,164
|
$57,634
|
$71,845
|
|
Social Work |
$32,908
|
$47,694
|
$68,247
|
|
|
|
|
|
| Life Sci, Phys Sci, Eng, CS |
Computer Science |
$71,433
|
$92,507
|
$128,965
|
|
Engineering |
$66,093
|
$86,317
|
$118,894
|
|
Physics |
$49,247
|
$67,270
|
$102,494
|
|
Chemistry |
$42,404
|
$57,968
|
$98,260
|
|
Biology |
$36,937
|
$59,544
|
$97,346
|
|
Mathematics |
$50,053
|
$65,328
|
$88,223
|
|
|
|
|
|
| Social Sciences |
Economics |
$50,071
|
$69,274
|
$101,132
|
|
Political Science |
$39,598
|
$62,423
|
$94,529
|
|
Geography |
$39,306
|
$58,042
|
$85,164
|
|
Psychology |
$34,467
|
$51,696
|
$72,639
|
|
Sociology |
$36,898
|
$52,816
|
$70,630
|
|
Anthropology |
$32,854
|
$46,730
|
$66,702
|
|
|
|
|
|
| All Majors |
|
$42,700
|
$61,100
|
$88,000
|
Source: California Employment Development Department and UC Corporate Student System. Amounts are inflation-adjusted to 2014 dollars.
Alumni wage data provide compelling evidence of UC’s role as an engine of social mobility in the state. From 2000 to 2014, UC graduated more than 230,000 Pell Grant recipients, whose family incomes are generally below $50,000. More than 50 percent of Pell Grant recipients who graduate from UC and work in California go on to earn more than their pre-UC total family incomes within five years.
Bachelor's degree recipients work across diverse California industries, particularly health care, education, engineering and manufacturing.
3.3.5 Industry of employment of UC bachelor’s graduates by years after graduation, Universitywide, 2000 to 2012 graduating cohorts
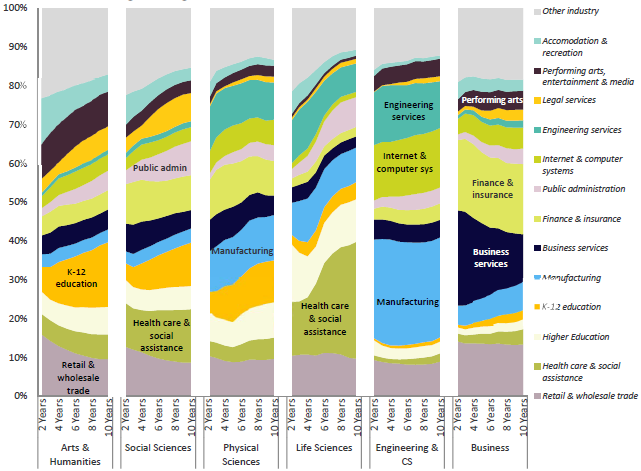
Source: California Employment Development Department and UC Corporate Student System.
Bachelor’s degree graduates often begin in positions within the retail and wholesale trade sectors but move on to high-skill industries such as education, health care, engineering and manufacturing.
A significant number of UC graduates go on to become educators within California’s K–12 and higher education systems. About 4 percent of UC graduates work in the state’s K–12 education system directly after graduation; about 9 percent do so within ten years of receiving their UC degree.
UC graduates also populate the state’s health care and social assistance workforce in large numbers. At ten years after graduation, about 12 percent work in health care or social assistance (30 percent among life sciences majors).
Large numbers of graduates of UC’s undergraduate STEM programs enter the state’s engineering and high-tech workforce. More than 15 percent of UC engineering/computer science graduates employed in California work in the Internet and computer systems industry, while another 12 percent work in the engineering services industry. The manufacturing sector has been a consistent source of employment for large numbers of UC engineering and physical science graduates.