Chapter 1:
Undergraduate Admissions and Enrollment
goals
One of the University of California’s highest priorities is to ensure that a UC education remains accessible to all Californians who meet its admissions standards. This goal is articulated in California’s “Master Plan for Higher Education,” which calls for UC to admit all qualified freshmen in the top 12.5 percent of California public high school graduates. It also calls for UC to admit all qualified California Community College (CCC) transfer students.
In 2014, there were around 149,000 freshmen applicants and 35,000 transfer applicants in total. Campus admissions decisions are based on holistic review of the qualifications of applicants and target the incoming class size based on the capacity of classrooms, laboratories, housing and available state funding.
President Napolitano’s vision for UC is to “Teach for California, and research for the world.” The president is partnering with California State University (CSU) and California Community College leaders to strengthen higher education in California. In addition, one of President Napolitano’s first initiatives was to create a Transfer Action Team to examine ways to increase demand, provide access and better serve transfer students. The University’s goal is to admit entering cohorts that are close to a 2:1 ratio of freshmen to transfer students.
Admissions trends — freshmen
Freshman applications have risen dramatically over the past two decades, growing over five percent per year and tripling since 1994. With increases in high school graduation rates, particularly among Chicano/Latino students, the University expects continued growth in demand for college access.
UC relies on a comprehensive review process to make admissions decisions, considering not only successful completion of a rigorous curriculum of college preparatory courses, high school GPA and standardized test scores but also special talents, special projects and accomplishments in light of life experiences and special circumstances.
Due to increasing demand and limited capacity, campuses are admitting a lower percentage of applicants. Despite that trend, UC continues to reach its “Master Plan” goals by guaranteeing admission to applicants who are either in the top 9 percent of high school graduates statewide or the top 9 percent of graduates from their own high school. Qualified freshman applicants are offered an opportunity to be admitted to another UC campus if they do not receive an offer of admission from the UC campuses where they applied. While all campuses offer admission to out-of-state and international students, these students who are admitted must compare favorably to the California residents admitted to that campus.
Admissions trends — transfers
Transfer applications have almost doubled over the last 20 years, reaching a high of 36,200 in 2011. Applicants dropped to 34,800 in 2012 and slightly rebounded to around 35,000 in 2013 and 2014.
Both the Transfer Action Team and the California Community Colleges have identified the cumulative effects of state budget cuts to the CCCs as the likely cause of this decline in applications. With improving state revenues and Proposition 98, state support for the CCCs has increased significantly. Preliminary data from 2015 show an increase in CCC transfer applications, lending credence to the idea that the restoration in funding for the CCCs, coupled with the Academic Senate’s efforts to improve transfer pathways, will likely result in increased demand for transfer applicants.
Almost all transfer students enter UC as juniors. Campus enrollment targets are based on capacity in major programs at the upper-division level.
Enrollments
The University enrolls freshmen and transfer students from every county of California, but students tend to apply to campuses closer to their residence. One goal of the president’s transfer initiative is to increase the geographic diversity of transfer entrants.
The “Master Plan” specifies that the University maintain a 60:40 ratio of upper-division to lower-division students, which corresponds to a 2:1 ratio of new freshmen to new CCC transfers. Over the past several years, UC has moved closer to that ratio, from 2.42:1 in 2007–08 to 2.31:1 in 2014–15. The report from the Transfer Action Team recommits the University to achieving that goal by 2017–18.
Compared to a decade ago, freshman and transfer entrants today are better prepared academically as measured by grades, and — for freshmen — test scores and the number of rigorous high school courses completed. As academic qualifications of the entering class continue to improve, UC still maintains access for populations historically underserved by higher education. Over 40 percent come from low-income families and are the first in their families to complete a four-year degree.
The number of nonresident domestic and international students has increased in recent years, though their proportion is still much lower than at comparable research universities. Nonresident students enrich and diversify the student body; they also pay supplemental tuition ($22,878 in 2013–14) not charged to California residents. This extra revenue enables UC to improve educational programs for all students.
For more information
Demand for UC continues to grow.
1.1.1 Freshman applicants, admits and enrollees, Universitywide, Fall 1994 to 2014
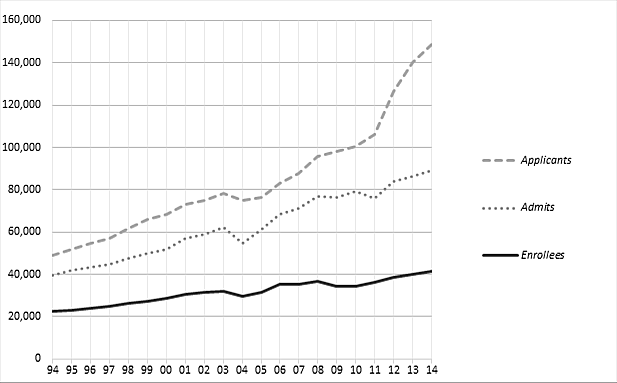
Source: UC Corporate Student System1
The rapid growth in freshman applications to UC over the past two decades demonstrates the increased demand for college education, the growth of California’s population and UC’s continued popularity with California graduates. UC continues to maintain its obligations under the “Master Plan” by guaranteeing admission to all qualified students.
Some qualified applicants are not offered admission at the campus they applied to but instead are admitted to another campus by a referral process. A change in accounting for referral students is responsible for the apparent drop in 2011 admits. Beginning that year, UC Merced began admitting only students who indicated interest in a referral offer, rather than every student who qualified for such an offer. This procedural change is reflected in graphs 1.1.1 and 1.1.2 for Merced.
From 2010 to 2014, unduplicated freshman applications grew 48 percent, compared to a 27 percent increase in the six-year period between 2003 and 2009. The 48 percent growth consists of increases of 18 percent among California residents, 14 percent among domestic nonresidents and 16 percent among international applicants.
Most UC campuses have experienced tremendous growth in applications and admissions. Trends in campus enrollments have been more stable over time.
1.1.2 Freshman applicants, admits and enrollees, UC campuses, Fall 1994 to 2014
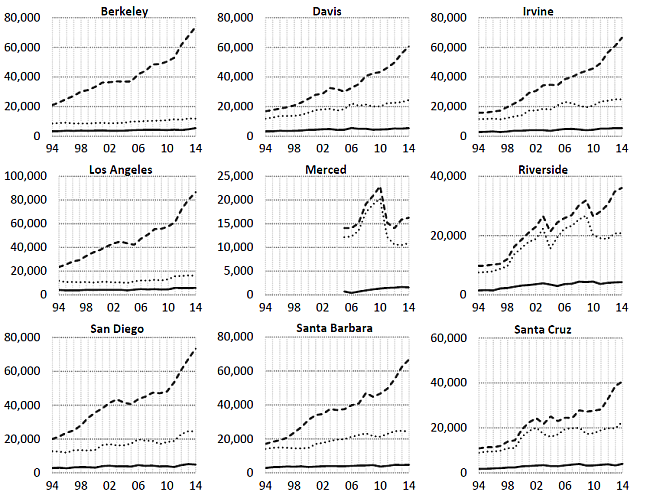
Source: UC Corporate Student System1
Most UC campuses have seen considerable growth in the number of freshman applications they receive, as demonstrated by the steep dashed lines in the graphs above. One factor contributing to this growth is the increase in the number of UC campuses chosen by each applicant; this grew from about 2.8 campuses per applicant in 1994 to over 3.5 campuses per applicant in 2014.
1 Applicants here include the “referral pool,” which comprises eligible applicants who are not offered admission at a campus to which they applied, but who are admitted to another campus with sufficient capacity. Some campuses admit fall applicants for a subsequent term (winter or spring). These “rollover” admits and enrollees are excluded from these graphs, which only show fall data. A change in accounting for referral students is responsible for the apparent drop in 2011 admits. Beginning that year, UC Merced began admitting only students who indicated interest in a referral offer, rather than every student who qualified for such an offer. This procedural change is reflected in the 1.1.2 and 1.1.4 graphs for Merced.
Since 2012, transfer admissions and enrollments have steadily increased, with applications fluctuating.
1.1.3 Transfer applicants, admits and enrollees, Universitywide, Fall 1994 to 2014
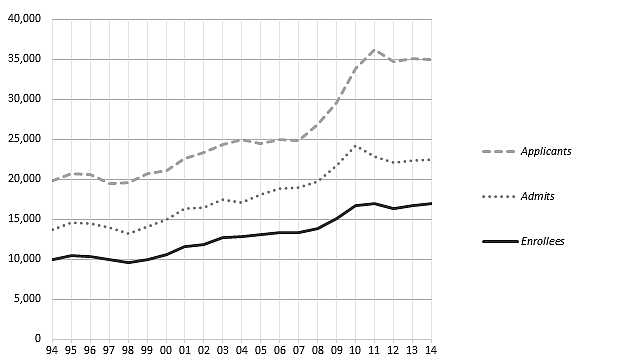
Source: UC Corporate Student System1
After a period of sizable growth from 2007 to 2011, which followed a decade of more modest growth, UC experienced a significant drop in transfer applications from California residents in 2012, with a slight increase in 2013, followed by very slight drop in 2014. A less dramatic trend is seen among admits and enrollees, with both increasing since 2012.
The decline in applicants likely is due to fiscal constraints in the California Community Colleges (CCCs), which forced them to decrease enrollment by about 500,000 students over the past few years, curtail courses that students needed for transfer, and cut counseling services.
Recent funding increases to the CCCs and UC’s transfer initiative are to likely expand the number of students that transfer to UC. Preliminary data from 2015 indicate that CCC transfer applications may indeed be rebounding.
Since 1994, transfer applications, admissions and enrollees have increased at every campus.
1.1.4 Transfer applicants, admits and enrollees, UC Campuses, Fall 1994 to 2014
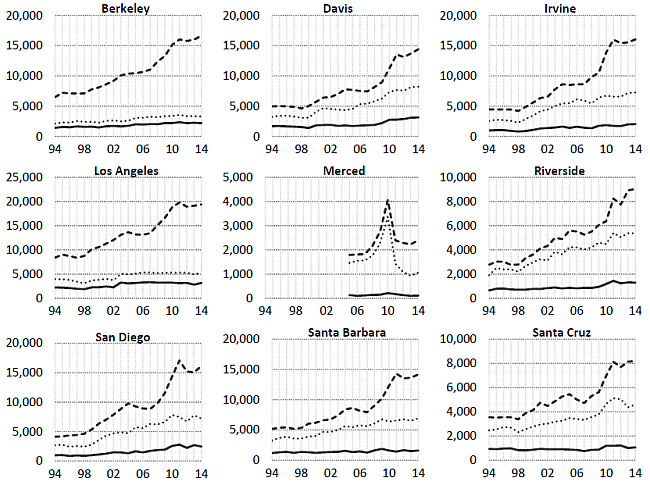
Source: UC Corporate Student System
Consistent with UC’s commitment to transfer students, the fall enrollment of new California Community College (CCC) California resident transfers has increased 63 percent since 1994 (from 8,400 to over 13,700).
In June 2012, the UC Academic Senate approved a restructuring plan that will help clarify the transfer process for CCC students interested in UC and also improve their preparation for UC-level work. These changes lay the foundation for the Transfer Action Team’s recommendations, which the University is now implementing.
UC continues to work toward achieving its goal of a 2:1 ratio of California resident freshmen to transfer students.
1.1.5 New freshmen and transfer students, Universitywide, 2007–08 to 2014–15
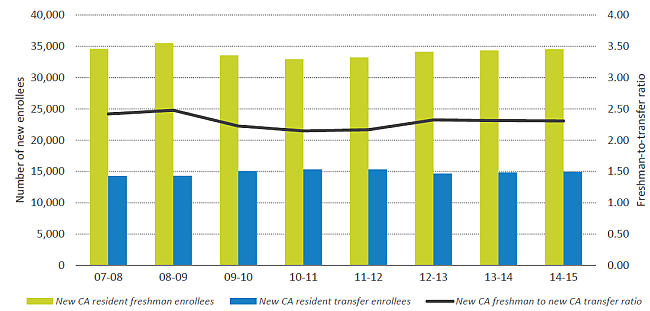
Source: UC Corporate Student System1
Campus detail for 2014-15
|
% New CA resident freshmen
|
% New CA resident transfers
|
Ratio of new CA freshmen to new CA transfers
|
| Berkeley |
67%
|
33%
|
2.08
|
| Davis |
62%
|
38%
|
1.64
|
| Irvine |
71%
|
29%
|
2.47
|
| Los Angeles |
62%
|
38%
|
1.60
|
| Merced |
93%
|
7%
|
13.29
|
| Riverside |
78%
|
22%
|
3.47
|
| San Diego |
65%
|
35%
|
1.88
|
| Santa Barbara |
75%
|
25%
|
3.02
|
| Santa Cruz |
77%
|
23%
|
3.30
|
| Universitywide, all campuses |
70%
|
30%
|
2.31
|
| Universitywide, excl. Merced |
69%
|
31%
|
2.26
|
The “Master Plan” calls for UC to accommodate all qualified California Community College (CCC) transfer students. It specifies that the University maintain at least a 60:40 ratio of upper-division (junior- and senior-level) to lower-division (freshman- and sophomore-level) students to ensure space for CCC transfers. Students transferring into the upper division from CCCs are crucial to maintaining this balance. To do so, UC aims to enroll one new CA resident CCC transfer student for each two new CA resident freshmen, or 67 percent new resident freshmen to 33 percent new resident CCC transfer students.
To ensure a smooth transition to UC for transfer students, the Academic Senate is actively developing clear transfer pathways across ten of the top majors by fall 2015, and will do so for another 11 majors by fall 2016.
1 Enrollment numbers include applicants to fall, winter and spring terms.
UC enrolls a higher proportion of first-generation students than other very selective public and private universities.
1.2.1 First-generation undergraduate students, Universitywide and very selective public and private research universities, 1999–2000, 2003–04, 2007–08, and 2011–12
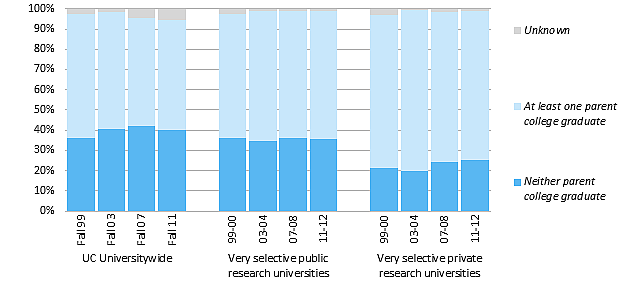
Source: NPSAS and UC Corporate Student System1
A first-generation student is one whose parents do not hold four-year college degrees. Having one or both parents with a college degree can provide a student with additional tools for success in college, such as having role models, understanding college and family expectations, and having financial means that ease transition from high school to college.
In 2011, around 40 percent of UC undergraduates came from first-generation families, compared to 36 percent for very selective public research universities and 25 percent for very selective private research universities.
1 Selectivity as defined in IPEDS is based on two variables: 1) the centile distribution of the percentage of students who were admitted (of those who applied); and 2) the centile distribution of the midpoint between the 25th and 75th percentile SAT/ACT combined scores reported by each institution (ACT scores were converted into SAT equivalents). The institutions included here are in the most selective group.
UC's entering first-generation students are more likely to be from an underrepresented minority group, to have a first language other than English and/or to have a lower income than students with at least one parent who graduated from college.
1.2.2 Entering students by first-generation status, race/ethnicity, first language spoken at home, Pell Grant receipt and entering level, Universitywide, Fall 2014
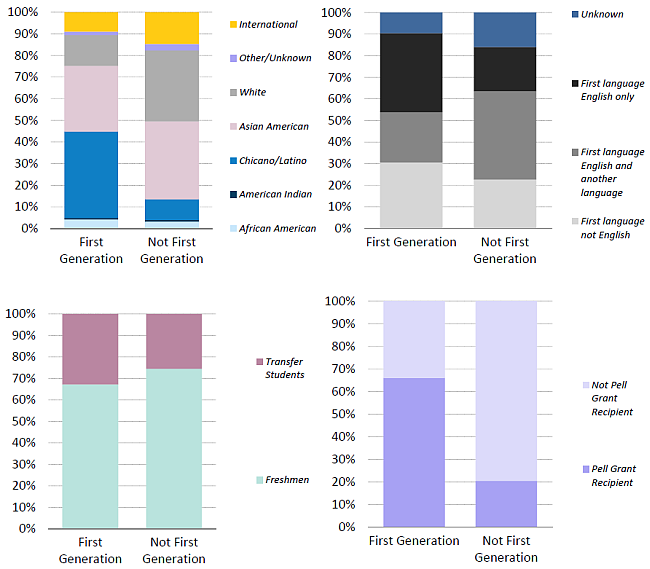
Source: UC Corporate Student System1
There are significant differences in the racial/ethnic/income profiles for students entering UC via the freshman or transfer paths.
1.2.3 Entering domestic undergraduates by race/ethnicity, Pell Grant status and class level, Universitywide, Fall 2014
|
|
Freshmen
|
Transfers
|
All
|
|
| Pell Grant recipients |
URM |
18.4%
|
16.6%
|
17.9%
|
|
|
Asian |
14.1%
|
15.7%
|
14.8%
|
|
|
White |
4.8%
|
14.2%
|
7.5%
|
|
| Pell Grant recipients total (includes unk) |
|
37.9%
|
47.6%
|
40.7%
|
n=23,837
|
|
|
|
|
|
|
| Non-Pell Grant |
URM |
9.6%
|
9.2%
|
9.5%
|
|
|
Asian |
21.8%
|
11.4%
|
18.8%
|
|
|
White |
17.2%
|
16.4%
|
17.0%
|
|
| Non-Pell Grant total (includes unk) |
|
50.4%
|
38.4%
|
46.9%
|
n=27,462
|
|
|
|
|
|
|
| International |
|
11.8%
|
14.0%
|
12.4%
|
n=7,287
|
|
|
|
|
|
|
| All |
|
100.0%
|
100.0%
|
100.0%
|
|
|
|
n=41,569
|
n=17,017
|
|
n=58,586
|
Source: UC Corporate Student System
Underrepresented students constitute a larger proportion of the incoming freshman class than of the entering transfer class, both for Pell Grant recipients and non-Pell Grant recipients. Among Asian students, a higher share of Pell Grant recipients are found in the transfer class compared to the freshman class, while Asian students from non-Pell families are almost twice as prevalent in the freshman class as the transfer class.
The transfer route is being utilized by students of all racial/ethnic and income groups.
Freshmen entering UC are increasingly well-prepared.
1.3.1 A–G (college preparatory)1 courses; weighted, capped high school grade point average (GPA)2; and standardized test scores3 of entering freshmen, as share of class, Universitywide, Fall 2000 to fall 2014
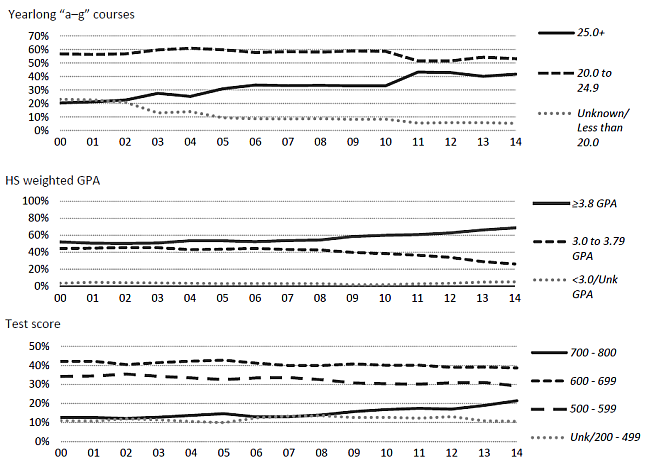
Source: UC Corporate Student System
The academic qualifications of UC applicants and admitted students continues to improve, as reflected by an increase in the number of college-preparatory course completed, higher achievement on standardized entrance exams (SAT/ACT) and rising high school GPAs. UC uses both weighted and unweighted GPAs to evaluate freshman applicants. A weighted GPA provides extra credit for succeeding in difficult courses, such as those in the College Board’s Advanced Placement programs. An A in such a course receives 5 points, a B 4 points and so forth. In other college preparatory courses, an A counts for 4 points, a B for 3 and so forth. For UC eligibility purposes, the weighted, capped GPA is used (shown above) and includes this extra credit for a maximum of eight semester-long courses.
1 A–G courses refer to those high school courses that UC has reviewed and approved as college preparatory.
3 Test scores are the highest of either SAT or ACT scores. ACT scores are converted to the 800 SAT scale. From 2000 to 2005, SAT scores are the average of SAT I Math and Verbal scores. From 2006 onward, SAT scores are the average of SAT Critical Reading and Math scores.
Freshmen entering UC are increasingly well-prepared.
1.3.2 A–G (college preparatory)1 courses of entering freshmen by campus, as share of class, Fall 2000 to fall 2014
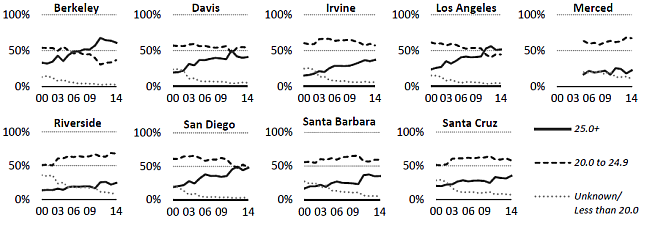
Source: UC Corporate Student System
1.3.3 High school weighted, capped GPA, incoming freshmen, Fall 2000 to fall 2014
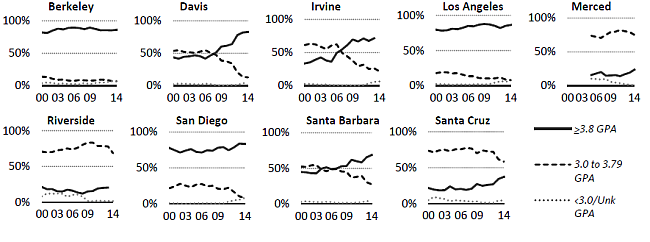
Source: UC Corporate Student System
1.3.4 SAT Reading and Math scores, 25th to 75th percentile, UC campuses and comparison institutions, Fall 2013
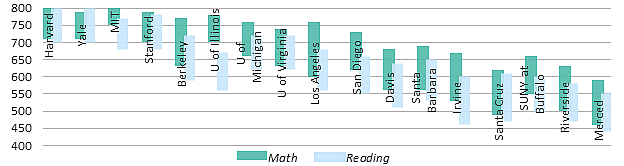
Source: IPEDS
1 A–G courses refer to those high school courses that UC has reviewed and approved as college preparatory.
Like freshmen, UC transfer students in fall 2014 were better prepared academically than their counterparts in earlier years, as measured by their grades.
1.3.5 College grade point average (GPA)1 of entering transfer students, as share of class, Fall 2000 to 2014
Universitywide
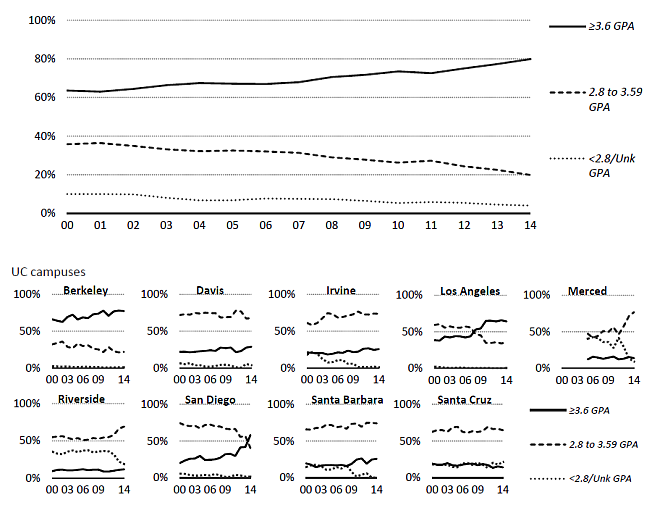
Source: UC Corporate Student System
1 The transfer GPA is based on grades for college-level academic courses from the college(s) where students were previously enrolled. *Merced opened in 2005.
UC has a substantially lower proportion of out-of-state undergraduates than other AAU universities. In fall 2013, only 17 percent of new UC freshmen were out-of-state or international, compared with 31 percent and 76 percent for AAU publics and AAU privates, respectively.
1.4.1 Geographic origin of entering freshmen, Universitywide and comparison institutions, Fall 2000 and 2013
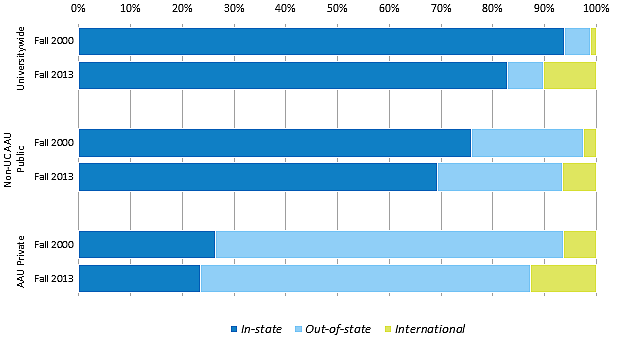
Source: IPEDS. Residency based on IPEDS definition.
Nonresidents provide geographic diversity to the student body. They also pay the full cost of their education. In 2014–15, tuition and fees at UC campuses for a nonresident undergraduate, including health insurance, ranged from $36,900 to $39,000, compared to $14,000 to $16,200 for California resident students.
Nonresident applicants must meet higher criteria to be considered for admission. The minimum high school GPA for nonresident freshmen is 3.4, compared to 3.0 for California freshmen. The minimum college GPA for nonresident transfer students is 2.8, compared to 2.4 for California residents.
UC's priority is to enroll California residents. Campuses enroll nonresident students based on available physical and instructional capacity, and the campus’s ability to attract qualified nonresident students.
UC campuses attract students from their local regions and the major urban areas of California, with an overall local attendance rate of 32 percent.
1.4.2 Percentage of new CA resident freshman enrollees whose home is within a 50-mile radius of their campus, UC campuses, Fall 2014
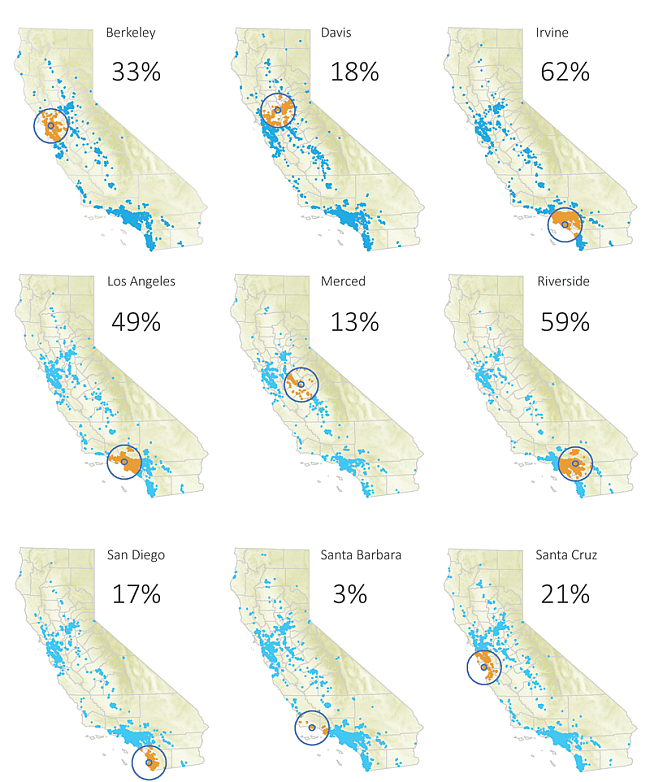
Source: UC Corporate Student System
While freshmen have a high local attendance rate, transfer enrollee rates are even higher, with 45 percent enrolling at a UC campus within 50 miles of their home.
1.4.3 Percentage of new CA resident transfer enrollees whose home is within a 50-mile radius of their campus, UC campuses, Fall 2014
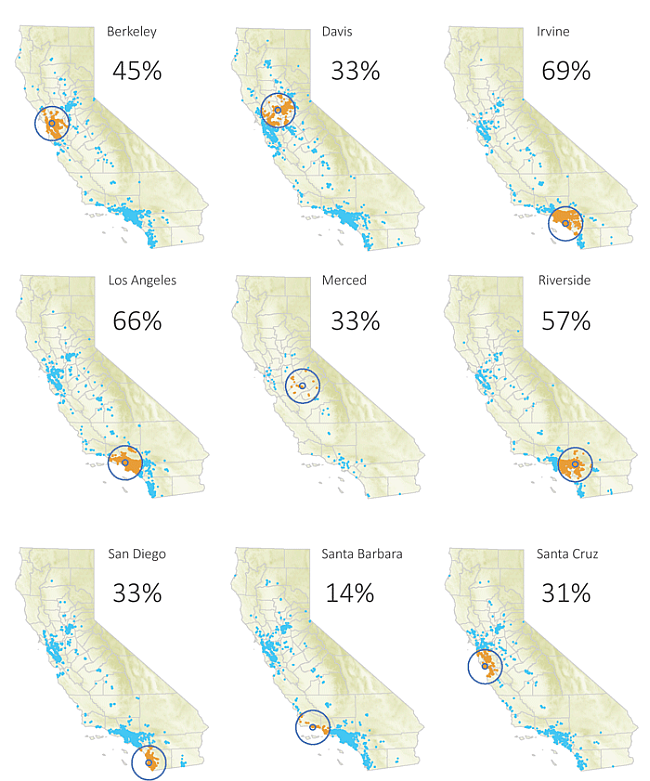
Source: UC Corporate Student System
As a system, UC enrolls far fewer nonresidents than other public research universities.
1.4.4 State funding versus percentage of nonresidents, UC campuses and AAU public institutions, 2011–12
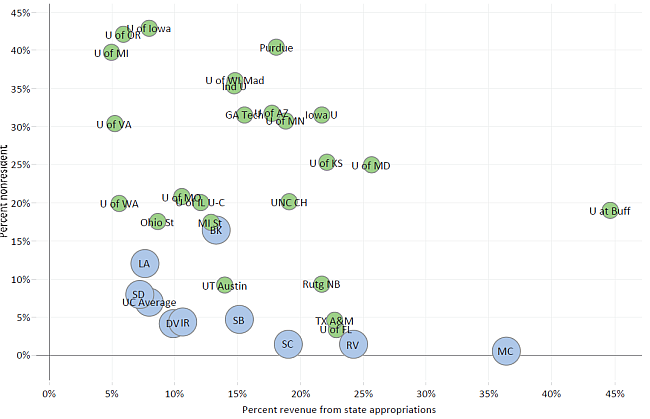
Source: IPEDS
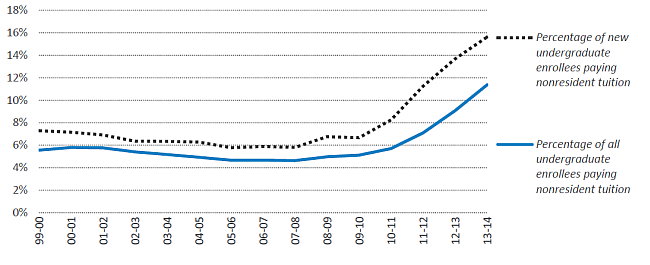
The proportion of undergraduate students paying nonresident tuition is rising.
1.4.5 Percentage of full-time-equivalent undergraduate enrollees paying nonresident tuition, Universitywide, 1999–2000 to 2013–14
Source: IPEDS