Chapter 5:
Faculty and Other Academic Employees
The quality and stature of the University of California are due to its distinguished faculty. President Napolitano has said, “We teach for California … [and] we research for the world.” UC faculty serve as a rich source of innovation, discovery and mentorship; they provide top-quality education to students, groundbreaking research and public service to society. No other public institution can claim as distinguished a group of individuals: UC faculty have won 62 Nobel prizes and 67 National Medals of Science. As of 2015, UC academics included over 580 members of the National Academy of Sciences and over 500 members of the American Academy of Arts and Sciences.
Describing the academic workforce
Faculty are dedicated to a range of teaching, research and creative work, to clinical service and to public service functions in a vast array of disciplinary areas, including the health sciences. The descriptive data in this chapter provide an outline of the composition of the UC faculty that only hints at the full scope of faculty specialties and expertise.
The faculty renewal pipeline
Over the last few years, new hires have increased as UC recovers from the severe budget cuts of prior years. Faculty diversity has increased and departure rates have declined.
Competitiveness of faculty salaries — Faculty salaries at UC still trail those at comparison institutions by 11 to 15 percent depending on rank. UC compares its faculty salaries to the average of salaries at four public and four private institutions. UC and the state set a goal for UC salaries to be at the midpoint between these two averages, but UC salaries have lagged behind this benchmark for the last 14 years. According to the 2014 update of UC’s Total Remuneration Study for General Campus Ladder-Rank Faculty, UC’s 6 percent above-market positioning for retirement is offset by 7 percent below-market positioning for health and welfare benefits. When combined with UC’s 12 percent below-market cash compensation, this leads to total remuneration ten percent below market in comparison to UC’s peers.
Diversity — The University of California remains committed to diversifying its faculty, taking full advantage of the availability of qualified candidate pools. The Office of the President is working with campuses by tracking faculty recruitment data to identify opportunities to diversify the faculty; by sharing best practices in faculty mentoring and professional development; and by enhancing programs to foster work-life balance. The proportion of women and underrepresented race/ethnic groups (URMs) in the faculty continues to grow at a modest pace. When these diversity figures are displayed in the context of eight peer research institutions that make up UC’s standard comparator group, UC compares favorably. According to 2013 data, UC is tied for second place, at 31 percent, for the percentage of female faculty. UC also places second for the percentage of URM faculty and female URM faculty. But there is still work to be done. Data comparing U.S. doctoral degree recipients and UC’s new faculty hires show that in many disciplines, the share of faculty from underrepresented groups among new UC assistant professors remains below the share in the national pool of available candidates.
Diversity initiatives
A wide variety of diversity programs are in place throughout the UC system to build a more diverse faculty. Notable among these programs are the President’s Postdoctoral Fellowship Program Special Presidential Initiative, the Leadership Seminar Series for Deans and Chairs, and campus-based ADVANCE programs.
President’s Postdoctoral Fellowship Program Special Presidential Initiative — Established in 1984, the President’s Postdoctoral Fellowship Program (PPFP) encourages outstanding women and under-represented PhD recipients to pursue careers at UC. As part of a special initiative to enhance the work of PPFP, the president has committed additional one-time funds to the program, with $2.4M targeted to support startup costs for fellows hired into STEM faculty positions, including the health sciences. The president also committed $2.1M as additional support for the hiring incentive offered to departments that hire fellows into the faculty. Currently, 17 fellows are being actively recruited by UC departments for positions beginning in fall 2015. The National Institutes of Health (NIH) is using PPFP as a model for postdoctoral recruiting, and PPFP was featured at a recent panel presentation during the National Postdoctoral Association convention.
Leadership Seminar Series for Deans and Chairs — Developed for department chairs and deans with a focus on department climate, the interactive theatre-based leadership seminars provide faculty administrators with a toolkit to deal with racial and gender micro-aggressions and implicit bias. By fall 2015, the seminars will have been held on all ten campuses.
ADVANCE Programs across UC — Throughout the United States, the National Science Foundation (NSF) has sponsored the ADVANCE Programs with the goal of developing “systematic approaches to increase the representation and advancement of women in academic science and engineering careers, thereby contributing to the development of a more diverse science and engineering workforce.” Currently, there are three UC campuses offering ADVANCE programs: UC Irvine, UC Riverside and UC Davis.
UC Davis has an innovative faculty hiring program, the CAMPOS Faculty Scholar program, that is increasing their number of Latina and underrepresented women in STEM. The CAMPOS Scholars are new ladder-rank faculty who are selected for the program based on their transformative thinking, unique perspectives, interdisciplinary approaches and leadership potential to affect their STEM discipline in profound and enduring ways. In its first year, the program has recruited seven scholars in a range of STEM disciplines, whose research and outreach involves underrepresented communities. In the last year, the number of Latina STEM faculty on campus increased from 10 to 15 with the addition of five Latina CAMPOS Faculty Scholars, an increase of 50% in one year (2014–2015).
For more information
More than half of ladder-rank and equivalent faculty are in STEM (science, technology, engineering and mathematics) and health sciences disciplines. The largest (and growing) percentage of non-ladder-rank faculty is employed in the health sciences.
5.1.1 Faculty by discipline, headcount, 1998 and 2014
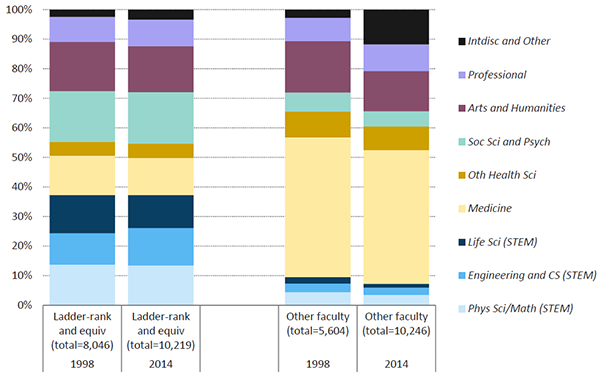
Source: UC Corporate Personnel System1
The growth in faculty over the last 15 years has not been evenly distributed across academic disciplines. Among ladder-rank and equivalent faculty, the most significant change over the past 15 years has been a shifting emphasis in the STEM disciplines. The largest growth has been in engineering and computer science — not a surprising development given the dramatically increased demand among students for training in this fast-growing sector of the economy. Headcount in other faculty series has increased by more than 4,600 (about 75 percent) since 1998 — a much greater increase than in the headcount of ladder-rank and equivalent faculty (about 2,200 or 27 percent). The most significant increase in non-ladder faculty has been in medicine.
1 Data shown are headcount numbers for all faculty members. “Other faculty” includes lecturers and senior lecturers, visiting and adjunct faculty, instructional assistants and the clinical faculty series. Other health sciences include nursing, dentistry, pharmacy, optometry and veterinary medicine.
UC faculty salaries are currently below the benchmark that UC has historically employed to assess competitiveness. This affects the University’s efforts to recruit and retain high-quality faculty.
5.2.1 Average ladder-rank general campus faculty salaries, by rank, UC and comparison institutions, 1997–98 to 2013–14
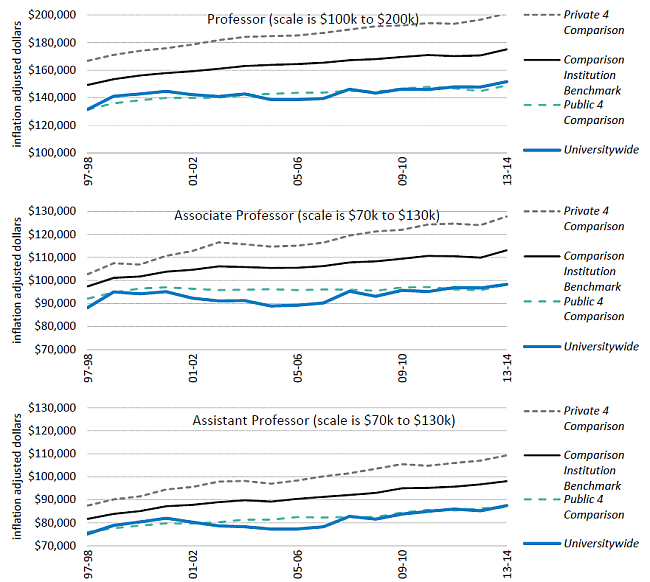
Source: UC Corporate Personnel System, AAUP faculty salary survey
UC historically has used eight universities — four public and four private — against which to benchmark its faculty salaries. The benchmark is the midpoint between the averages of the public and private institutions. The four public institutions are Illinois, Michigan, University at Buffalo and Virginia; the four private institutions are Harvard, MIT, Stanford and Yale. UC’s faculty salaries fall significantly below those of the comparison four private institutions and are just keeping pace with the four public institutions.
In the past few years, hiring of new faculty started to rebound from a drop due to state budget cuts.
5.3.1 New hires and separations of ladder-rank and equivalent faculty, Universitywide, 1984–85 to 2013–14
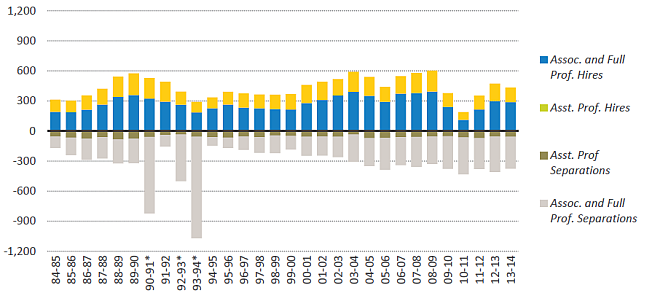
Source: UCOP Office of Academic Personnel and Program Administration1
Indicator 5.3.2 Net change in ladder- and equivalent-rank faculty, Universitywide, 1984–85 to 2013–14
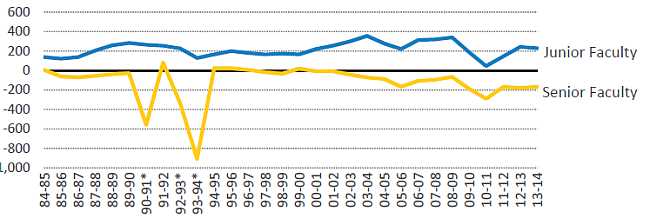
Faculty hiring decreased significantly from 2009 to 2011 in response to fiscal constraints. However, there was an uptick in new hires during 2011–12 to 2013–14.
Since 2003–04, faculty separations have exceeded 300 per year. At the same time, undergraduate enrollment has seen marked increases.
1 Associate and full professors shown here are tenured faculty; assistant professors are nontenured tenure-track faculty. A very small number of lecturers with security of employment are included in the assistant category.
*Years with Voluntary Early Retirement Incentive Program (VERIP).
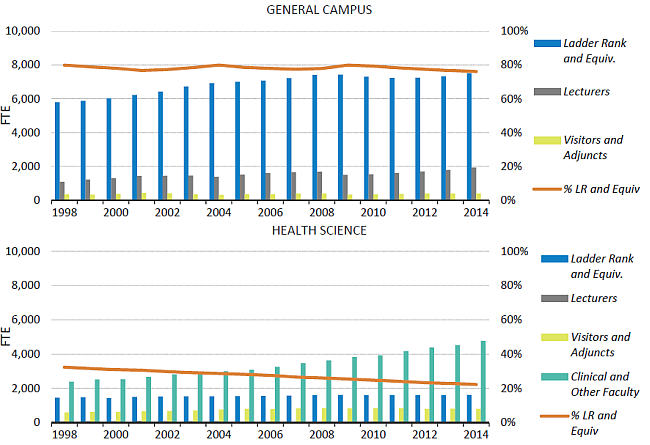
Ladder-rank and equivalent faculty constituted 76 percent of UC general campus faculty FTE in fall 2014 but only 22 percent in the health sciences.
5.3.3 Faculty workforce FTE, Universitywide, Fall 1998 to fall 2014
Source: Corporate Personnel System October snapshots and UC DSS — earned in October, paid through November1
Ladder- and equivalent-rank faculty numbers declined starting in 2009 as campuses reduced hiring to address budget shortfalls, but have since rebounded. Lecturer2 titles tend to be more common in general campus departments and represent about 20 percent of the general campus faculty. “Visitors and adjuncts” include other types of faculty who do not have tenure or security of employment. The “clinical and other faculty” category3 has grown substantially. These faculty are integral to UC’s health sciences clinical and research activities, and are paid primarily from clinical and research revenues, rather than from state sources.
1 Health Sciences includes FTE in schools of medicine, dentistry, nursing, optometry, pharmacy, public health and veterinary medicine. General campus includes FTE in all other schools and colleges.
2 Lecturers here refer to “Unit 18 Lecturers” – they are mostly part-time and most are eligible to be represented by a union (“Unit 18”). UC also employs “lecturers with security of employment” and “lecturers with potential security of employment,” of which there are fewer than 200 systemwide. “Lecturers with security of employment“ are members of the Academic Senate and they are included in the “ladder- and equivalent-rank faculty” category throughout this report.
3 Includes clinical faculty and professors in residence. Although there are exceptions, these faculty are generally employed at campuses with health science schools. They are mostly supported by non-state dollars, e.g., clinical and research revenues.
FTE of academic researchers has increased, peaking in 2010–11 due to stimulus funds from the federal Recovery Act (ARRA) but dropping since then.
5.3.4 Nonfaculty academic workforce FTE, Universitywide, Fall 1998 to fall 2014
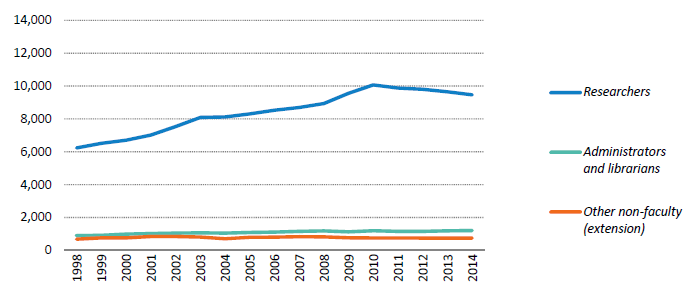
Source: UC Corporate Personnel System. Includes all academic nonfaculty titles except graduate student instructors and researchers.
Aside from faculty, most of the nonstudent academic workforce is composed of appointees in professional research titles. The great majority of researchers in the academic workforce are supported by contracts and grants from external sponsors, with the federal government providing about 60 percent of the funding for research. The number of researchers in the academic workforce peaked in 2010–11, largely due to augmentations to federally sponsored research funding provided through the American Recovery and Reinvestment Act (ARRA). Since then, federal agency appropriations for research have declined, and other sources of funding have not increased sufficiently to offset the drop in federal research support. This has resulted in a four-year decline in the overall research workforce. During FY 2013–14, however, research awards to UC from federal and other sources, which have a lag before they are spent, showed a significant increase. If this positive trend continues, then as these funds are spent, the research workforce is likely to stabilize and perhaps return to modest growth. Chapter 9, Research, provides details and analysis of the impact of external sponsorship on the research workforce.
The proportion of underrepresented minority scholars among UC assistant professor hires continues to lag in some fields behind their proportion among Ph.D. recipients.
5.4.1 New assistant professors compared with national availability for underrepresented minorities, by discipline, Universitywide, 2009 to 2013
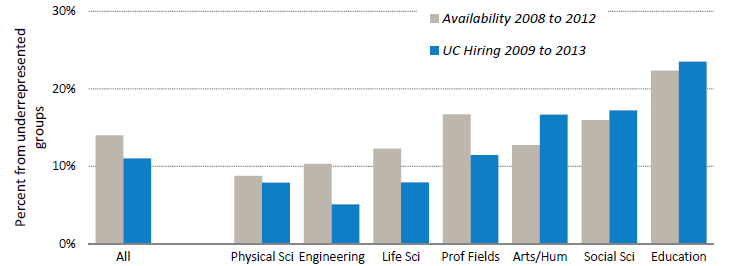
Source: UCOP Academic Personnel and Program Administration and Survey of Earned Doctorates
5.4.2 Percent of tenure and tenure-track faculty who are female and/or from underrepresented race/ethnic groups, UC and Comparison Institutions, Fall 2013
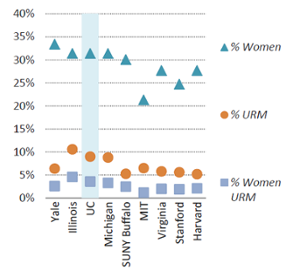
Source: IPEDS
As evidenced by its continuing campus and system-wide efforts, the University of California remains deeply committed to diversifying its faculty, and taking full advantage of the available pools of qualified candidates. Between 2009 and 2013, underrepresented minorities accounted for 14 percent of the pool of nationwide doctoral degree recipients and 11 percent of UC’s new assistant professors.
The proportion of women and underrepresented minorities continues to grow at a modest pace. When these diversity figures are displayed in the context of other peer research institutions in the U.S., namely the “Comparison 8,” UC compares favorably. According to 2013 data, UC is tied for second for the percentage of women faculty, at 31.4%. Additionally, UC places second for the percentage of URM faculty and women URM faculty, at 9.0% and 3.6% respectively.
UC’s hiring of women faculty lags behind the national availability in every broad discipline group except engineering.
5.4.3 New assistant professors compared with national availability for women and discipline, Universitywide, 2009 to 13
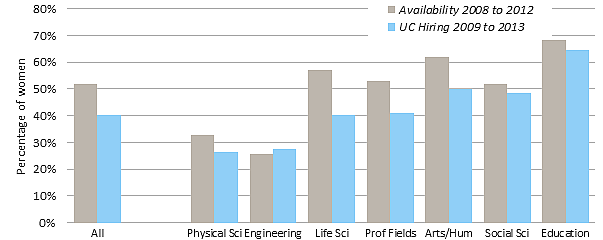
Source: UC Academic Personnel and Program Administration and Survey of Earned Doctorates1
Between 2009 and 2013, women constituted more than half of the nationwide pool of new doctoral degree recipients but only 40 percent of UC’s new hires. At a time when the nation’s pool of doctoral degree recipients is showing increasing numbers and percentages of women, outreach and recruitment efforts at UC are not generating faculty hire rates that are fully reflective of changes in national availability pools, although the differential varies by field.
UC ADVANCE PAID, a program sponsored by UC Office of the President and the National Science Foundation (NSF), aims to recruit, retain and advance more women and URM women faculty in the fields of science, technology, engineering and mathematics (STEM).
1 This analysis follows the campus practice required for federally mandated affirmative action plans; UC is required by Proposition 209 to satisfy federal reporting requirements in this area. See the appendix for additional details.
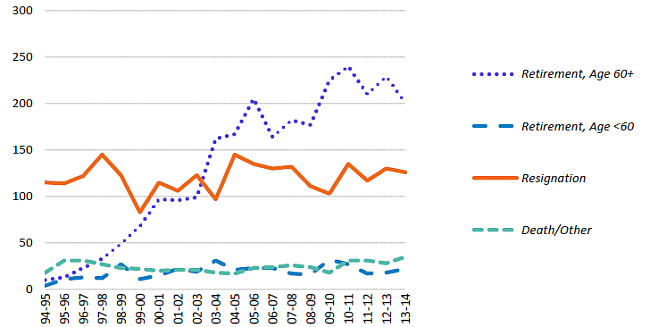
The number of faculty who have retired at age 60 or above has grown in the past 15 years; departures for other reasons have remained constant.
5.5.1 Departure reasons of faculty, Universitywide, all faculty, 1994–95 to 2013–14
Indicator 5.5.2 Departure reasons by rank, Moving four-year average, 1997–98 to 2013–14
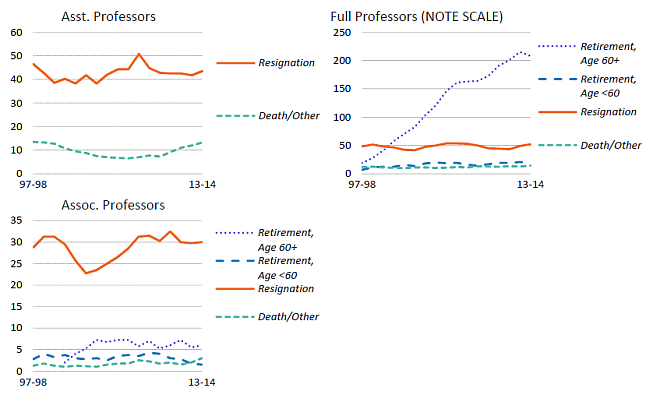
Source: UCOP Office of Academic Personnel and Program Administration1
1 “Other” reasons include faculty whose appointments ended or who were not tenured or not renewed. The data shown are the average of the past four years. For example, the figure for 10–11 is the sum of departures from 07–08 to 10–11 divided by four.