Goals
The University of California is dedicated to fostering a university community that provides leadership for constructive participation in a diverse, multicultural world. The University has a long history of supporting initiatives that foster an inclusive living, learning and working environment.
In 2014, UC issued the following statement titled An Ethos of Respect and Inclusion:
“We seek to create and nurture in every corner of the University — in lecture halls and laboratories, in dormitories and dining halls, in work cubicles and maintenance shops, in our hospitals and other outposts of community engagement, in the public commons and the virtual meeting grounds of social media — an ethos of respect for others and inclusion of all.
Such an ethos need not undermine the spirit of free speech and acceptance of differing ideas and attitudes that have long been the University’s hallmark. Rather, respect and inclusion form the essential bedrock on which to build a community that cherishes and benefits from robust, constructive discourse and daily interactions among all its members.
An ethos of respect and inclusion won’t be achieved by any single pledge or policy handed down from leadership. It requires the constant attention and the enduring commitment of the entire UC community — every student, every professor, every administrator, every staff member, everybody, every day.”
Evaluating diversity and campus climate
UC’s assessment of diversity and campus climate can be evaluated a variety of ways: current demographic characteristics and trends of its students, faculty and staff; policies and activities that promote equity and inclusion; and survey data that reveal perceptions of campus climate, respect and incidents of exclusionary behavior.
Trend data illustrate growing proportions of underrepresented and international students in the undergraduate population, more so for freshman than transfer entrants. Over the last 15 years, the proportion of Chicano/Latino undergraduates has grown tremendously, reflecting the growing number of Chicano/Latino students in California and improved high school graduation rates. Four UC campuses (Riverside, Santa Cruz, Merced and, most recently, UC Santa Barbara) are designated as Hispanic-Serving Institutions (HSIs). Two more UC campuses, Irvine and Davis, are emerging HSIs.
Among graduate academic students, underrepresented populations show slow and steady increases across disciplines, with growth in international students limited to physical science and engineering. Female students constitute the majority in all disciplines except for physical science and engineering. Graduate professional programs show similar growth patterns for underrepresented and international students, with variation by discipline. Education programs have a larger proportion of underrepresented students, and business and other professional programs have growing international populations. The proportion of female students is trending slightly downward but remains around 50 percent or higher for all disciplines except business.
For staff, the proportions of nonwhites and females in Management & Senior Professional (MSP) and Senior Management Group (SMG) positions are smaller than their proportions in Professional & Support Staff (PSS) positions. The proportion of females among ladder-rank faculty is lower than proportions among other academic employee groupings.
Surveying populations about campus climate
This chapter introduces two types of survey data: responses to the UC Undergraduate Experience Survey (UCUES), conducted every two years to all undergraduates, and the UC Campus Climate Survey, administered between 2012 and 2013 to all populations and across all locations. The University’s goal is to assure that all students are respected on campus, regardless of race/ethnicity, religious affiliation, gender, or sexual orientation.
UCUES data show most undergraduates feel students of their race/ethnicity are respected on campus, but the proportion of African American respondents sharing this perspective is lower than other groups. Among religious groups, Muslim students are less likely to feel respected. LGBQ students also are less likely to feel respected.
UC Campus Climate Survey findings tended to be positive but also highlighted areas for improvement. Overall, 79 percent feel comfortable or very comfortable with campus climate, but 24 percent reported experiencing exclusionary behavior (9 percent of whom indicated it affected their ability to work or learn).
Looking forward
Each location is delving deeply into its campus climate survey data. The information will be presented to local groups and associations to elicit ideas for improvement. Based on this data and local feedback, each location head is expected to develop action plans and strategic initiatives to improve the overall campus climate. This information will be shared at a future Regents’ meeting.
For more information
Each year, UC enrolls a growing number of undergraduates from underrepresented groups (African American, American Indian or Chicano/Latino); entering freshmen are more likely to be from an underrepresented group than entering transfer students.
7.1.1 Racial/ethnic distribution of new undergraduates, Universitywide, Fall 1999 to fall 2014
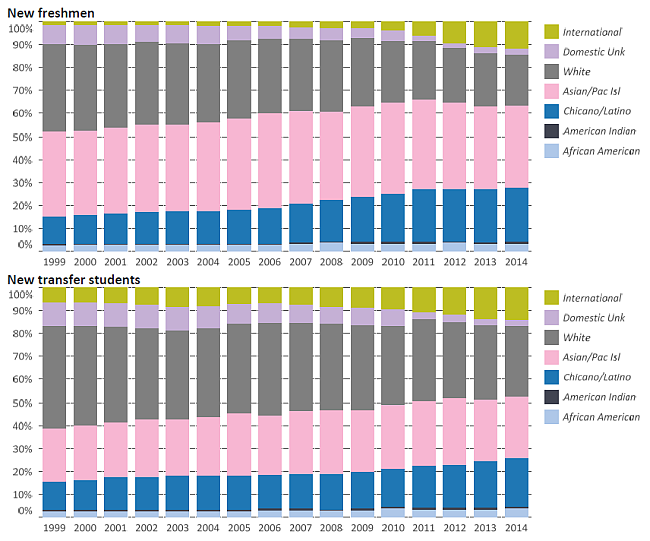
Source: UC Information Center Data Warehouse
A number of factors may help explain why entering freshmen are more diverse than entering transfer students. Among the population of high school graduates sufficiently prepared to qualify for UC, white students are more likely to be from high-income families and to choose private and out-of-state colleges, while Asian American and Chicano/Latino students are more likely to choose UC. Part of the Transfer Action Team initiative’s charge is to look for opportunities to expand outreach to California community colleges with greater diversity of transfer-eligible students who currently do not apply to UC.
As shown on the next indicator, campuses vary in their racial/ethnic diversity.
7.1.2 Racial/ethnic distribution of new undergraduates, UC campuses, Fall 1999 to fall 2014 (selected years)
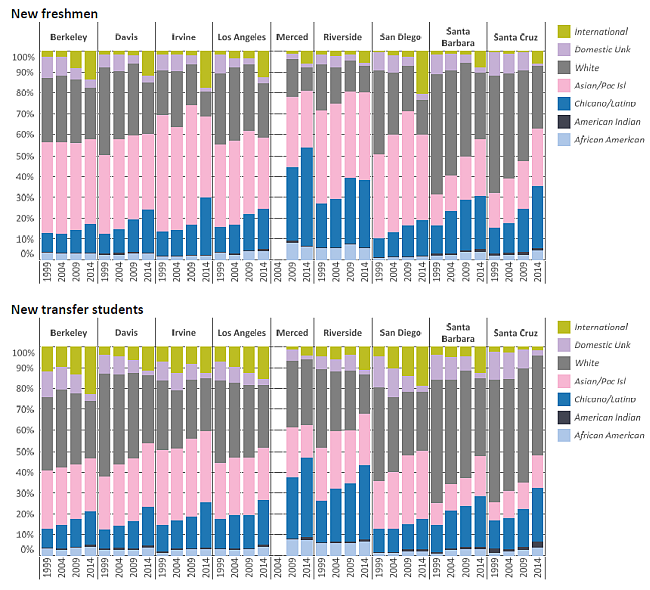
Source: UC Information Center Data Warehouse
UC is making slow but steady progress in diversifying the racial/ethnic makeup of its graduate academic students.
7.2.1 Racial/ethnic distribution of graduate academic students, by discipline, Universitywide, Fall 1999 to fall 2014 (selected years)
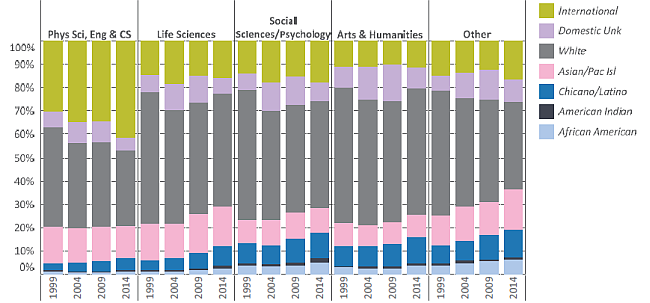
Source: UC Information Center Data Warehouse1
Enrollment of underrepresented race/ethnic groups (African American, American Indian and Chicano/Latino) in UC’s graduate academic programs has grown over the past decade. In 2012–13, UC awarded academic doctoral degrees to underrepresented racial/ethnic groups at greater percentage rates than did its peers.
Proportion of underrepresented racial/ethnic groups receiving academic doctoral degrees
| 2012–13 |
UC
|
Other AAU
Public
|
AAU
Private
|
| Social Sciences |
13%
|
10%
|
7%
|
| Arts & Humanities |
11%
|
9%
|
7%
|
| Life Sciences |
10%
|
8%
|
8%
|
| Physical Sciences |
5%
|
4%
|
3%
|
| Engineering & CS |
5%
|
3%
|
4%
|
Source: IPEDS
UC’s graduate programs draw students from across the nation and around the world, including its own undergraduate students, who make up about a tenth of UC’s graduate students. As a consequence, UC’s efforts to diversify its undergraduate students can also help to diversify its graduate academic population.
Because recent Ph.D.s constitute the pool for new faculty, a critical means for increasing the diversity of the faculty is to increase the diversity of the pool of doctoral degree recipients.
1 “Other” disciplines represent about 12 percent of degrees awarded and include interdisciplinary areas (3 percent), academic degrees in professional fields such as a Ph.D. in education (4 percent) or health sciences (3 percent) and miscellaneous areas such as criminology.
Overall, 43 percent of UC’s graduate academic students are women, compared with 53 percent of its undergraduates.
7.2.2 Gender distribution of graduate academic students, by discipline, Universitywide, Fall 1999 to fall 2014 (selected years)
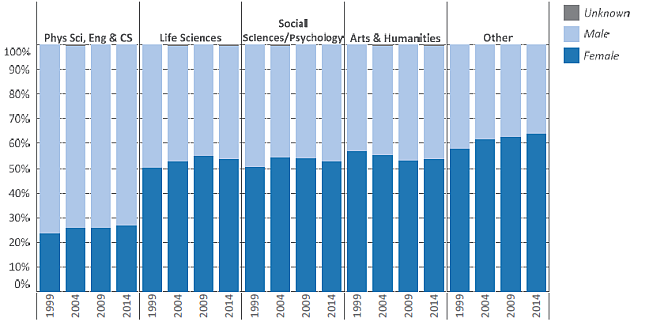
Source: UC Information Center Data Warehouse1
The proportion of graduate academic students who are women varies by discipline. Half or more of the graduate academic students in the life sciences, social sciences and humanities are women, compared with about one-quarter in the physical sciences, engineering and computer science.
Overall, the proportion of degree recipients who are women by broad discipline group is comparable to UC’s AAU peers.
Proportion of women receiving academic doctoral degrees, 2012–13
| 2012-13 |
UC
|
Other AAU Public
|
AAU Private
|
| Life Sciences |
54%
|
58%
|
51%
|
| Social Sciences |
56%
|
52%
|
52%
|
| Arts & Humanities |
54%
|
52%
|
54%
|
| Physical Sciences |
32%
|
31%
|
32%
|
| Engineering & CS |
21%
|
21%
|
25%
|
Source: IPEDS
1 “Other” disciplines include interdisciplinary areas, miscellaneous fields such as criminology and academic degrees in professional fields such as a Ph.D. in business or law.
The proportion of students from underrepresented racial/ethnic groups enrolled in UC’s professional degree programs varies widely — lowest in business and highest in education.
7.2.3 Racial/ethnic distribution of graduate professional degree students, by discipline, Universitywide, Fall 1999 to fall 2014 (selected years)
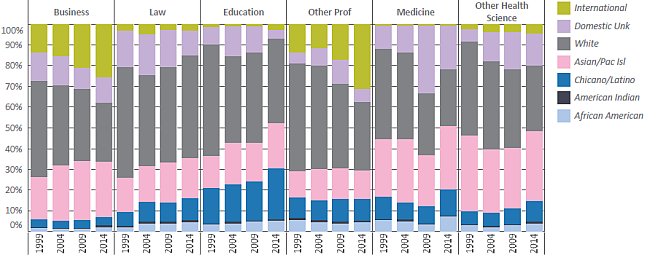
Source: UC Information Center Data Warehouse1
UC awards a greater share of its education, medicine and other health science professional degrees to students from underrepresented race/ethnic groups compared with its AAU peers, but a smaller share of its business degrees.
Proportion of underrepresented students receiving professional degrees, 2012–13
| |
UC
|
Other AAU Public
|
AAU Private
|
| Education |
23%
|
11%
|
19%
|
| Law |
16%
|
12%
|
15%
|
| Other health sci |
17%
|
9%
|
12%
|
| Medicine |
13%
|
9%
|
12%
|
| Business |
6%
|
7%
|
8%
|
Source: IPEDS
1 “Other health sci” includes dentistry, nursing, optometry, pharmacy, public health and veterinary medicine; “Other prof” includes programs such as architecture, library and information science, public policy and social welfare, and other small programs. Medical residents are not included.
The proportion of women enrolled in UC’s professional degree programs varies widely and is trending somewhat downward in nearly all fields.
7.2.4 Gender distribution of graduate professional degree students, by discipline, Universitywide, Fall 1999 to fall 2014 (selected years)
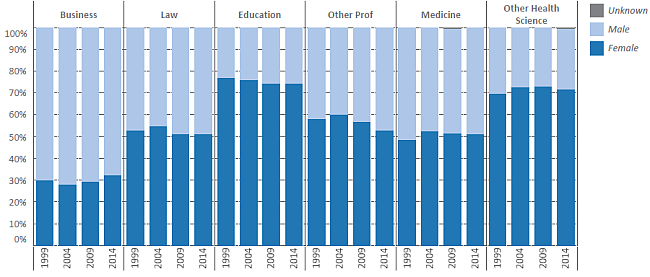
Source: UC Information Center Data Warehouse1
The proportion of women enrolled in UC’s professional degree programs has trended slightly downward in all discipline areas except for business.
As shown in the table, UC graduated roughly the same proportion of women in professional degree programs as the comparison AAU peers — somewhat higher in law and nonmedical health sciences and somewhat lower in business.
Proportion of women receiving professional degrees, 2012–13
| |
UC
|
Other AAU Public
|
AAU Private
|
| Education |
76%
|
76%
|
75%
|
| Other health sci |
72%
|
71%
|
73%
|
| Medicine |
53%
|
50%
|
49%
|
| Law |
51%
|
43%
|
45%
|
| Business |
29%
|
36%
|
34%
|
Source: IPEDS
1 “Other health sci” includes dentistry, nursing, optometry, pharmacy, public health and veterinary medicine; “Other prof” includes programs such as architecture, library and information science, public policy and social welfare.
Undergraduates have the highest proportion of underrepresented students. Graduate professional and academic populations have comparable representation of underrepresented groups but vary in their share of international students.
7.3.1 Racial/ethnic distribution of students, Universitywide and by campus, Fall 2014
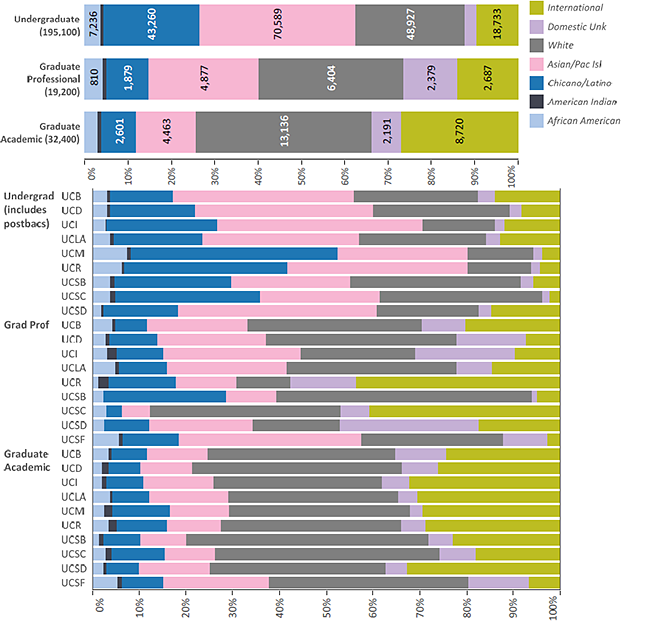
UC Merced does not have any graduate professional programs at this time. Undergraduates include approximately 300 postbaccalaureate teaching credential students.
UC systemwide data shows that almost a quarter of undergraduate students are from underrepresented groups.
About 12 percent of graduate academic and 15 percent of graduate professional students are from underrepresented groups. Campuses vary in the share of international students, who represent 27 percent of graduate academic and 14 percent of graduate professional students.
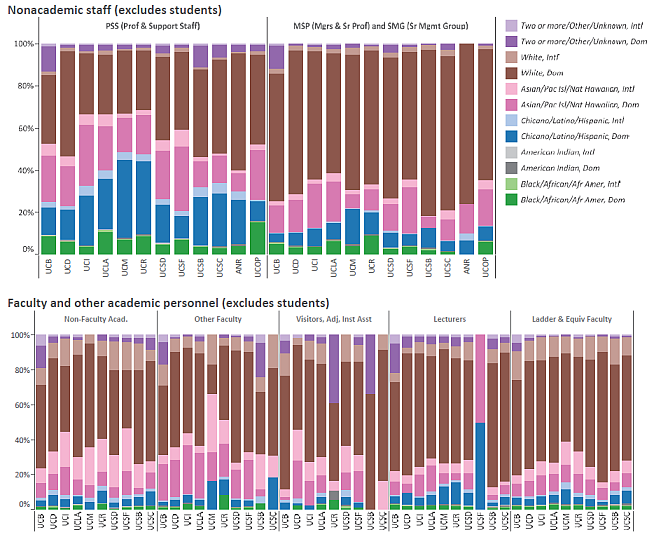
The proportion of nonwhite staff is lower among more senior positions, and the proportion of nonwhite academics is highest among nonfaculty academics.
7.3.2 Racial/ethnic distribution of staff, faculty and academic employees, Universitywide, Fall 2014
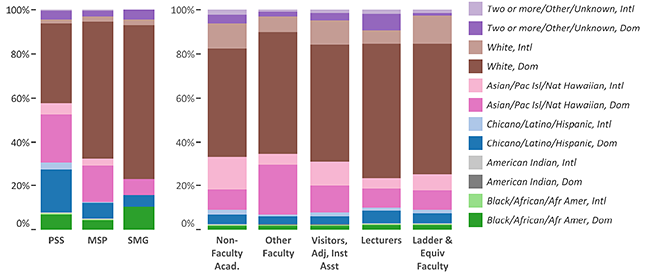
Source: UC Corporate Personnel System and UC Information Warehouse Data Center1
UC values cultivating a work and learning environment inclusive of all communities. The University seeks to improve representation of domestic racial/ethnic groups that have been historically underrepresented. As shown below, UC is especially challenged in improving the representation of these groups in senior staff (MSP and SMG), academic and faculty positions.
International employees contribute to the diversity of the UC workforce. These employees bring educational backgrounds and experiences that differ from those of domestic employees. As shown below, the highest proportion of international academics is in the nonfaculty academics category, primarily due to high numbers of international postdoctoral scholars.
1 International status for faculty and staff is based on citizenship status instead of IRS tax status, which was used in the 2012 Accountability Report. The “Other Faculty” group includes professors in residence, professors-clinical and health science clinical faculty. The “Non-Faculty Acad” group includes only nonstudent employees and comprises many positions (e.g. librarians and administration categories) as well as academic researchers. Students are excluded in all groups.
| |
Domestic
|
International
|
|
Black/African American, American Indian, or Chicano/Latino/Hispanic
|
Asian, Pac Isl, or Nat Hawaiian
|
All races/ ethnicities
|
| PSS (Professional and Support Staff) |
27.1%
|
22.0%
|
10.5%
|
| MSP (Managers and Senior Professionals) |
12.0%
|
16.6%
|
6.1%
|
| SMG (Senior Management Group) |
15.8%
|
7.6%
|
2.9%
|
| |
|
|
|
| Nonfaculty Acad. |
6.6%
|
9.2%
|
30.9%
|
| Other Faculty |
5.8%
|
22.8%
|
13.7%
|
| Visitors, Adj, Inst Asst |
5.7%
|
12.5%
|
24.8%
|
| Lecturers |
8.3%
|
8.8%
|
14.5%
|
| Ladder & Equiv Faculty |
7.2%
|
8.8%
|
23.0%
|
All percentages use the total (both domestic and international) as the denominator.
7.3.3 Racial/ethnic distribution of staff, faculty and academic employees, By location, Fall 2014
Source: UC Corporate Personnel System and UC Information Warehouse Data Center. Note: ANR stands for Agriculture and Natural Resources. UCOP is UC Office of the President.
7.3.4 Gender distribution of the University community, Universitywide and by location; Fall 2014
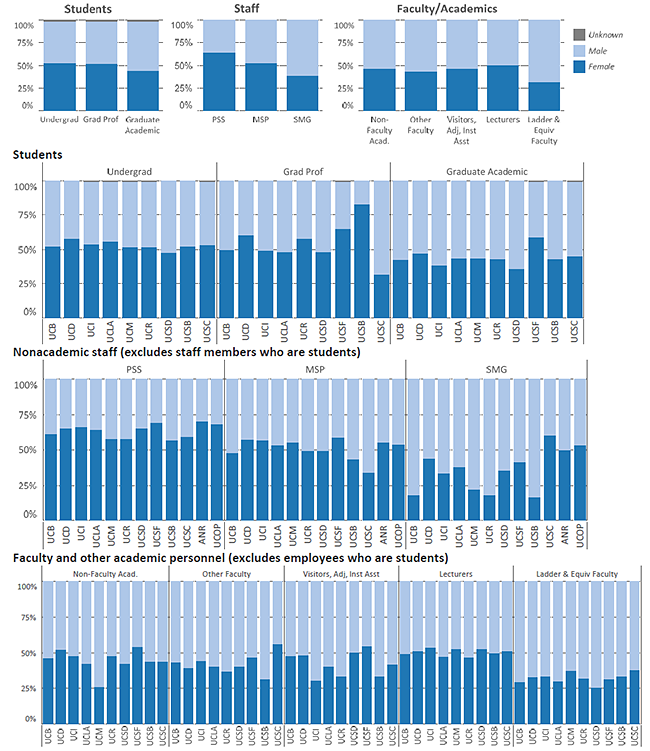
Women constitute 40 percent or more of all student, staff and academic employee groups, except for ladder-rank faculty and senior managers.
Source: UC Corporate Personnel System and UC Information Warehouse Data Center. Note: ANR stands for Agriculture and Natural Resources. UCOP is UC Office of the President.
Surveys show that most undergraduates feel that students of their same race/ethnicity are respected on campus, but the proportion of African Americans who report feeling respected is lower than other groups.
7.4.1 Response to “Students of my race/ethnicity are respected on this campus,” Universitywide and UC campuses, Spring 2008, 2010, 2012 and 2014
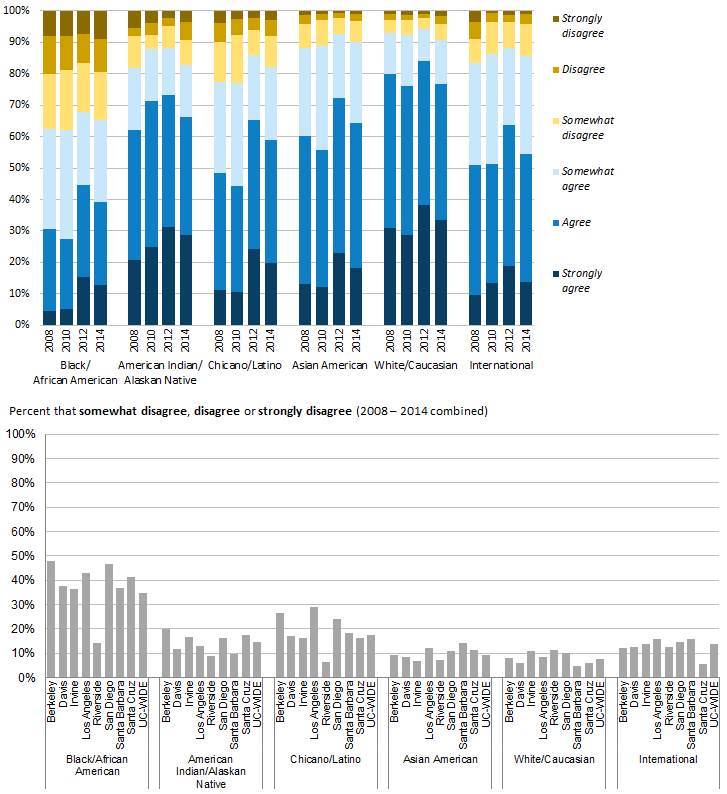
Source: UCUES
7.4 UNDERGRADUATE CAMPUS CLIMATE
More than 70 percent of students from major religious groups feel that students of their religions are respected.
7.4.2 Response to “Students of my religion are respected on this campus,” Universitywide and UC campuses, Spring 2008, 2010, 2012 and 2014
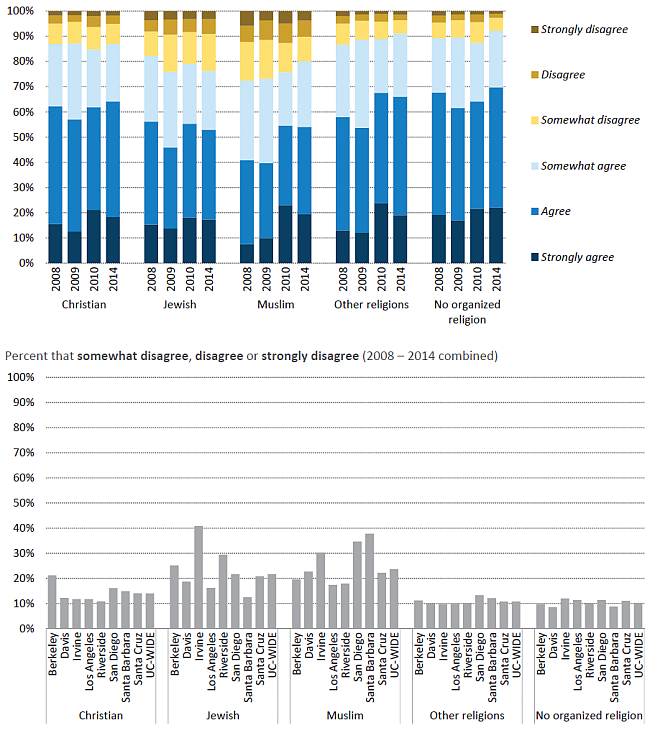
Source: UCUES
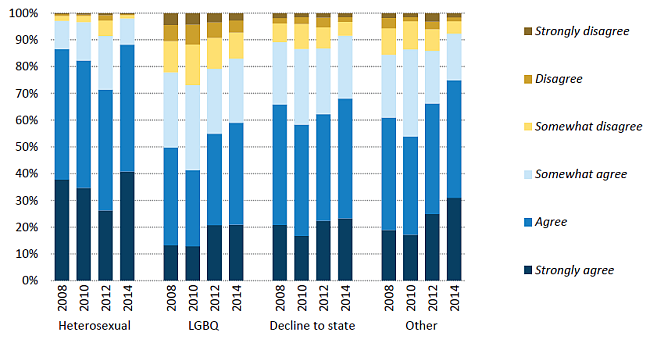
Undergraduates who identify as LGBQ and those who identify as other than male or female are less likely to feel respected on campus than those who do not.
7.4.3 Response to “Students of my sexual orientation are respected on this campus”, Universitywide, Spring 2008, 2010, 2012 and 2014
7.4.4 Response to “Students of my gender are respected on this campus,” Universitywide, Spring 2008, 2010, 2012 and 2014
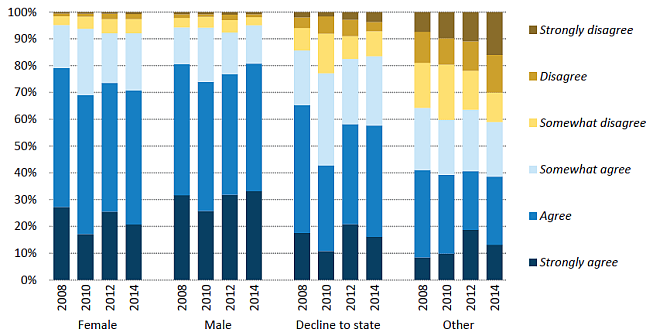
Source: UCUES. The LGBQ category includes: Gay/Lesbian, Bisexual, Self-identified Queer and Questioning/Unsure. The Other category is its own category in UCUES; the data shown here do not include any other responses. Because the numbers for some of the groups are small, campus data are not reported separately.
Overall, 79 percent of respondents in the UC community feel comfortable with the climate at their location, with some variation by positions and demographic groups.
7.5.1 Percent “Comfortable” or “Very Comfortable” with climate on campus or at location, Universitywide, 2012
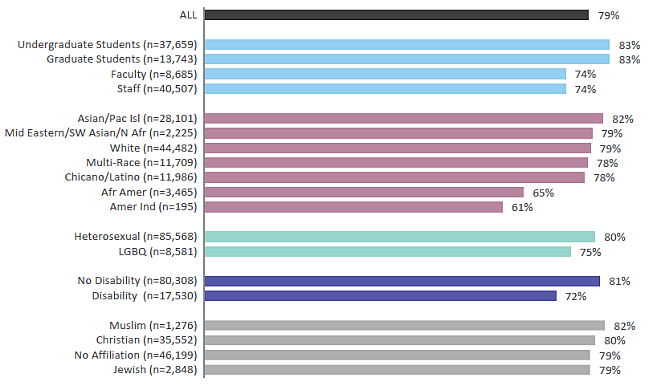
Source: UC Campus Climate Survey
Recognizing the importance of gauging campus climate in creating more inclusive and welcoming environments, in 2010, then-University of California President Mark G. Yudof formed a President’s Advisory Council on Campus Climate, Culture, and Inclusion. The Council was charged with monitoring campus progress and metrics, and examining campus practice and policy. Each of the chancellors at UC’s campuses and location heads at UCOP, LBNL and ANR created similar councils. In May 2010, the Regents created the Ad Hoc Committee on Campus Climate.
In 2012, the UC Office of the President commissioned a systemwide campus climate study across the ten UC campuses and three UC locations (Lawrence Berkeley National Laboratory, UC Division of Agriculture and Natural Resources, and UC Office of the President).
All students and employees were given the opportunity to take the survey. Seventy-nine percent of all respondents (n = 81,939) were “comfortable” or “very comfortable” with the climate at UC, while 7 percent (n = 7,510) were “uncomfortable” or “very uncomfortable.”
About 24 percent of the UC community experienced exclusionary behavior within the last year.
7.5.2 Percent experiencing exclusionary behavior within last year, Universitywide, 2013
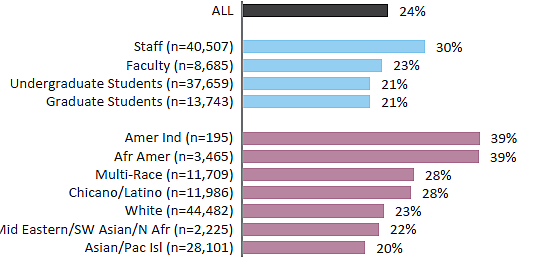
Source: UC Campus Climate Survey
Twenty-four percent of respondents (n=25,264) recently experienced exclusionary behavior; 16 percent said it did not affect their ability to work or learn, but 9 percent said it did. A greater percent of staff and respondents from underrepresented populations experienced this type of behavior.
Most commonly (nearly 50 percent) of the reported exclusionary behaviors were being “isolated,” “ignored” or “intimidated or bullied.”