Chapter 1:
Undergraduate Admissions and Enrollment
goals
One of the University of California’s highest priorities is to ensure that a UC education remains accessible to all Californians who meet its admissions standards. This goal is articulated in California’s Master Plan for Higher Education, which calls for UC to admit all qualified freshmen in the top 12.5 percent of California public high school graduates. It also calls for UC to admit all qualified California Community College (CCC) transfer students.
In fall 2015, there were around 158,000 freshmen applicants and 36,000 transfer applicants. Campus admissions decisions are based on a comprehensive review of the qualifications of applicants and target the incoming class size based on available state funding.
UC’s ongoing “Achieve UC” program is specifically designed to connect diverse, low-income high school students with UC campus leaders, with the goal of inspiring them to see themselves as college students and to educate them about UC eligibility, the application process, financial aid and Transfer Pathways from community colleges, should they choose that route. The effort, now in its fifth year, has helped increase the number of students applying to UC by as much as 30 percent at participating high schools.
As the University increases the number of transfers from community colleges, the goal is to admit entering cohorts that are close to a 2:1 ratio of freshmen to transfer students.
Admissions trends — freshmen
Freshman applicants have risen dramatically over the past two decades, growing five to six percent per year and more than tripling since 1994. With increases in high school graduation rates, particularly among Hispanic/Latino(a) students, the University expects continued growth in demand for college access.
UC relies on a comprehensive review process to make admissions decisions, considering not only successful completion of a rigorous curriculum of college preparatory courses, high school GPA and standardized test scores but also special talents, special projects, accomplishments in light of life experiences and special circumstances, participation in extracurricular activities and community service.
Although restricted funding from the state means that certain campuses have admitted a lower percentage of applicants, it is anticipated that this trend will be reversed for fall 2016 given that the University will enroll 5,000 additional California residents. UC continues to reach its Master Plan goals by guaranteeing admission to applicants from California who are either in the top 9 percent of high school graduates statewide or the top 9 percent of graduates from their own high school. Qualified freshman applicants are offered an opportunity to be admitted to another UC campus if they do not receive an offer of admission from the UC campuses where they applied.
Admissions trends — transfers
Fall transfer applicants have almost doubled over the last 20 years, reaching a high of 36,200 in 2011. Applicants dropped to 34,800 in 2012 and slightly rebounded to around 35,000 in 2013 and 2014. The number continued to increase in 2015 and is now close to its previous peak.
President Napolitano convened the Transfer Action Team in December 2013 to recommend strategies to strengthen and streamline the transfer pathway between the California Community Colleges (CCCs) and the University of California. Both UC’s Transfer Action Team and the CCCs identified state budget cuts to the CCCs as the likely cause of the decline in applications. With improving state revenues and Proposition 98, state support for the CCCs has increased. Preliminary data from 2016 show an increase in CCC transfer applications, lending credence to the idea that the restoration in funding for the CCCs, coupled with the Academic Senate’s efforts to create major-specific UC Transfer Pathways, will likely result in increased transfer applicants. To accommodate the projected growth in applicants and better serve transfer students, the application deadline for fall 2016 was extended by more than a month.
Almost all transfer students enter UC as upper-division juniors. Campus enrollment targets are based on capacity in major programs at the upper-division level.
Enrollments
The University enrolls freshmen and transfer students from every county of California, but students tend to apply to campuses closer to their residence. One of the goals of UC’s Eligibility in the Local Context (ELC) program and the president’s transfer initiative is to increase the geographic diversity of entrants.
The Master Plan specifies that the University maintain a 60:40 ratio of upper-division to lower-division students, which corresponds to a 2:1 ratio of new freshmen to new CCC transfers. Over the past several years, UC has moved closer to that ratio, from 2.42:1 in 2007–08 to 2.28:1 in 2015–16. The report from the Transfer Action Team recommits the University to achieving that goal by 2017–18.
Compared to a decade ago, freshman and transfer entrants today are better prepared academically as measured by grades, and — for freshmen — test scores and the number of rigorous high school courses completed. As academic qualifications of the entering class continue to improve, UC maintains access for populations historically underserved by higher education. About 40 percent of undergraduates come from low-income families, and 42 percent do not have parents with a four-year degree.
The number of nonresident domestic and international students has increased in recent years, though their proportion is still much lower than at comparable research universities. Nonresident students enrich and diversify the student body; they also pay supplemental tuition ($24,708 in 2015–16) above in-state charges. This extra revenue enables UC to improve educational programs for all students.
Looking Ahead
The University is committed to sustaining access to its campuses and meeting the challenge of educating as many California residents as it can. UC plans to increase enrollment of California residents at UC campuses by a total of 10,000 full-time equivalent (FTE) students over the next three years. The strategy will begin by enrolling 5,000 additional freshmen and transfer students for the academic year 2016–17 and 2,500 students for each of the following two years.
UC has a long history of welcoming student veterans and military personnel to its campuses. UC enrolls an increasing number of veterans and other military-connected personnel as part of its diverse student community, with enrollments of undergraduates with military backgrounds more than doubling since 2002–03. UC has engaged in a variety of programs to meet the needs of those who have served. As a result of consultation with student veterans from all ten campuses on the needs and challenges of veterans and military personnel enrolled at UC, President Napolitano convened an Advisory Council on Student Veterans in 2014. UC has since launched a comprehensive website to provide prospective and current student veterans with information regarding admissions, campus Veterans Services, educational benefits, priority housing and other information necessary to their academic success.
UC also held a Veterans Career Success Forum in April 2016, providing participants with the opportunity to learn about networking and to engage with veteran-friendly California employers, UC veteran alumni and UC graduate/professional school representatives. Each UC campus Veterans Resource Center provides a number of ongoing services to military students, including but not limited to the following: designated veterans space, veterans admission support, academic advising, priority class registration, financial aid, counseling and psychological services, and programs for veterans’ dependents or families.
As UC’s student veteran population grows, the University continues to seek opportunities for promoting their academic success and social well-being. “Serving those who serve” continues to be an important part of the University’s mission.
For more information
UC Information Center dashboards and data tables:
Demand for UC continues to grow.
1.1.1 Freshman applicants, admits and enrollees, Universitywide, Fall 1994 to 2015
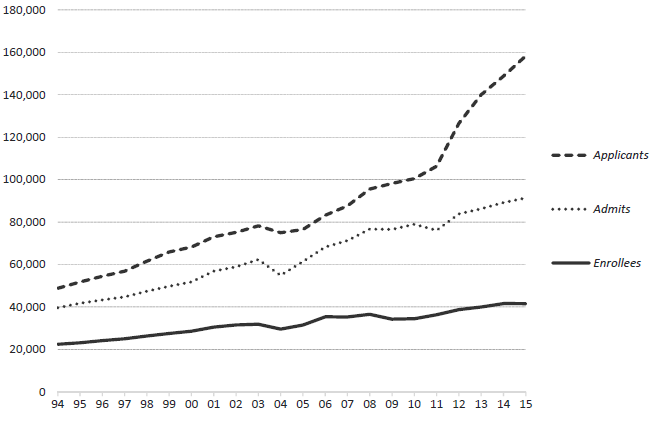
Source: UC Information Center Data Warehouse1
The rapid growth in freshman applicants to UC over the past two decades demonstrates the increased demand for college education, the growth of California’s population and UC’s continued popularity with California graduates. UC continues to maintain its obligations under the Master Plan by guaranteeing admission to all qualified students.
Some qualified applicants are not offered admission at the campus they applied to but instead are admitted to another campus by a referral process. A change in accounting for referral students is responsible for the apparent drop in 2011 admits. Beginning that year, UC Merced admitted only students who indicated interest in a referral offer, rather than every student who qualified for such an offer. This procedural change is reflected in indicators 1.1.1 and 1.1.2 for Merced.
From 2010 to 2015, unduplicated freshman applicants grew 58 percent, compared to a 27 percent increase in the six-year period between 2003 and 2009. The 58 percent growth consists of increases of 21 percent among California residents, 19 percent among domestic nonresidents and 18 percent among international applicants.
Most UC campuses have experienced tremendous growth in applications and admissions. Trends in campus enrollments have been more stable over time.
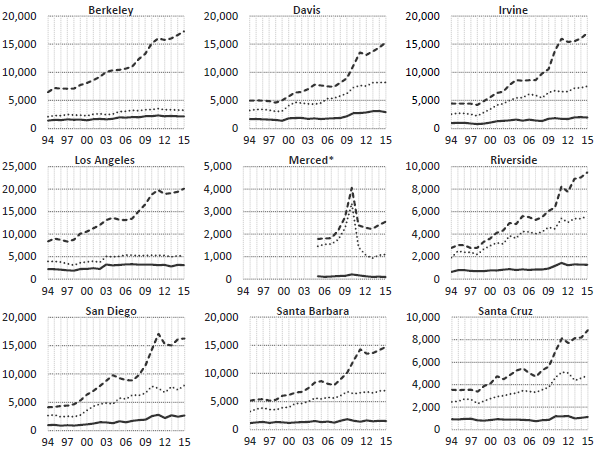
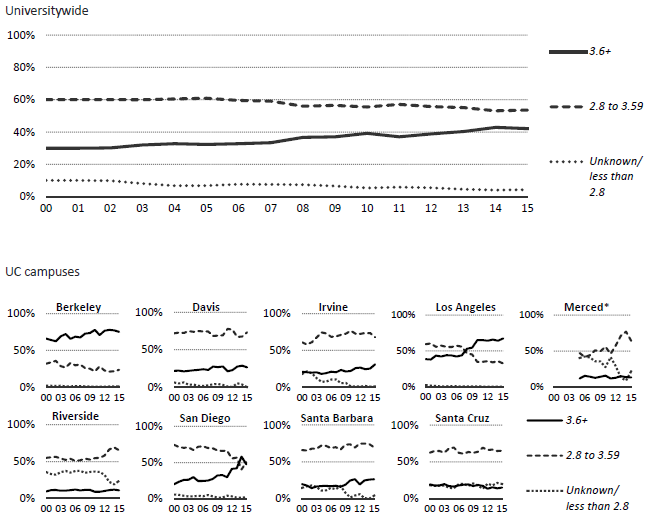
1.1.2 Freshman applicants, admits and enrollees, UC campuses, Fall 1994 to 2015 [SCALES VARY]
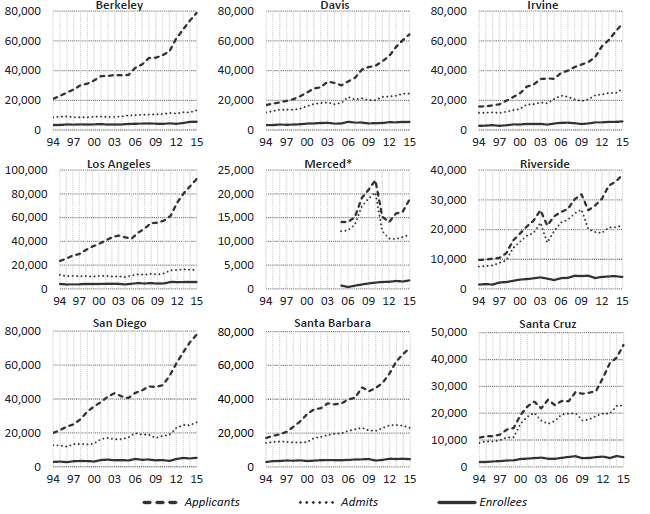
Source: UC Information Center Data Warehouse1
Most UC campuses have seen considerable growth in the number of freshman applications they receive, as demonstrated by the steep dashed lines in the graphs above. One factor contributing to this growth is the increase in the number of UC campuses chosen by each applicant; this grew from about 2.8 campuses per applicant in 1994 to over 3.5 campuses per applicant in 2015.
1 Applicants here include the “referral pool,” which comprises eligible applicants who are not offered admission at a campus to which they applied, but who are admitted to another campus with sufficient capacity. Some campuses admit fall applicants for a subsequent term (winter or spring). These “rollover” admits and enrollees are excluded from these graphs, which only show fall data. A change in accounting for referral students is responsible for the apparent drop in 2011 admits. Beginning that year, UC Merced began admitting only students who indicated interest in a referral offer, rather than every student who qualified for such an offer. This procedural change is reflected in the 1.1.2 and 1.1.4 graphs for Merced. *Merced opened in 2005.
Since 2012, transfer admissions and enrollments have fluctuated but all are higher now than three years ago.
1.1.3 Transfer applicants, admits and enrollees, Universitywide, Fall 1994 to 2015
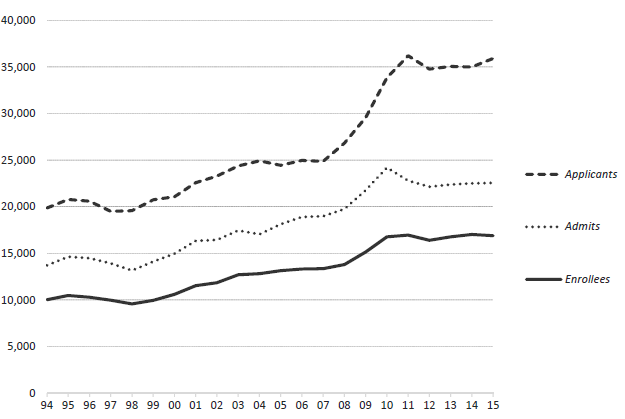
Source: UC Information Center Data Warehouse1
After a period of sizable growth from 2007 to 2011, which followed a decade of more modest growth, UC experienced a significant drop in California resident transfer applicants in 2012, and the number has fluctuated each year since. As of fall 2015, the number of transfer applicants is the highest it has been since the peak in 2011. Among admits and enrollees, the numbers have generally increased steadily since 2012, although the number of enrollees dropped slightly in 2015.
The decline in applicants likely was due to fiscal constraints in the California Community Colleges (CCCs), which forced them to decrease enrollment by about 500,000 students over the past few years, curtail courses that students needed for transfer, and cut counseling services.
Recent funding increases to the CCCs and UC’s transfer initiative are likely to expand the number of students that transfer to UC. Preliminary data from 2016 indicate that CCC transfer applications may be rebounding at an increasing rate.
Since 1994, transfer applications, admissions and enrollees have increased at every campus.
1.1.4 Transfer applicants, admits and enrollees, UC Campuses, Fall 1994 to 2015 [SCALES VARY; SEE LEGEND IN PREVIOUS INDICATOR]
Source: UC Information Center Data Warehouse
Consistent with UC’s commitment to transfer students, the fall enrollment of new California Community College (CCC) California resident transfers has increased 63 percent since 1994 (from 8,400 to over 13,700). In terms of enrolling large numbers of new transfer students, UCLA and UC Davis lead the nation among top-tier colleges. Six UC campuses rank in the top 15 (see indicator 14.7.1).
In June 2012, the UC Academic Senate approved a restructuring plan that helps clarify the transfer process for CCC students interested in UC and also improve their preparation for upper division coursework at UC. These changes lay the foundation for the Transfer Action Team’s recommendations, which the University has implemented and continues to build upon.
Key among these recommendations was the creation of the UC Transfer Pathways, which provide students with an outline of courses to take at a community college in order to be prepared for admission to one of the 21 most popular majors at any UC campus:1
| Anthropology |
Computer science |
Mechanical engineering |
| Biochemistry |
Economics |
Molecular biology |
| Biology |
Electrical engineering |
Philosophy |
| Business administration |
English |
Physics |
| Cell biology |
Film and media studies |
Political science |
| Chemistry |
History |
Psychology |
| Communication |
Mathematics |
Sociology |
1For more information on UC's Transfer Pathways, see http://admission.universityofcalifornia.edu/counselors/q-and-a/transfer-pathways/index.html#1. *Merced opened in 2005.
UC continues to work toward achieving its goal of a 2:1 ratio of California resident freshmen to transfer students.
1.1.5 New freshmen and transfer students, Universitywide, 2007–08 to 2015–16
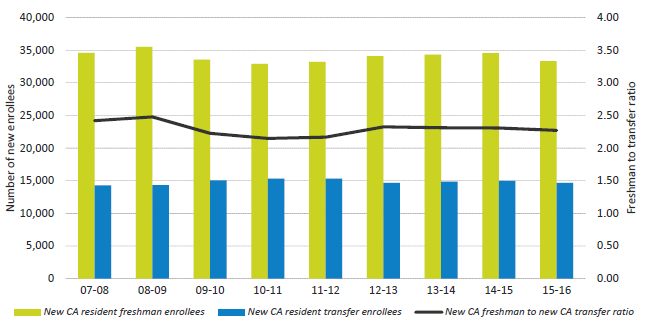
Source: UC Corporate Student System1
Campus detail for 2015-16
|
% New CA resident freshmen
|
% New CA resident transfers
|
Ratio of new CA freshmen to new CA transfers
|
| Berkeley |
68%
|
32%
|
2.15
|
| Davis |
62%
|
38%
|
1.63
|
| Irvine |
72%
|
28%
|
2.51
|
| Los Angeles |
62%
|
38%
|
1.61
|
| Merced |
93%
|
7%
|
14.00
|
| Riverside |
77%
|
23%
|
3.35
|
| San Diego |
63%
|
37%
|
1.74
|
| Santa Barbara |
75%
|
25%
|
2.95
|
| Santa Cruz |
74%
|
26%
|
2.86
|
| Universitywide, all campuses |
69%
|
31%
|
2.27
|
| Universitywide, excl. Merced |
69%
|
31%
|
2.22
|
The Master Plan calls for UC to accommodate all qualified California Community College (CCC) transfer students. It specifies that the University maintain at least a 60:40 ratio of upper-division (junior- and senior-level) to lower-division (freshman- and sophomore-level) students to ensure space for CCC transfers. Students transferring into the upper division from CCCs are crucial to maintaining this balance. To do so, UC aims to enroll one new CA resident CCC transfer student for each two new CA resident freshmen, or 67 percent new resident freshmen to 33 percent new resident CCC transfer students.
With the extension of the fall 2016 application deadline for transfer applicants and the anticipated enrollment of 5,000 additional California residents, UC aims to move even closer to the 2:1 ratio next year.
1 Enrollment numbers include applicants to fall, winter and spring terms.
UC enrolls a higher proportion of first-generation students than other very selective public and private universities.
1.2.1 First-generation undergraduate students, Universitywide and very selective public and private research universities, 1999–2000, 2003–04, 2007–08, and 2011–12
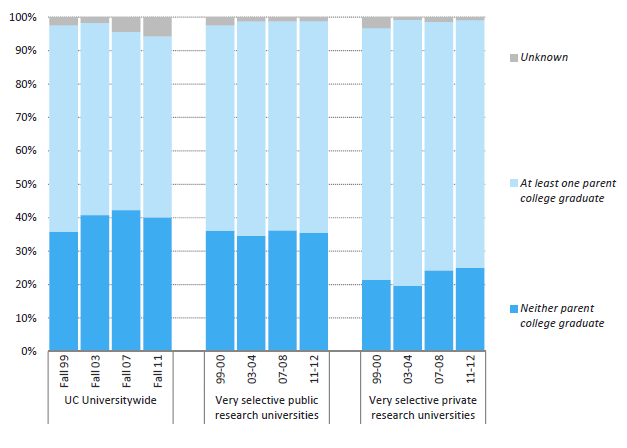
Source: NPSAS and UC Corporate Student System
A first-generation student is one whose parents do not hold four-year college degrees. Having one or both parents with a college degree can provide a student with additional tools for success in college, such as having college role models, a better understanding of college expectations, and possibly having financial means that ease transition from high school to college.
In 2011, around 40 percent of UC undergraduates came from first-generation families, compared to 36 percent for very selective public research universities and 25 percent for very selective private research universities.1
1 Selectivity as defined in IPEDS is based on two variables: 1) the centile distribution of the percentage of students who were admitted (of those who applied); and 2) the centile distribution of the midpoint between the 25th and 75th percentile SAT/ACT combined scores reported by each institution (ACT scores were converted into SAT equivalents). The institutions included here are in the most selective group.
UC's entering first-generation students are more likely to be from an underrepresented racial/ethnic group, to have a first language other than English, to enter as a transfer student and/or to have a lower income than students with at least one parent who graduated from college.
1.2.2 Entering students by first-generation status, race/ethnicity, first language spoken at home, Pell Grant receipt and entering level, Universitywide, Fall 2015
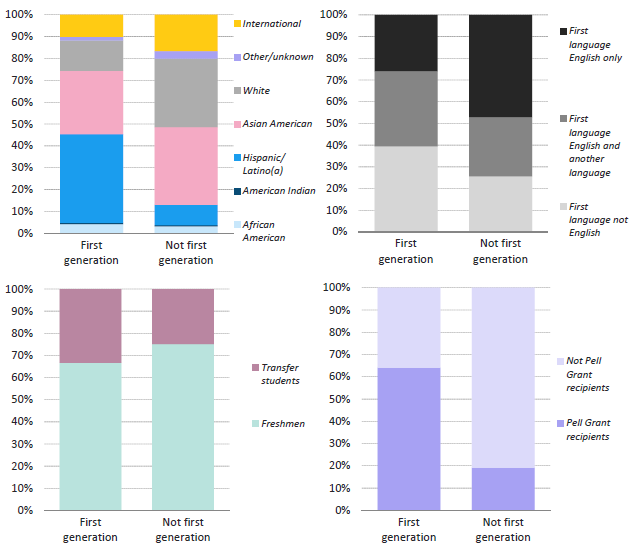
Source: UC Corporate Student System and UC Information Center Data Warehouse1
There are significant differences in the racial/ethnic and income profiles for students entering UC via the freshman or transfer paths.
1.2.3 Entering domestic undergraduates by race/ethnicity, Pell Grant status and entry level, Universitywide, Fall 2015
|
|
Freshmen
|
Transfers
|
All
|
Total n
|
| Pell Grant recipients |
URM |
18%
|
16%
|
17%
|
|
|
Asian/Pac Islander |
13%
|
15%
|
13%
|
|
|
White |
4%
|
13%
|
7%
|
|
| Pell Grant recipients total (includes unknown ethnicities) |
|
36%
|
46%
|
38%
|
n=22,503
|
|
|
|
|
|
|
| Non-Pell Grant |
URM |
10%
|
10%
|
10%
|
|
|
Asian/Pac Islander |
22%
|
12%
|
19%
|
|
|
White |
17%
|
17%
|
17%
|
|
| Non-Pell Grant total (includes unknown ethnicities) |
|
51%
|
39%
|
47%
|
n=27,759
|
|
|
|
|
|
|
| International |
|
14%
|
15%
|
14%
|
n=8,317
|
|
|
|
|
|
|
| All |
|
100.0%
|
100.0%
|
100.0%
|
|
|
|
n=41,571
|
n=17,008
|
|
n=58,579
|
Source: UC Information Center Data Warehouse
Underrepresented minority (URM) students, comprised of African American, Hispanic/Latino(a) and American Indian students, constitute a larger proportion of the incoming freshman class than of the entering transfer class for Pell Grant recipients. Among Asian/Pacific Islander students and white students, a higher share of Pell Grant recipients are found in the transfer class compared to the freshman class, while Asian/Pacific Islander students from non-Pell families are almost twice as prevalent in the freshman class as the transfer class.
The transfer route is used by students of all racial/ethnic and income groups.
The number of veterans and military students enrolling at UC is higher than it was a decade ago.
1.2.4 Enrolled undergraduates who are veterans or military students, by entry level, Universitywide, 2002-03 to 2015-16
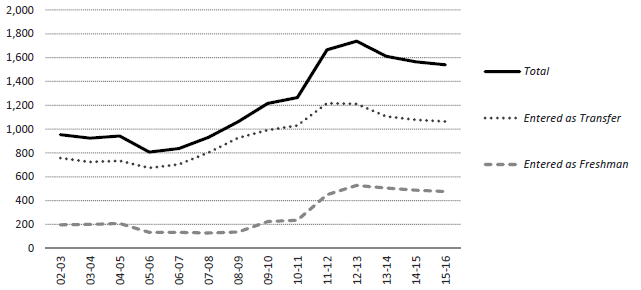
Source: UC Corporate Student System
UC’s veteran and military student population has grown in the last decade, peaking in 2012–13 and declining in the last three years. In 2015–16, UC enrolled more than 1,500 undergraduate students who have served in the United States Armed Forces, including veterans, those on active duty, reservists and members of the National Guard. These numbers do not include undergraduate Army Reserve Officers’ Training Corps (ROTC) participants, of which there were over 400 in 2015–16. Additionally, over 500 current graduate students have also served.
Over half of UC’s veterans and military students are enrolled at three campuses: San Diego, Davis and Irvine. Berkeley and Irvine have seen the most growth in veterans in recent years. While most veterans access UC through the California Community College system, the freshman pathway has expanded for veteran and military undergraduates. About 31 percent of undergraduate veterans enrolled in 2015–16 entered as freshmen, up from 21 percent in 2002–03.
1.2.5 Share of Universitywide undergraduate veteran and military student enrollment by campus, 2015-16
| San Diego |
18%
|
| Davis |
17%
|
| Irvine |
16%
|
| Berkeley |
14%
|
| Los Angeles |
12%
|
| Santa Barbara |
10%
|
| Riverside |
7%
|
| Santa Cruz |
5%
|
| Merced |
1%
|
| Total |
100%
|
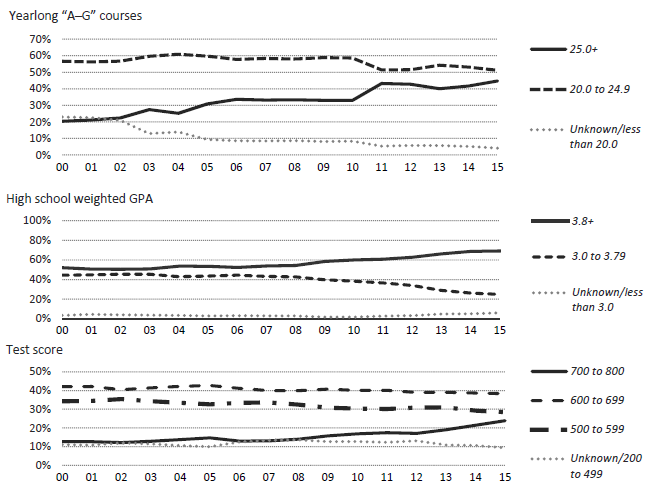
Freshmen entering UC are increasingly well-prepared.
1.3.1 A–G (college preparatory)1 courses; weighted, capped high school grade point average (GPA)2; and standardized test scores3 of entering freshmen, as share of class, Universitywide, Fall 2000 to fall 2015
Source: UC Corporate Student System (A-G courses and test score) and UC Information Center Data Warehouse (GPA)
The academic qualifications of UC applicants and admitted students continues to improve, as reflected by an increase in the number of college-preparatory course completed, higher achievement on standardized entrance exams (SAT/ACT) and rising high school GPAs. UC uses both weighted and unweighted GPAs to evaluate freshman applicants. A weighted GPA provides extra credit for succeeding in difficult courses, such as those in the College Board’s Advanced Placement programs. An A in such a course receives 5 points, a B 4 points and so forth. In other college preparatory courses, an A counts for 4 points, a B for 3 and so forth. For UC eligibility purposes, the weighted, capped GPA is used (shown above) and includes this extra credit for a maximum of eight semester-long courses.
1 A–G courses refer to those high school courses that UC has reviewed and approved as college preparatory.
2 Weighted, capped GPA means that students may receive a maximum of eight semesters of honors credit. More information is available
here.
3 Test scores are the highest of either SAT or ACT scores. ACT scores are converted to the 800 SAT scale. From 2000 to 2005, SAT scores are the average of SAT I Math and Verbal scores. From 2006 onward, SAT scores are the average of SAT math and critical reading scores.
Freshmen entering UC are increasingly well-prepared.
1.3.2 A–G (college preparatory)1 courses of entering freshmen by campus, as share of class, Fall 2000 to fall 2015
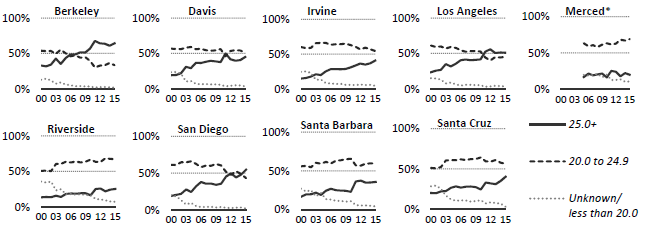
1.3.3 High school weighted, capped GPA of entering freshmen by campus, Fall 2000 to fall 2015
1.3.4 SAT reading and math scores, 25th to 75th percentile, UC campuses and comparison institutions
2, Fall 2014
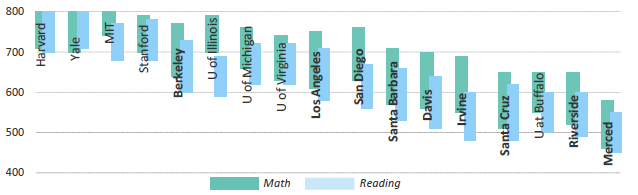
Source: IPEDS (SAT scores) and UC Information Center Data Warehouse (A–G courses and GPA)
1 A–G courses refer to those high school courses that UC has reviewed and approved as college preparatory. *Merced opened in 2005.
2 UC campuses and comparison institutions are sorted byt the sum of the 75th percentile math and reading scores.
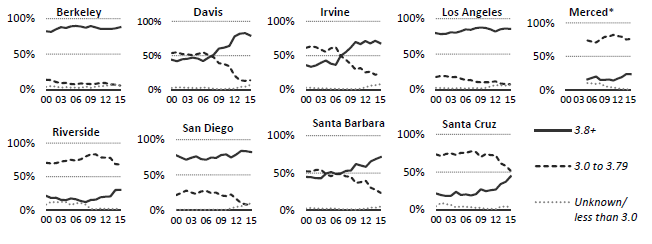
Like freshmen, UC transfer students in fall 2015 were better prepared academically than their counterparts a decade ago, as measured by their grades.
1.3.5 College grade point average (GPA)1 of entering transfer students, as share of class, Fall 2000 to 2015
Source: UC Information Center Data Warehouse
1 The transfer GPA is based on grades for college-level academic courses from the college(s) where students were previously enrolled. *Merced opened in 2005.
UC has a substantially lower proportion of out-of-state undergraduates than other AAU universities. In fall 2015, only 15.5 percent of UC's enrollees were out-of-state or international, compared with 27.9 percent for other AAU publics.
1.4.1 Residency of undergraduate students, Universitywide and comparison institutions, Fall 2015
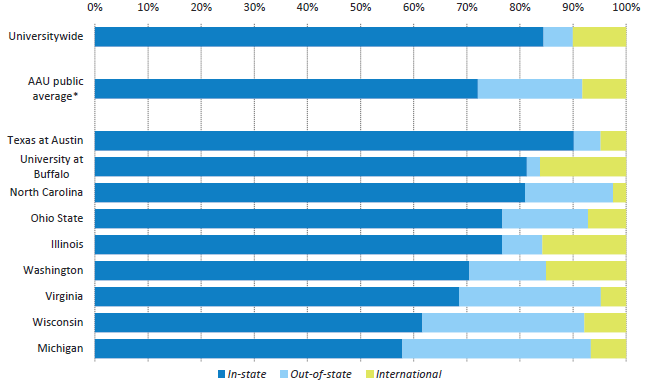
Source: UC Information Center Data Warehouse (UC numbers) and Common Data Set (comparator numbers). *AAU public average excludes UC.
UC’s priority is to enroll California residents. Campuses enroll nonresident students based on available physical and instructional capacity and the campus’s ability to attract qualified nonresident students.
Nonresidents provide geographic and cultural diversity to the student body. They also pay the full cost of their education. In 2015–16, tuition and fees at UC campuses for a nonresident undergraduate, including health insurance, ranged from $39,400 to $41,400, compared to $14,700 to $16,700 for California resident students.
Nonresident applicants must meet higher criteria to be considered for admission. The minimum high school GPA for nonresident freshmen is 3.4, compared to 3.0 for California freshmen. The minimum college GPA for nonresident transfer students is 2.8, compared to 2.4 for California residents.
For an even broader comparison of nonresident enrollment, UC’s 15.5 percent and the AAU public average of 27.9 percent are both much lower than the average at AAU private institutions (about 73 percent).1
1Data for AAU private institutions are for fall 2014 and come from the Common Data Set (CDS) for those who publish their data. A few institutions do not publish their CDS data; for Columbia University, Duke University, Emory University, the University of Chicago, and the University of Rochester, the National Center for Education Statistic's College Navigator tool was used instead of the CDS.
UC campuses attract students from their local regions and the major urban areas of California, with an overall local attendance rate of 32 percent.
1.4.2 Percentage of new CA resident freshman enrollees whose home is within a 50-mile radius of their campus, UC campuses, Fall 2015
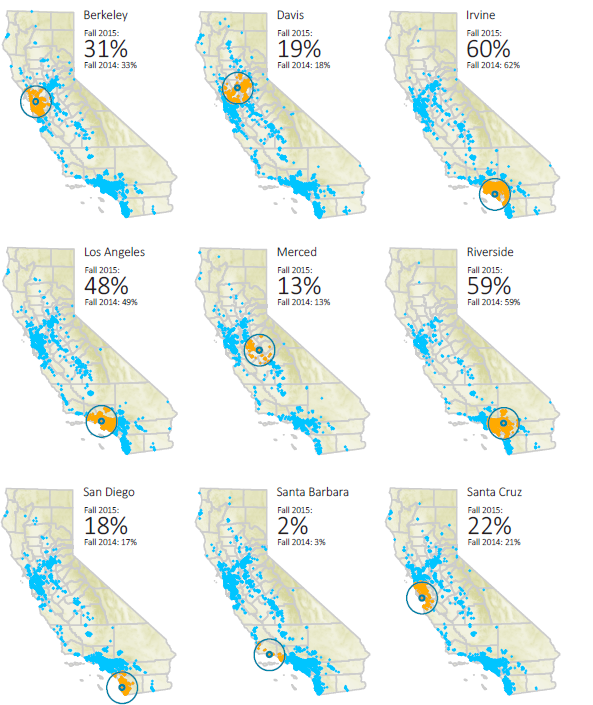
Source: UC Information Center Data Warehouse
While freshmen have a high local attendance rate, transfer enrollee rates are even higher, with 45 percent enrolling at a UC campus within 50 miles of their home.
1.4.3 Percentage of new CA resident transfer enrollees whose home is within a 50-mile radius of their campus, UC campuses, Fall 2015
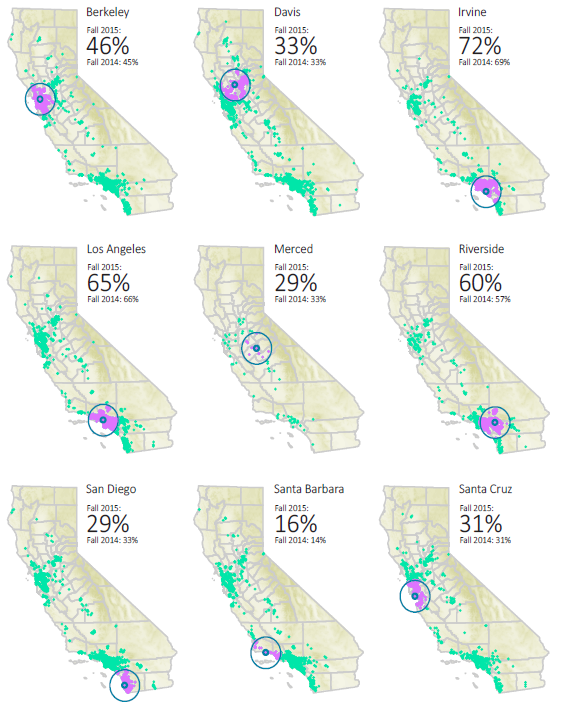
Source: UC Information Center Data Warehouse
The proportion of undergraduate students paying nonresident tuition is rising.
1.4.4 Percentage of full-time-equivalent undergraduate enrollees paying nonresident tuition, Universitywide, 1999–2000 to 2014–15
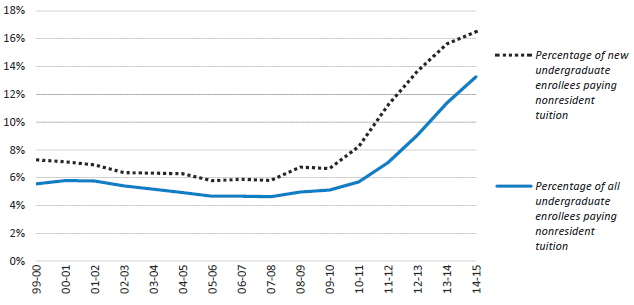
Source: UC Corporate Student System
The proportion of nonresident students at individual campuses varies depending on a campus’s capacity as well as its ability to attract nonresident students.1
With decreases in state support and flat undergraduate tuition, some UC campuses are leveraging increased revenue from nonresident tuition to support the provision or expansion of undergraduate courses or to expand financial aid for California residents.
1Not all nonresident students pay nonresident tuition. Some have statutory exemptions, such as AB540 students, children of UC employees and others designated by the state. AB540 students are considered California residents for tuition purposes as established by Assembly Bill 540, passed in 2001.
As a system, UC enrolls far fewer nonresidents than other public research universities.
1.4.5 State funding versus percentage of nonresidents, UC and comparison institutions, Fall 2013
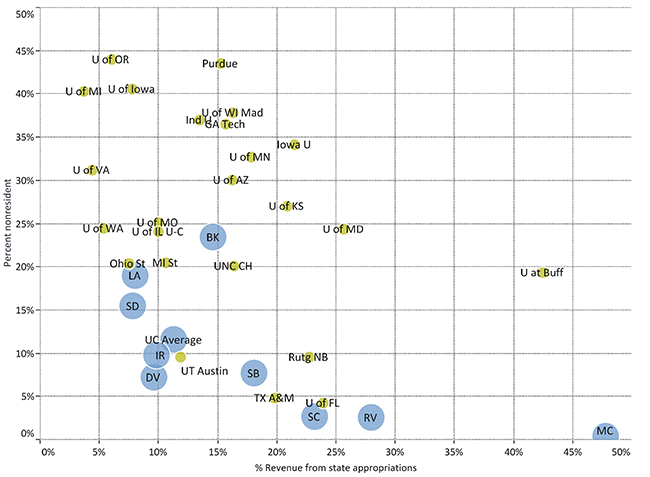
Source: State appropriations and total revenues (including operating and nonoperating revenues) are from IPEDS. AAU Public nonresident percentages are from Common Data Set. UC nonresident percentages are from the UC Information Center Data Warehouse and reflect nonresident tuition payers.
Even the UC campuses with the highest proportions of nonresidents are still below the average among public members of the AAU. There is an association between declining state funding and increasing nonresident enrollment, a clear trend seen across the nation.