Chapter 12:
University Finances and Private Giving
Background
The University of California seeks to develop reliable sources of revenues, including a significant investment from the state, and to use these revenues in a strategic manner to sustain its tripartite mission of teaching, research and public service.
This chapter summarizes the financial status of the University through the 2014–15 fiscal year. Revenue and expenditure data show changes in both the amounts generated (or expended) over time and their distribution across areas of activity. Trends in private support are also shown.
Funding trends
Totaling about $28.7 billion in 2014–15, the University’s revenues fund its core mission and a wide range of support activities, including academic medical centers, the Lawrence Berkeley National Laboratory, UC Extension, and housing and dining services.
Prior to 2010–11, state funding was the largest single source of support for the education function of the University. Over the past ten years, state educational appropriations have fallen more than $1 billion in inflation-adjusted dollars despite UC’s enrollment growth. State educational appropriations constituted only 10 percent of UC’s revenues in 2014–15 compared to 23 percent in 2001–02.
Tracking expenditures
To help mitigate declines in state funding, the University has sought to increase revenues from other sources, such as student tuition and fees, indirect cost recovery and private giving. The University also has moved aggressively to reduce operating costs and identify new sources of revenues. Chapter 13 identifies some of these cost savings. Even under the most optimistic assumptions, however, efficiency improvements and alternative revenue generation can offset only a portion of the budgetary needs projected over the next few years.
What this means for students and families
Although the actual, inflation-adjusted cost of educating a student at UC has dropped by 22 percent since 1990, the state’s share of expenditures has fallen even more steeply. As a result, students and their families bear a growing proportion of the cost of education. Increases in student fees have not made up for all of the reductions in state support, meaning that total per-student expenditures have fallen.
Looking forward
Improvements in the California economy, combined with the November 2012 passage of Proposition 30 by California voters, have brought some stability to the state budget and thus to the UC budget.
In addition, the University has made comprehensive changes in the way funds flow within the University. Historically, certain revenues were collected centrally by the UC Office of the President and redistributed across campuses. Following lengthy consultation with campus leadership, beginning in 2011–12, nearly all campus-generated funds — tuition and fees, research indirect cost recovery, and patent and investment income — have been retained by or returned to the source campus. The University has established a broad-based, flat assessment on campus funds to support the Office of the President and systemwide initiatives. These changes — referred to as the Funding Streams Initiative — have simplified budgetary planning, improved transparency and motivated campuses to maximize revenue.
In addition, by 2016–17, the University will complete an initiative known as “Rebenching,” which will ensure that state funds are distributed on an equal per-weighted-student basis across the campuses, ensuring that all students are supported equally by the state regardless of the campus they attend.
Even with the stabilization of support from the state, UC will face additional financial challenges in the years to come. The University has adopted a series of measures designed to preserve the long-term viability of its pension plan while still providing attractive post-employment benefits for employees. However, given that the population in the United States is aging and living longer, retiree health benefits costs are rising rapidly.
Similarly, as health care costs and insurance premiums continue to rise, UC will encounter mounting costs in providing subsidized health care coverage for its students, employees and retirees.
The Affordable Care Act is having a profound effect on the finances of UC medical centers. At the same time that larger numbers of individuals with coverage are requesting health care services, certain reimbursements for Medicaid patients have been reduced. These changes are affecting all of American society, and UC, as a major employer and provider of health care services in the state of California, is not exempt.
In addition, chronic shortfalls in priority areas of the budget – such as graduate student support, faculty salaries, the ratio of students to faculty, growing deferred maintenance backlogs and the need to update outdated information systems – are major issues that will present significant financial challenges for the University in the coming years.
For more information
Between 2001–02 and 2014–15, state educational appropriations decreased from 23 percent of UC revenues to 10 percent.
12.1.1 Revenues, by source, Universitywide, 2001–02 to 2014–15
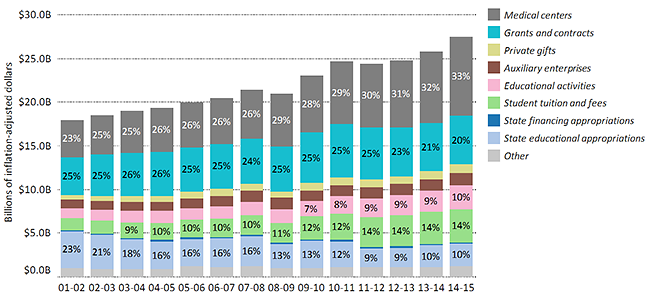
Source: UC Revenue and Expense Trend Report
The steep decline in state educational appropriations as a proportion of UC’s total revenues over the past decade is a function of two trends: first, a long-term decline in state support from $4.1 billion to $2.8 billion in inflation-adjusted dollars; second, an increase in revenues from other sources, such as medical centers, contracts and grants, and student tuition and fees.
State educational appropriations are for educational and other specific operating purposes, whereas state financing appropriations provide principal and interest payments for lease-purchase agreements. Educational activities are primarily medical professional fees.
Private gift funding shown in the chart above does not include gifts to UC foundations that are reported in the foundations’ audited financial statements and not in the UC-wide statements. Gifts to campus foundations represent about 55 percent of total private giving to UC.
12.1.2 Revenues, by source, UC campuses, 2014–15
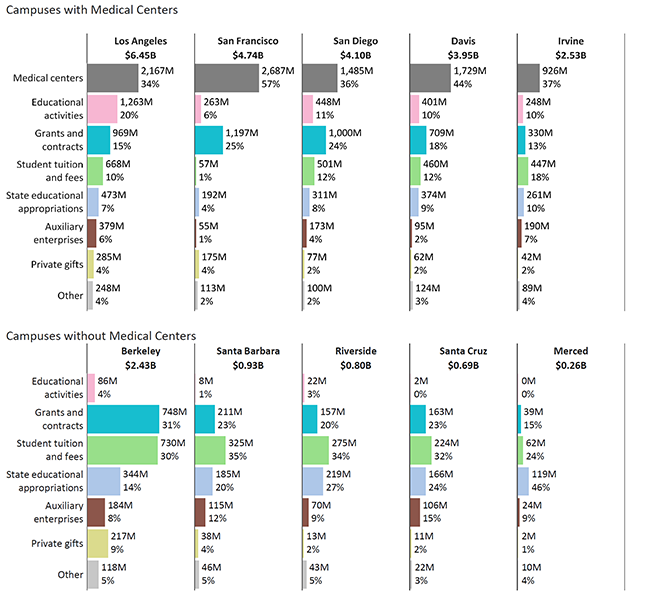
Source: UC Revenue and Expense Trend Report1
1Figures are in billions of inflation-adjusted 2014–15 dollars. The Davis, Irvine, Los Angeles, San Diego and San Francisco campuses operate medical schools and teaching hospitals. In addition to the funds associated with medical school and teaching hospital operations, these programs help campuses attract additional contract and grant revenue.
Virtually all gift funds (99 percent) are restricted by donors in how they may be used.
12.2.1 Current giving, by purpose, Universitywide, 2000–01 to 2014–15
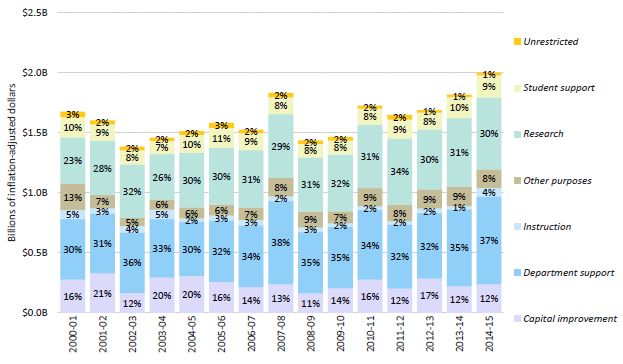
Source: UC Institutional Advancement. Figures are adjusted for inflation.
In 2014–15, new gifts to the University totaled about $2 billion. Virtually all of these funds are restricted for specific purposes and are not available to support general operating costs. In addition, approximately $480 million was designated for endowment, so only the income/payout is available for expenditure.
The University’s remarkable achievement in obtaining private funding in recent years — even during state and national economic downturns — is a testament to UC’s distinction as a leader among the nation’s public colleges and universities in generating philanthropic funds, and reflects the high regard in which the University is held by corporations, foundations, its alumni and other supporters.
The University is energetically pursuing increased philanthropic giving as a means to help address budget shortfalls and expand student financial aid.
Department support represents gifts in support of a specific department or academic division.
A campus’s ability to raise money is related to its age, number of alumni and presence of health science programs, which attract nearly half of all private support at UC.
12.2.2 Total giving, by type, UC campuses, 2004–05 to 2014–15
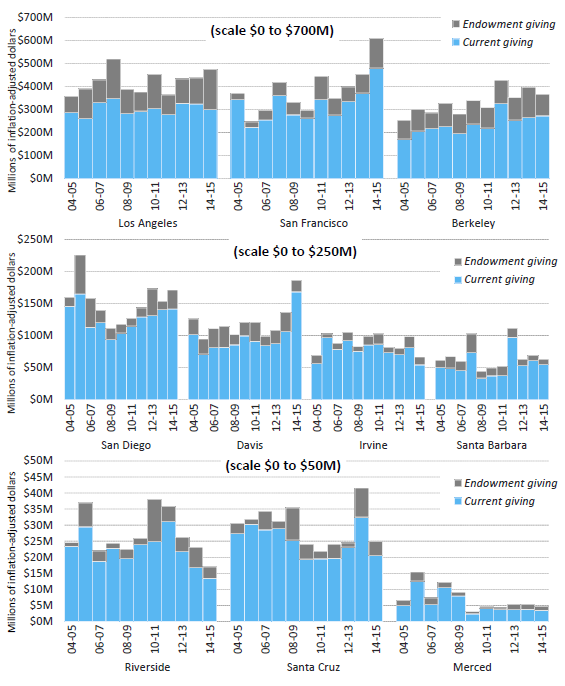
Source: Council on Aid to Education (CAE). Current giving includes all giving except for endowment giving.
The University’s share of the state’s general fund dropped from 8.1 percent in
1966–67 to 2.6 percent in 2015–16.
12.3.1 UC share of the state budget, 1966–67 to 2015–16
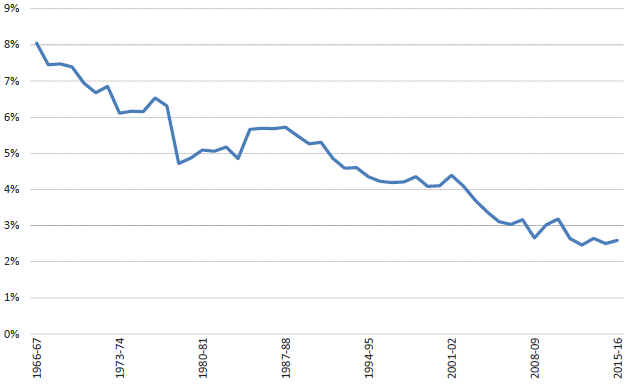
Source: UC Budget Office
Historically, state funding has been the largest single source of support for the University’s core instructional budget. Together with UC general funds1 and student fee revenue, state funding provides funding for faculty salaries and benefits, academic and administrative support, student services, facilities operation and maintenance, and student financial aid.
State support has fallen more than $1 billion in inflation-adjusted dollars since 1990–91. To compensate, the University has raised student tuition and fees, but these increases have only partially compensated for the loss of state support (see indicator 12.3.2).
During the recent fiscal crisis, campuses laid off employees, deferred faculty hiring, cut academic programs, eliminated courses, increased class size and cut back vital student services such as library hours in order to address major funding shortfalls. State support is slowly being restored, although it has not yet caught up to pre-recession levels.
1 UC general funds are composed mostly of nonresident tuition revenue and indirect cost recovery from research grants and contracts.
Tuition and fees have risen in response to cuts in state funds.
12.3.2 Revenues and student enrollment over time, Universitywide, 1990–91 to 2015–16
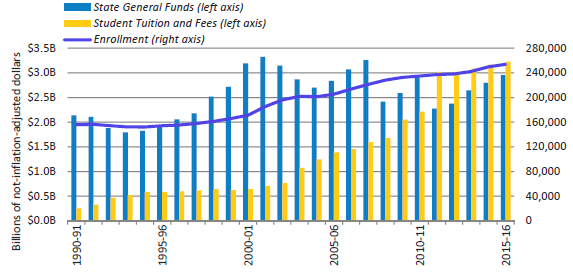
Source: UC Budget Office
Since 1990–91, student enrollment has increased by over 60 percent, primarily driven by the University’s continuing commitment to accommodate all eligible California resident undergraduates. State support has not kept pace with this growth, with revenue from student tuition and fees partially backfilling the loss of state general funds. However, tuition and fees have remained flat for five consecutive years and will remain so for 2016–17.
During the recession of the early 1990s, the University lost the equivalent of 20 percent of its state support. As the economy recovered, funding increased to provide for enrollment growth, to avoid fee increases and to maintain quality. Another fiscal crisis during the early 2000s resulted in reductions in state support during a time of rapid enrollment growth. Beginning in 2005–06, UC entered a six-year compact with the state. The state’s budget shortfalls and the onset of the most recent financial crisis led the state to renege on the compact and resulted in significant reductions in state support.
After partially restoring earlier cuts in 2010–11, the state reduced support to UC by $750 million in 2011–12. The University received $105.9 million in new state funding in 2012–13, including $89.1 million toward the state’s share of employer contributions to the University’s retirement plan.
In 2013–14, the University received $256.5 million in new state funding, including $125 million for a deferred tuition and fee buy-out for 2012–13. In 2014–15, the state provided a $142.2 million adjustment, equivalent to 5 percent of the base budget. In 2015–16, the state provided a 4 percent base budget adjustment, as well as $25 million in one-time funds for deferred maintenance. In addition, the state committed to providing $436 million over three years to help reduce the unfunded liability associated with the University’s retirement program, contingent on UC adopting a pensionable salary cap. The state also agreed to provide $25 million if the University took sufficient action to enroll an additional 5,000 California resident undergraduate students by 2016-17 compared to 2014-15.
Personnel costs consistently account for over 60 percent of the University’s total expenditures.
12.4.1 Expenditures, by function, Universitywide, 2001–02 to 2014–15
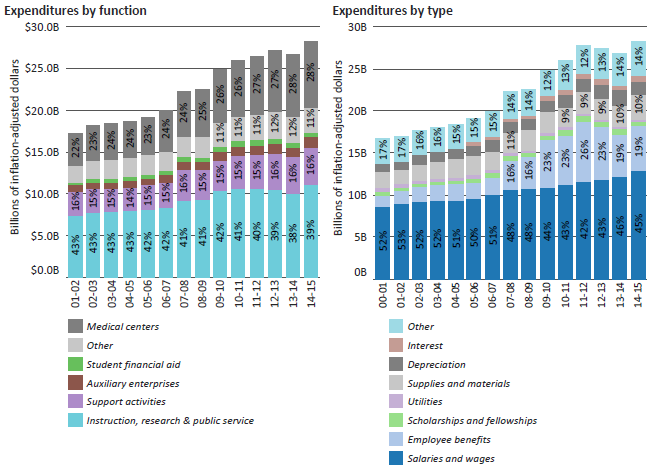
Source: UC Revenue and Expense Trends Report and UC Corporate Financial System
1
Instruction, research and public service accounted for 39 percent of total expenditures during 2014–15, and medical centers accounted for 28 percent. Libraries and other academic support services, such as instructional technology, student services, administration, and operation and maintenance of plant, accounted for 16 percent of total expenditures.
Higher education is a very labor-intensive enterprise. Personnel costs – salaries and wages, and employee benefits – consistently account for over 60 percent of the University’s total expenditures. The increase in employee benefit expenses is due to a resumption of contributions to UC’s retirement after a review of the retirement plan.
1 Inflation adjusted to 2014–15 dollars using CCPI-W. Medical centers refer to UC’s teaching hospitals; auxiliaries include student housing and dining, and parking garages; other expenses include interest, depreciation and other miscellaneous expenses. Support activities include student services, institutional support and academic support. Excludes Department of Energy laboratories, including the Lawrence Berkeley National Laboratory.
Total expenditures have increased by about 50 percent in the last decade, with medical centers representing an increasing share.
12.4.2 Expenditures, by function, UC campuses, 2014–15
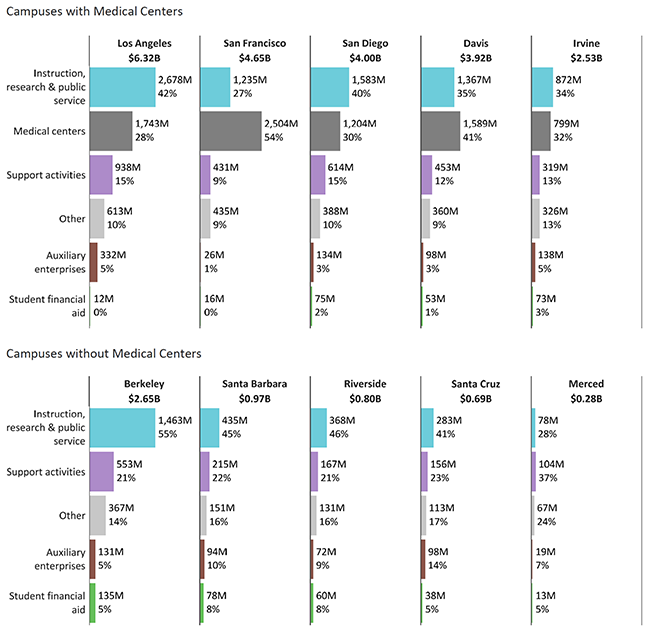
Source: UC Audited Financial Statements1
1Figures are in billions of inflation-adjusted 2014–15 dollars. The Davis, Irvine, Los Angeles, San Diego and San Francisco campuses operate medical schools and teaching hospitals. In addition to the funds associated with medical school and teaching hospital operations, these programs help campuses attract additional contract and grant revenue.
Since 1990–91, the total cost per student of a UC education has declined by 22 percent. However, students and their families have borne an ever-increasing share of that cost.
12.5.1 General campus per-student average expenditures for education, Universitywide, 1990–1991 to 2015–16, selected years
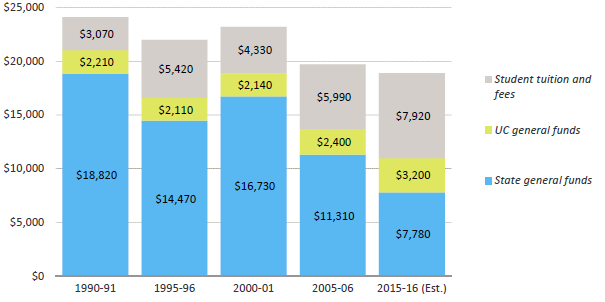
Source: UC Budget Office
Since 1990–91, average inflation-adjusted expenditures for educating UC students have declined 22 percent. During the same period, the state’s share of expenditures has fallen even more steeply, by 59 percent. The share of expenditures borne by students in the form of fees has more than tripled, from 13 percent to 42 percent.
In other words, students and their families are bearing a growing proportion of the cost of their education. Increases in student fees have made up some (but not all) of the reductions in state support.