Chapter 2:
Undergraduate Students — Affordability
Goals
The goal of the University’s undergraduate financial aid program is to ensure that the University remains accessible to all academically eligible students, regardless of their financial resources.
Affordability is among UC’s highest priorities. The University has maintained a strong record of enabling families from all income levels to finance a high‐quality education, and it closely monitors the impact of its pricing decisions and financial aid programs.
Maintaining access
The total cost of attendance and the composition of undergraduates in terms of parental financial resources set the framework for what is required to provide adequate financial support.
Focusing on in‐state students that live on campus, the total cost of attendance, which comprises tuition and fees and other expenses (e.g., living and personal expenses, books and supplies, transportation and health care), has remained relatively flat over the last several years at just over $33,000. This figure compares to about $26,000 on average at other AAU publics and around $63,000 for the AAU privates.
The income profile indicators demonstrate that the University remains accessible to students from all income groups, including low‐income students.
Since 2008–09, the proportion of UC undergraduates in the lowest income category increased from 13 percent to 18 percent of the total undergraduate student body, with an offsetting decline among upper‐ and upper‐middle‐income families. This may reflect, in part, a statewide decline in the incomes of middle‐income families due to the economic recession.
In fall 2015, 40 percent of all UC undergraduates qualified for Pell Grants, which are federal grants for low‐income students with family incomes typically under $50,000.
Financing a UC education
UC is able to provide access to students across the economic spectrum thanks to a progressive financial aid program that considers how much parents can afford; federal, state and University gift aid or grants; and a manageable student “self‐help” contribution from work and/or borrowing.
More gift aid is available to UC students than students at other AAU public institutions, which dramatically reduces the net cost of attendance for the neediest students and enables them to enroll in sizable numbers and proportions. The inflation adjusted net cost of attendance for students from families in the lowest income bracket (less than $54,000) has actually declined since 2004–05.
Federal and state governments provide critical support through the Pell Grant and Cal Grant programs. In addition, UC’s commitment to affordability is evident in the University’s strong systemwide financial aid program. This program helps cover fee costs through the Blue and Gold Opportunity Plan, which ensures that needy students with family incomes below $80,000 receive gift aid sufficient to cover both tuition and fees and non‐fee costs such as room, board and book expenses. As a result of this robust institutional financial aid program combining support from different sources, 57 percent of California resident
undergraduates paid no tuition in 2014–15.
Since 2013–14, undocumented California students who qualify for in‐state tuition and fees under AB 540 have been eligible for Cal Grants under the California Dream Act. Approximately 2,300 of these students received Cal Grants in 2014‐15, totaling $28.6 million. These students are also eligible for UC funded awards.
An undergraduate’s self‐help requirement can be met through a combination of work and loans. UC relies on student surveys — including the UC Undergraduate Experience Survey (UCUES) and Cost of Attendance Survey — to measure how much students work. UCUES data show that over 50 percent of undergraduates do not work. Studies indicate that 20 hours of work per week is the threshold at which undergraduate academic performance may be adversely affected. In the academic year 2013–14, the proportion of students working more than 20 hours per week increased to 10 percent, up from 7 percent two years earlier.
For the academic year 2014–15, about 41 percent of undergraduates relied on federal student loans to help finance their education, with loan amounts averaging $6,326. These figures are lower than the year before. Parental borrowing under the federal PLUS program remained at 6 percent; the average loan amounts remained about $16,000 per year.
Limiting cumulative debt
The proportion of undergraduates leaving with debt is lower than a decade ago. About 55 percent of the class of 2014–15 graduated with debt, with an average amount of $20,800. This translates into a monthly repayment amount of about $220 for 10 years at a 5 percent annual interest rate.
Comparison data show the 2013–14 cumulative debt for UC undergraduates was $20,500, compared to $25,900 for public 4‐year institutions and $29,700 for private nonprofit 4‐year institutions.
Looking forward
Recognizing the need for student loan access to place undocumented students on equal footing with their peers, the state enacted the Dream Loan Program (SB 1210) in 2014. Under this program, UC and CSU will use state General Fund appropriations matched with institutional resources to fund and administer loans to undocumented students. Taking effect in the 2015–16 academic year, this program will help to address one of the final financial barriers faced by undocumented California students in their pursuit of a baccalaureate degree at UC or CSU — their lack of eligibility to participate in federal student loan programs. Together with the AB 540 nonresident tuition exemption and eligibility for state and institutional grants established through the California Dream Act, the Dream Loan Program will help eligible undocumented students have borrowing opportunities similar to those enjoyed by their documented counterparts.
Veterans will also benefit from recently expanded financial aid options. The first is a nonresident tuition exemption, granted by Section 702 of the Veterans Access, Choice and Accountability Act of 2014. The second is a provision of the Post‐9/11 GI Bill that allows institutions and the Department of Veterans Affairs to partially or fully fund tuition and fee expenses that exceed the maximum amount previously covered by the GI Bill.
Students’ access to affordable housing and food is also a priority for the University. Food security is a global issue, and UC researchers and administrators are addressing the topic starting at the campus level with the intent to develop solutions for larger populations. President Napolitano and UC’s 10 chancellors launched the UC Global Food Initiative in July 2014, with the first phase including a survey of UC students to assess food security concerns and providing short‐term relief where needed. The results of this survey will be available in next year’s Accountability Report. As UC pilots longer‐term solutions, the objective is to expand successful programs to help other communities.
Given the high demand for housing across California, UC is also making efforts to keep housing accessible for students. In January 2016, President Napolitano announced a housing initiative aimed at supporting current students and future enrollment growth across the UC system. The two goals of the effort are to ensure that each UC campus has sufficient housing for its student population to keep housing affordable for UC students.
For more information
UC resident tuition and fees and total costs have remained relatively flat over the last several years, and while they still exceed the national average for AAU public institutions, they remain below the average for AAU private institutions.
2.1.1 Total cost of attendance for undergraduate in-state residents, Universitywide and comparison institutions, 2004–05 to 2014–15
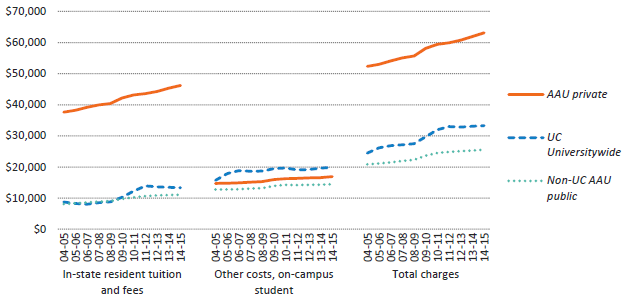
Source: IPEDS1
The total cost of attending college includes tuition and fees as well as living expenses, books and supplies, transportation, health insurance and personal expenses. The total cost of attendance is higher at UC than at AAU public comparison institutions partly because of the relatively high cost of living in California. After several years of increases, UC tuition and fees and total cost of attendance have remained relatively flat in the past few years.
1 Charges are for in‐state students living on campus. Averages are simple averages. Weighted averages for UC can be found here. A list of the 28 non‐UC AAU public and 26 AAU private institutions in the comparison groups can be found in the data glossary.
The net cost of attendance for students from families in the lowest income categories has actually declined since 2004-05, after accounting for inflation, while it has increased for students from middle- and high-income families.
2.1.2 Net cost of attendance by family income, Universitywide, 2002–03 to 2014–15
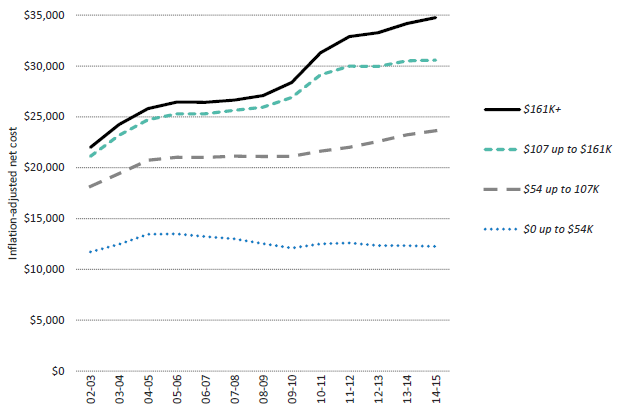
Source: UC Corporate Student System1
A general measure of the University’s affordability is its average net cost of attendance. This represents the actual cost of attending the University for undergraduates after taking into account scholarships and grants. Scholarships and grants reduce the net cost of attending UC for students at all income levels but have the greatest impact on students from low- and middle-income families. The availability of scholarships and grants has mitigated the impact of cost increases on students from families earning less than $100,000.
Between 2002–03 and 2014–15, the average increase in inflation-adjusted net cost for all UC undergraduate students, including independent students, was approximately $4,600. Inflation-adjusted increases ranged from $500 for low-income students to about $12,800 for high-income students.
1 Income ranges are approximate. Independent students are excluded. Net cost is the full cost of attendance less any grants, scholarships and fee exemptions. Income is based on amounts reported in either the Free Application for Federal Student Aid (FAFSA) or the UC Application for Undergraduate Admission or, if missing, is imputed based on demographic profiles.
UC's cost of attendance for nonresident students is among the highest of all public AAU institutions.
2.1.3 Total cost of attendance for nonresidents, Universitywide and comparison institutions, 2014–15
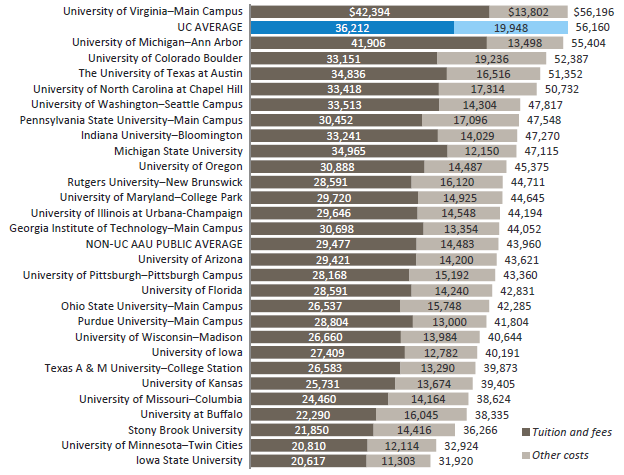
Source: IPEDS1
UC charges higher nonresident tuition than all but two nationally ranked public universities. Because of California’s higher cost of living, compared to other states, when all expenses are taken into account, UC ties with Virginia as the most expensive public university for nonresident undergraduates in the nation.
There is fierce competition among institutions for nonresidents who pay significantly higher fees than residents across the country. UC’s competitors, such as Michigan, regularly provide tuition discounts labeled as gift aid to nonresident students, which means they are paying less than the “sticker price” above. Legislative action in 2015 prohibited UC from providing similar discounts, putting UC at a disadvantage in the competition for nonresident students who do not have to pay the “sticker price” at peer institutions.
1 Averages are not weighted by student population. "Other costs" include living costs and books.
UC enrolls a higher percentage of Pell Grant recipients than any other top research university in the country.
2.2.1 Undergraduate Pell Grant recipients, UC and comparison institutions, 2013–14
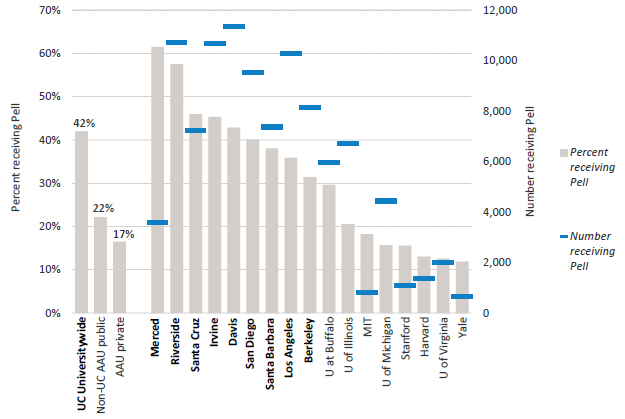
Source: IPEDS1
The percentage of undergraduate students with Pell Grants, a federal aid program for low-income students, provides a useful means to compare different institutions in terms of their accessibility for low-income students. It is also a useful indicator for comparing the socio-economic diversity of an institution’s undergraduate student population. The data shown above represent the most recent year that data on comparison institutions are available. The proportion of UC undergraduates receiving Pell Grants went up from 31 percent in 2008–09 to 42 percent in 2013–14. This is primarily a result of increased federal spending, which made more students eligible for Pell Grants, as well as the economic downturn, which caused broad declines in family income. In fall 2015, 40 percent of UC undergraduates were Pell recipients.
1 Percentage reported is that of students who received Pell Grants at any time during the 2013–14 year as a percentage of all undergraduates. Note that Pell Grant eligibility criteria change annually because of the federal appropriations process and other formula changes. Thus, trend analysis of Pell recipients would not be a valid measure of changes in low-income students but rather would reflect the changes in eligibility criteria. A list of the institutions in the AAU comparison groups can be found in the data glossary.
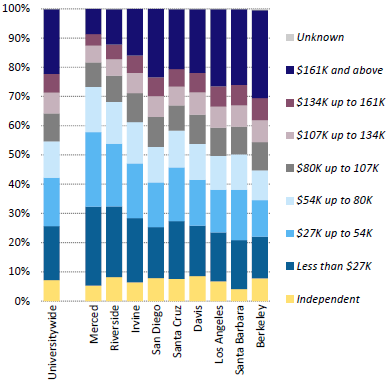
A large proportion of UC students come from low-income families, especially at UC’s newer campuses.
2.2.2 Undergraduate income distribution, Universitywide and UC campuses, 2014–15
2.2.3 Trends in the parent income of UC undergraduates, 2013 constant dollars, Universitywide, 2005–06 to 2014–15
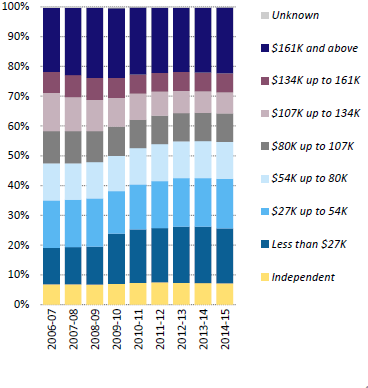
Source: UC Corporate Student System1
While all UC campuses enroll a significant proportion of low-income students, the proportion varies across the campuses.
The income distribution of UC undergraduates remained stable for many years despite increases in the University’s cost of attendance. This suggests that the University’s financial aid programs keep the University’s net cost of attendance within reach of low- and middle-income families, and that UC’s total cost of attendance remains affordable for others.
The chart above also shows the impact of the recent economic downturn on UC families: since 2008–09, the proportion of UC students in the lower income categories increased noticeably, with an offsetting decline among upper- and upper-middle-income families.
1 Note that prior to 2007–08, an increasing number of students at one campus with parent incomes above $100,000 were incorrectly categorized as having an income of $100,000. This problem was fixed in 2007–08, resulting in an apparent (but not actual) decline in the percentage of students shown in the $107,000 to $134,000 category and a corresponding increase in the percentage shown in higher income categories.
More gift aid is available to UC students than to students at other AAU public institutions.
2.3.1 Per capita gift aid for new freshmen, UC campuses and comparison institutions, 2013–14
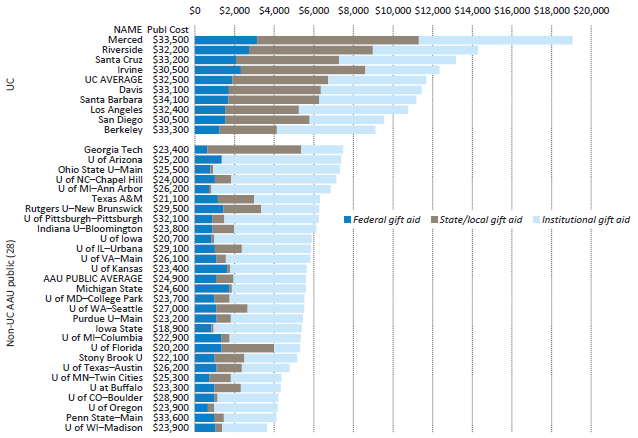
Source: IPEDS1
One remarkable aspect of UC’s financial aid awards is the high level of gift aid compared to other AAU public institutions. While federal Pell Grants are available to low-income students at any institution, UC students currently benefit from the combination of a strong state financial aid program (Cal Grants) and a strong UC aid program. AAU institutions in other states generally have either a strong state aid program or a strong institutional aid program, but not both.
Institutional gift aid is the largest source of grant and scholarship support for UC undergraduates. The primary source of institutional gift aid is the nearly one-third of all undergraduate tuition and fee revenues that UC sets aside for need-based financial aid. Although 90 percent of all gift aid received by UC students is based on need, nearly one in four UC undergraduates receives a merit-based scholarship. In 2014–15, the average merit-based scholarship was about $3,983, funded from a mix of federal, state, external private and institutional sources.
1 Figures include gift aid given to all full-time first-time students, while the data in indicator 2.3.2 shows gift aid only to very low-income students. Pell Grants are the main source of federal gift aid. For California students, Cal Grants are the main source of state gift aid. “Publ cost” in the column to the right of the institution names is the published cost for in-state students living on campus.
For very low-income students, the comparatively high cost of attendance at UC campuses is offset by the higher-than-average amounts of gift aid they receive. This enables UC to attract, support and graduate a sizable proportion of high-achieving students from low-income families.
2.3.2 Average gift aid, cost of attendance and net cost for very low-income students, UC campuses and public AAU institutions, 2013–14
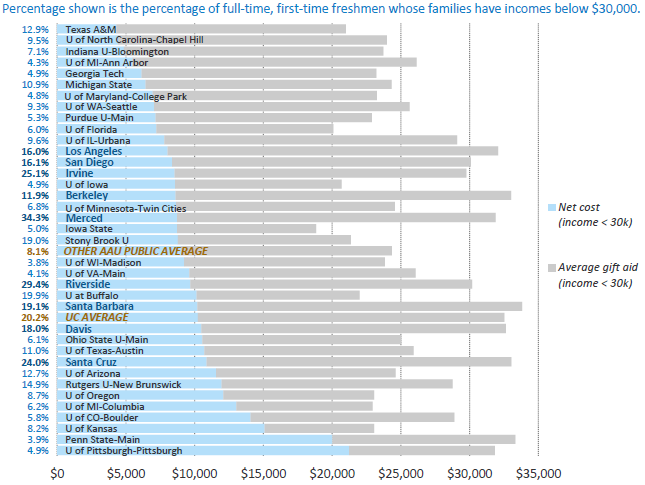
Source: IPEDS1
Despite a greater proportion of very-low-income students and higher total costs at UC, the net cost of UC for these students is comparable to that of other AAU public institutions.
UC’s net cost for very low‐income students is also comparable to other public institutions in California; the net cost for these students at six of UC’s nine undergraduate campuses is lower than at either a CSU or a CCC in the same region.2
1 Very low-income students shown here have family incomes below $30,000. Published Cost of Attendance = Tuition + Published Living Expenses. Living expenses vary depending on a student’s housing choices and on the housing market around a campus. This leads to the slightly different averages shown in this chart for the different UC campuses.
2 According to The Institute for College Access & Success (TICAS) map.
The proportion of undergraduates working more than 20 hours per week was less than 10 percent in 2013–14. A little over half of undergraduates did not work for pay.
2.4.1 Undergraduate hours of work, Universitywide and UC campuses, 2013–14
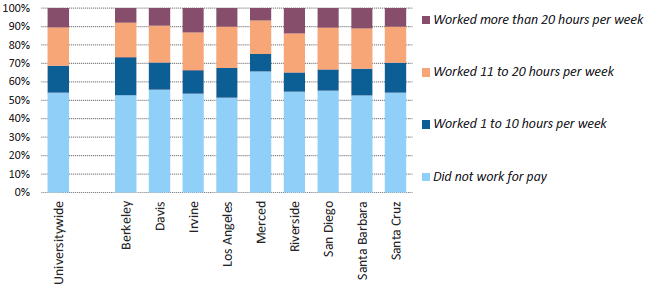
2.4.2 Graduation rates by hours worked in first year, Universitywide, 2009–10 entering freshmen and transfer students
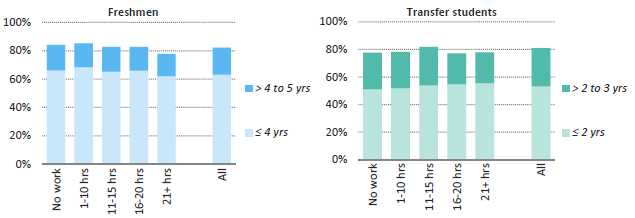
Source: UCUES and Corporate Student System
UC expects all students to help finance their education through a combination of work and borrowing. With respect to student work, the University’s goal is for students to work at a reasonable level that does not impede progress toward completion of the baccalaureate degree.
The above charts show that work in excess of 20 hours a week may affect progress to degree, though the difference is only apparent for freshmen.
The proportion of undergraduates who feel that the cost of their education is manageable has increased from two years ago.
2.5.1 Student response to “With grants and scholarships, if any, the total cost of attending the school is manageable,” Universitywide and comparison institutions, 2011–12 and 2013–14
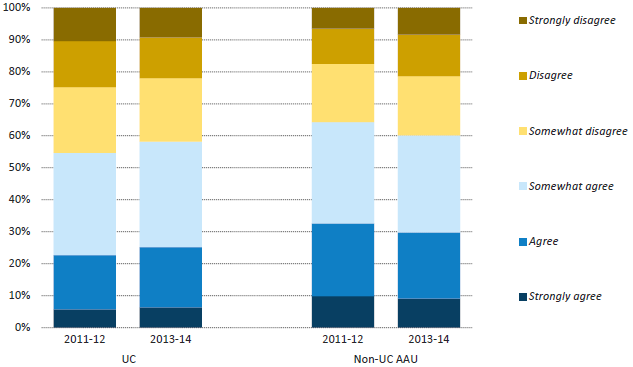
Source: UCUES and SERU1
Fifty-eight percent of UC undergraduates report feeling that the cost of attendance is manageable. This figure is up from 55 percent in the previous UCUES survey. Sixty percent of survey respondents at other AAU schools agree that the cost of their education is manageable.
Among non-UC AAU schools, a direct comparison between the 2011–12 survey and the 2013–14 survey should be viewed with caution, since the number of schools in the SERU consortium has grown.
1 SERU is the Student Experience in the Research University survey, which is administered at a number of AAU institutions. There were more non-UC AAU institutions schools included in the survey in 2013–14 compared with 2011–12. Non-UC schools included in 2011–12: U Minnesota, Rutgers U, U Pittsburgh, USC, Texas A&M U, and U Virginia. In 2013–14, additional schools included U Michigan, Indiana U, Purdue U, U Iowa and U Washington.
The average inflation-adjusted debt at graduation of student borrowers increased by 12.4 percent (from $18,500 to $20,800) over the past 15 years.
2.5.2 Student loan debt burden of graduating seniors, inflation-adjusted, Universitywide, 1999–2000 to 2014–15 (average debt of those with debt shown above each year)
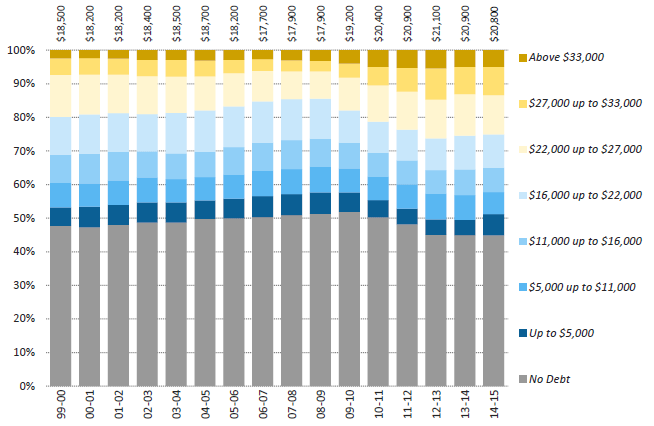
Source: UC Corporate Student System1
Forty-five percent of UC undergraduates graduate with no debt at all. For those who do borrow, the average student loan debt at graduation in 2014–15 was about $20,800. The monthly repayment for this amount is about $220 for 10 years at the 5 percent average interest rate that typically applies to student loans. Lower payments are available with longer repayment periods.
1 Figures adjusted for inflation in 2014 dollars using CA CPI-W. Borrowing shown here represents loans coordinated through the campus financial aid offices; some families also borrow from outside sources, which are not captured in this indicator. Independent students and students with unknown parent incomes are not shown, which accounts for the differences between this graph and the previous indicator. Data only includes graduates who originally entered as freshmen.
Despite recent increases, the proportion of students graduating with loan debt across all incomes was still lower in 2014–15 than it was 15 years ago.
2.5.3 Student loan debt burden of graduating seniors by parent income, Universitywide, 1999–2000 to 2014–15
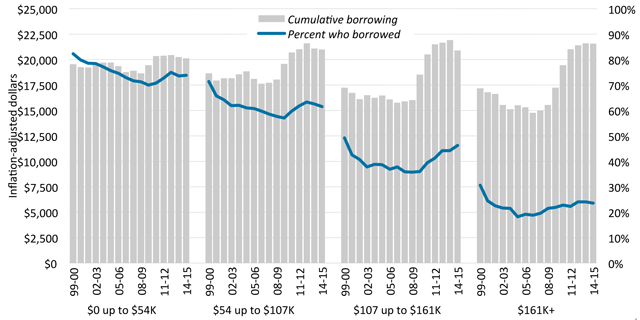
Source: UC Corporate Student System1
The proportion of students who borrow decreased steadily from 1999–00 through 2009–10 for students in nearly every income category. From 2010–11 through 2012–13, student borrowing increased, both in percentage and in cumulative amount. This uptick in borrowing may reflect a combination of higher costs and a reduction in other borrowing alternatives (e.g., home equity loans).
In the last two years, however, student borrowing remained the same or decreased slightly for the lowest two income categories and for the highest income category.
2.5.4 Average cumulative loan debt, UC and national comparison institutions, 2013–14 graduates
| Berkeley |
$17,580
|
| Davis |
$19,710
|
| Irvine |
$20,320
|
| Merced |
$20,410
|
| UC AVERAGE |
$20,530
|
| Los Angeles |
$20,760
|
| Santa Barbara |
$21,045
|
| Riverside |
$21,170
|
| San Diego |
$21,170
|
| Santa Cruz |
$22,580
|
|
|
| Public 4-year |
$27,200
|
| Private nonprofit 4-year |
$31,100
|
|
|
| National Average |
$28,950
|
Source: TICAS and Common Data Set. National average does not include private for-profit institutions.
1 Figures adjusted for inflation in 2014 dollars using CA CPI-W. Borrowing shown here represents loans coordinated through the campus financial aid offices; some families also borrow from outside sources, which are not captured in this indicator. Independent students and students with unknown parent incomes are not shown, which accounts for the differences between this graph and the previous indicator. Data only includes graduates who originally entered as freshmen.