Goals
The University of California is dedicated to fostering a university community that provides leadership for constructive participation in a diverse, multicultural world. The University has a long history of supporting initiatives that foster an inclusive living, learning and working environment.
The University’s diversity goals are established in Regents Policy 4440: University of California Diversity Statement, which states, in part:
Because the core mission of the University of California is to serve the interests of the State of California, it must seek to achieve diversity among its student bodies and among its employees.
The State of California has a compelling interest in making sure that people from all backgrounds perceive that access to the University is possible for talented students, staff, and faculty from all groups.
Therefore, the University of California renews its commitment to the full realization of its historic promise to recognize and nurture merit, talent, and achievement by supporting diversity and equal opportunity in its education, services, and administration, as well as research and creative activity.
The University particularly acknowledges the acute need to remove barriers to the recruitment, retention, and advancement of talented students, faculty, and staff from historically excluded populations who are currently underrepresented.
Summary of findings
UC is making progress in several key areas related to diversity and inclusion. These include:
- A growing number of Hispanic/Latino(a) undergraduates
- Increasing undergraduate graduation rates across all racial/ethnic groups
- Increasing proportions of female ladder-rank faculty across all discipline groups and a slight increase in the percentage of Hispanic/Latino(a) faculty
- Slow but steady progress in the percentage of underrepresented graduate academic students
- An increasingly diverse career staff workforce
At the same time, however, challenges include:
- Low enrollment of African American and American Indian undergraduate students
- Low proportion of female and underrepresented faculty compared to availability pools in most disciplines (presented in Chapter 5 of this report)
- Lower feelings of being respected reported by undergraduates of historically disadvantaged groups
- The graduation gap between underrepresented and White and Asian undergraduates (presented in Chapter 3 of this report)
Evaluating diversity
UC’s assessment of diversity can be evaluated a variety of ways: current demographic characteristics and trends of its students, faculty and staff; policies and activities that promote equity and inclusion; and survey data that reveal perceptions of campus climate and respect.
The indicators in this chapter present an overview of trends for incoming freshmen and transfer students, along with trends in graduate academic and professional programs. This information feeds into a broad overview of the University community — students, faculty and staff — by race/ethnicity and gender.
Trend data illustrate growing proportions of underrepresented and international students in the undergraduate population, more so for freshman than transfer entrants. Over the last 15 years, the proportion of Hispanic/Latino(a) undergraduates has grown tremendously, reflecting the growing number of Hispanic/Latino(a) students in California and improved high school graduation rates. Four UC campuses (Riverside, Santa Cruz, Merced and Santa Barbara) are designated by the federal government as Hispanic-Serving Institutions (HSIs). UC Davis and UC Irvine are also emerging HSIs.
Among graduate academic students, underrepresented populations show slow and steady increases across disciplines, with growth in international students generally limited to physical science and engineering. Female students constitute the majority in all disciplines except for physical science and engineering. Graduate professional programs show similar growth patterns for underrepresented and international students, with variation by discipline. Education programs have a larger proportion of underrepresented students, and business and other professional programs have growing international populations. The proportion of female students is trending slightly downward but remains around 50 percent or higher for all disciplines except business.
For staff, the proportions of nonwhites and females in Managers and Senior Professional (MSP) and Senior Management Group (SMG) positions are smaller than their proportions in Professional & Support Staff (PSS) positions. The proportion of females among ladder-rank faculty is lower than proportions among other academic employee groupings.
Surveying students about diversity on campus
This chapter presents responses to the UC Undergraduate Experience Survey (UCUES), given every two years to all undergraduates. The University’s goal is to ensure that all students are respected on campus, regardless of race/ethnicity, religious affiliation, gender, sexual orientation or political beliefs.
UCUES data show most undergraduates feel students of their race/ethnicity are respected on campus, but the proportion of African American respondents sharing this perspective is lower than other groups. Among religious groups, Muslim students are less likely to feel respected. LGBQ students also are less likely to feel respected. Along the political spectrum, students identifying as having conservative political beliefs are less likely to feel respected.
Diversity indicators elsewhere in this report
Indicators for graduation rates for entering freshmen and entering undergraduate transfers by race/ethnicity are presented in Chapter 3 — Undergraduate Student Success.
Indicators for new faculty hiring compared to national availability pools for underrepresented groups and women are presented in Chapter 5 — Faculty and Other Academic Employees.
Looking forward—diversity initiatives
UC devotes considerable resources to developmental outreach, which involves extensive academic and college preparation support for more than 100,000 K-12 and community college students. Of the high schools served by UC’s systemwide programs, 70 percent are among the lowest-performing schools in the state. Program participants have higher rates of enrollment in the California public college segments and participants who are accepted to UC enroll at higher rates than do their peers, with 61 percent of UC academic preparation participants completing all courses required for UC and/or CSU eligibility in comparison to an average of 30 percent of their peers who did not participate (based on an average eligibility rate for the past five years, 2009 to 2014). In 2013, the enrollee yield of Hispanic/Latino(a) program participants — the ratio of students admitted to UC who actually enroll — for all participants in UC academic preparation programs is higher (64 percent vs. 59 percent) than the enrollee yield for all California high school graduates who are admitted and enroll. African American students who participated in a UC college preparation program were also more likely to enroll at a UC campus than were their peers who did not participate (55 percent compared to 52 percent).
The UC-HBCU Initiative improves diversity and strengthens graduate programs by investing in relationships between UC campuses and Historically Black Colleges and Universities (HBCUs). Since its inaugural year (2012), more than 230 HBCU scholars have participated in the program, which offers faculty-led summer research opportunities and year-round mentoring. More than a third of summer research interns have chosen to apply to UC for graduate education, and 20 Ph.D. and four master’s degree students have enrolled at UC as a direct result of the program. The current yield rate for UC of UC-HBCU participants who apply to and are admitted to a UC graduate program is 89 percent.
The University has increased its investment in programs that support new scholars in all fields whose teaching, research and service will contribute to diversity. Since its inception in 1984, more than 180 former President’s Postdoctoral Fellows have received UC tenure-track appointments. And of those Fellows appointed to the UC faculty since 1995, 99 percent of those reviewed for tenure have received tenure. In early 2014, President Napolitano committed $5 million in one-time funds to support its goals. Funds were distributed in three areas: 1) hiring incentive start-up packages; 2) salaries for additional faculty hires; and 3) resources for training, mentoring and development. With the number of applicants (now over 650 per year) and fellows (15–20 appointed annually) rising in the last three years, the additional funds from President Napolitano’s initiative will support even more departments that recruit PPFP fellows into faculty positions at UC.
For more information
At the time that this report was being finalized (June 2016), there were 17 products in the UC Information Center on diversity topics. Here are links to key products in each area:
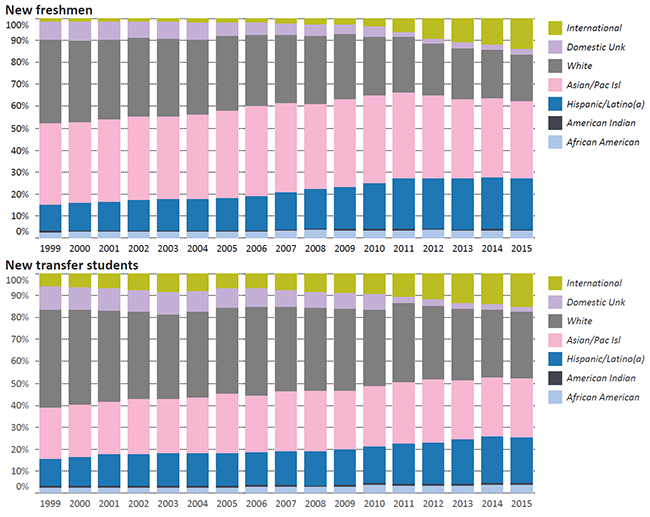
Each year, UC enrolls a growing number of undergraduates from underrepresented groups (African American, American Indian or Hispanic/Latino(a)); entering freshmen are somewhat more likely to be from an underrepresented group than entering transfer students.
7.1.1 Racial/ethnic distribution of new undergraduates, Universitywide, Fall 1999 to fall 2015
Source: UC Information Center Data Warehouse
A number of factors may help explain why entering freshmen are somewhat more diverse than entering transfer students. Among the population of high school graduates sufficiently prepared to qualify for UC, white students are more likely to be from high-income families and to choose private and out-of-state colleges, while Asian American and Hispanic/Latino(a) students are more likely to choose UC. Part of the Transfer Action Team (discussed at more length in Chapter 1) initiative’s charge is to look for opportunities to expand outreach to California community colleges with greater diversity of transfer-eligible students who currently do not apply to UC.
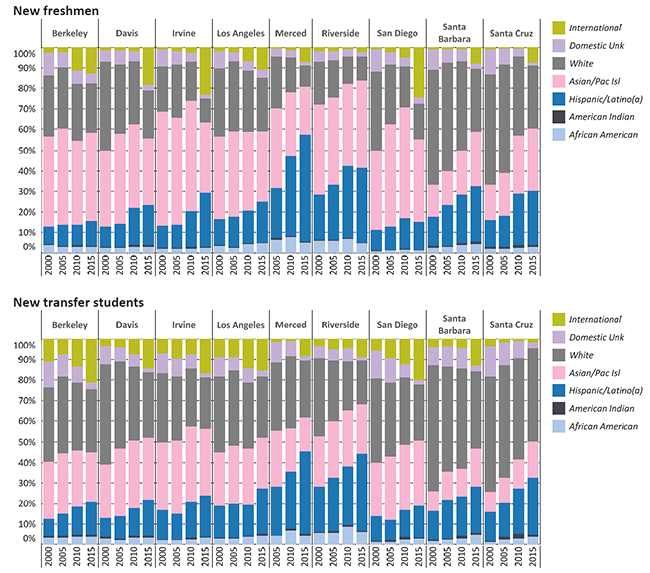
As shown, campuses vary in their racial/ethnic diversity.
7.1.2 Racial/ethnic distribution of new undergraduates, UC campuses, Fall 2000 to fall 2015 (selected years)
Source: UC Information Center Data Warehouse
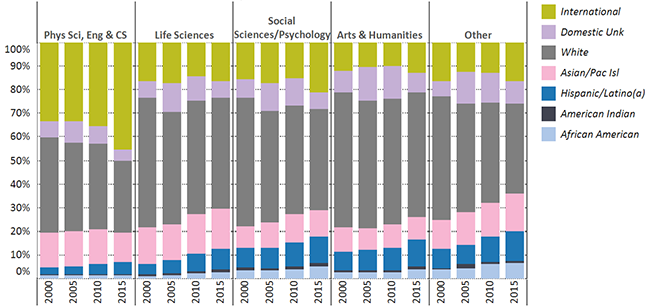
UC is making slow but steady progress in diversifying the racial/ethnic makeup of its graduate academic students.
7.2.1 Racial/ethnic distribution of graduate academic students, by discipline, Universitywide, Fall 2000 to fall 2015 (selected years)
Source: UC Information Center Data Warehouse1
Enrollment of underrepresented racial/ethnic groups (African American, American Indian and Hispanic/ Latino(a)) in UC’s graduate academic programs has grown over the past decade. In 2013–14, UC awarded academic doctoral degrees to underrepresented racial/ethnic groups in higher proportion than did its peers, except in the social sciences.
Proportion of underrepresented racial/ethnic groups receiving academic doctoral degrees
| 2013–14 |
UC
|
Other AAU
Public
|
AAU
Private
|
| Social Sciences |
11%
|
11%
|
8%
|
| Arts & Humanities |
11%
|
7%
|
8%
|
| Life Sciences |
9%
|
6%
|
8%
|
| Physical Sciences |
8%
|
3%
|
3%
|
| Engineering & CS |
5%
|
5%
|
4%
|
Source: IPEDS
UC’s graduate programs draw students from across the nation and around the world, including its own undergraduate students, who make up about a tenth of UC’s graduate students. As a consequence, UC’s efforts to diversify its undergraduate students can also help to diversify its graduate academic population.
Because recent Ph.D.s constitute the pool for new faculty, a critical means for increasing the diversity of the faculty is to increase the diversity of the pool of doctoral degree recipients.
1 “Other” disciplines represent about 12 percent of degrees awarded and include interdisciplinary areas (3 percent), academic degrees in professional fields such as a Ph.D. in education (4 percent) or health sciences (3 percent) and miscellaneous areas such as criminology.
Overall, 42 percent of UC’s graduate academic students are women, compared with 53 percent of its undergraduates.
7.2.2 Gender distribution of graduate academic students, by discipline, Universitywide, Fall 2000 to fall 2015 (selected years)
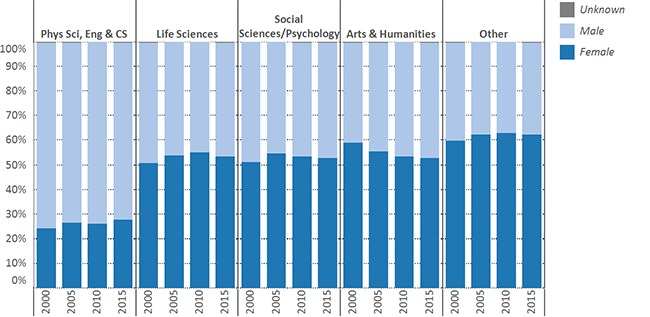
Source: UC Information Center Data Warehouse1
The proportion of graduate academic students who are women varies by discipline. Half or more of the graduate academic students in the life sciences, social sciences and humanities are women, compared with about one-quarter in the physical sciences, engineering and computer science.
Overall, the proportion of degree recipients who are women by broad discipline group is comparable to UC’s AAU peers.
Proportion of women receiving academic doctoral degrees, 2013–14
| |
UC
|
Other AAU Public
|
AAU Private
|
| Social sciences |
54%
|
58%
|
52%
|
| Arts & Humanities |
54%
|
53%
|
51%
|
| Life sciences |
51%
|
51%
|
53%
|
| Physical sciences |
30%
|
30%
|
30%
|
| Engineering & CS |
22%
|
21%
|
25%
|
Source: IPEDS
1 “Other” disciplines include interdisciplinary areas, miscellaneous fields such as criminology and academic degrees in professional fields such as a Ph.D. in business or law.
The proportion of students from underrepresented racial/ethnic groups enrolled in UC’s professional degree programs varies widely — lowest in business and highest in education.
7.2.3 Racial/ethnic distribution of graduate professional degree students, by discipline, Universitywide, Fall 2000 to fall 2015(selected years)
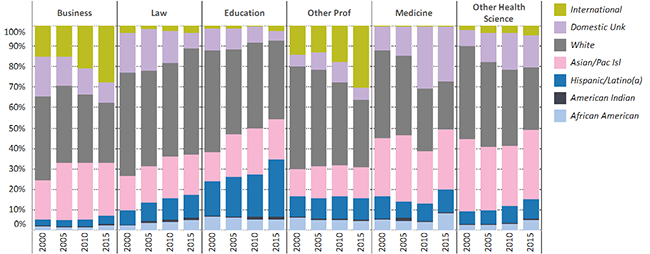
Source: UC Information Center Data Warehouse1
UC awards a greater share of its education, medicine and other health science professional degrees to students from underrepresented race/ethnic groups compared with its AAU peers, but a smaller share of its business degrees.
Proportion of underrepresented students receiving professional degrees, 2013–14
| |
UC
|
Other AAU Public
|
AAU Private
|
| Education |
25%
|
12%
|
17%
|
| Medicine |
17%
|
10%
|
13%
|
| Other health sci |
16%
|
11%
|
11%
|
| Law |
13%
|
13%
|
14%
|
| Business |
6%
|
8%
|
7%
|
Source: IPEDS
1 “Other health sci” includes dentistry, nursing, optometry, pharmacy, public health and veterinary medicine; “Other prof” includes programs such as architecture, library and information science, public policy and social welfare, and other small programs. Medical residents are not included.
The proportion of women enrolled in UC’s professional degree programs varies widely and is trending somewhat downward in nearly all fields.
7.2.4 Gender distribution of graduate professional degree students, by discipline, Universitywide, Fall 2000to fall 2015 (selected years)
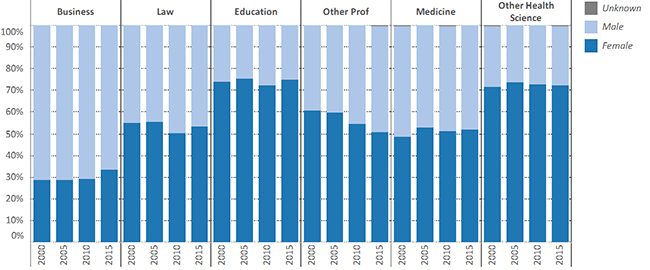
Source: UC Information Center Data Warehouse1
The proportion of women enrolled in UC’s professional degree programs has trended slightly downward in all discipline areas except for business.
As shown in the table, UC graduated roughly the same proportion of women in professional degree programs as the comparison AAU peers — somewhat higher in law and nonmedical health sciences and somewhat lower in business.
Proportion of women receiving professional degrees, 2013–14
| |
UC
|
Other AAU Public
|
AAU Private
|
| Education |
73%
|
74%
|
7574
|
| Medicine |
51%
|
47%
|
50%
|
| Other health sci |
72%
|
71%
|
73%
|
| Law |
50%
|
44%
|
45%
|
| Business |
34%
|
38%
|
35%
|
Source: IPEDS
1 “Other health science” includes dentistry, nursing, optometry, pharmacy, public health and veterinary medicine; “Other prof” includes programs such as architecture, library and information science, public policy and social welfare, and other small programs. Medical residents are not included.
Undergraduates have the highest proportion of underrepresented students. Graduate professional and academic populations have comparable representation of underrepresented groups but vary in their share of international students.
7.3.1 Racial/ethnic distribution of students, Universitywide and by campus, Fall 2015
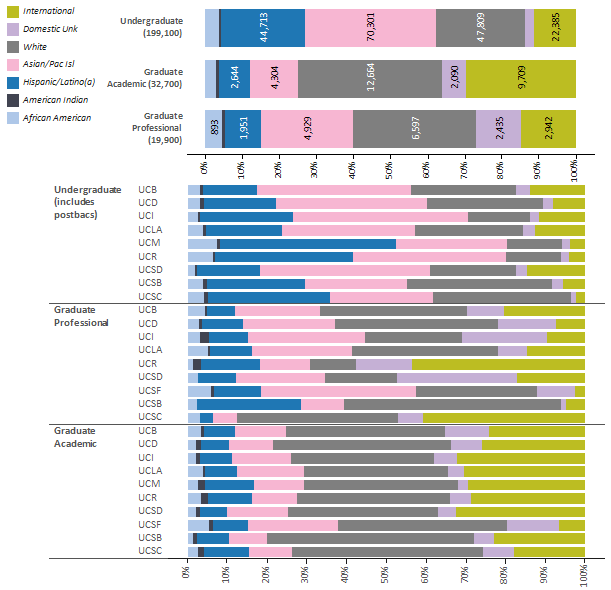
UC Merced does not have any graduate professional programs at this time. Undergraduates include approximately 300 postbaccalaureate teaching credential students.
UC systemwide data shows that about a quarter of undergraduate students are from underrepresented groups. About 12 percent of graduate academic and 15 percent of graduate professional students are from underrepresented groups.
Campuses vary in the share of international students, who represent 30 percent of graduate academic and 15 percent of graduate professional students.
The proportion of nonwhite staff is lower among more senior positions, and the proportion of nonwhite academics is highest among nonfaculty academics.
7.3.2 Racial/ethnic distribution of staff, faculty and academic employees, Universitywide, Fall 2015
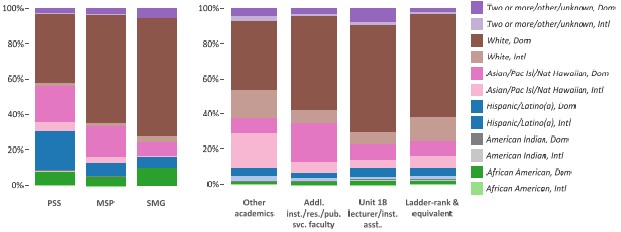
Source: UC Corporate Personnel System and UC Information Warehouse Data Center1
UC values cultivating a work and learning environment inclusive of all communities. The University seeks to improve representation of domestic racial/ethnic groups that have been historically underrepresented. As shown below, UC is especially challenged by low representation of these groups in senior staff (MSP and SMG), academic and faculty positions.
International employees contribute to the diversity of the UC workforce. These employees bring educational backgrounds and experiences that differ from those of domestic employees. As shown below, the highest proportion of international academics is in the nonfaculty academics category, primarily due to high numbers of international postdoctoral scholars.
1 International status for faculty and staff is based on citizenship status instead of IRS tax status, which was used in the 2012 Accountability Report. The “Other Faculty” group includes professors in residence, professors-clinical and health science clinical faculty. The “Non-Faculty Acad” group includes only nonstudent employees and comprises many positions (e.g. librarians and administration categories) as well as academic researchers. Students are excluded in all groups.
| |
Domestic |
|
International |
|
Black/African American,
American Indian, or
Hispanic/Latino(a) |
Asian,
Pac Isl, or
Nat Hawaiian |
|
All races/ ethnicities |
| PSS (Professional and Support Staff) |
26.9% |
20.0% |
|
11.6% |
| MSP (Managers and Senior Professionals) |
12.5% |
16.9% |
|
6.3% |
| SMG (Senior Management Group) |
16.4% |
7.6% |
|
4.1% |
| |
|
|
|
|
| Other academics |
6.0% |
8.2% |
|
42.34% |
| Addl. inst./res./pub. svc. faculty |
6.0% |
21.9% |
|
15.17% |
| Unit 18 lecturer/inst. asst. |
8.3% |
9.1% |
|
13.92% |
| Ladder-rank & equivalent |
7.2% |
8.9% |
|
23.33% |
All percentages use the total (both domestic and international) as the denominator.
7.3.3 Racial/ethnic distribution of staff, faculty and academic employees, By location, Fall 2015
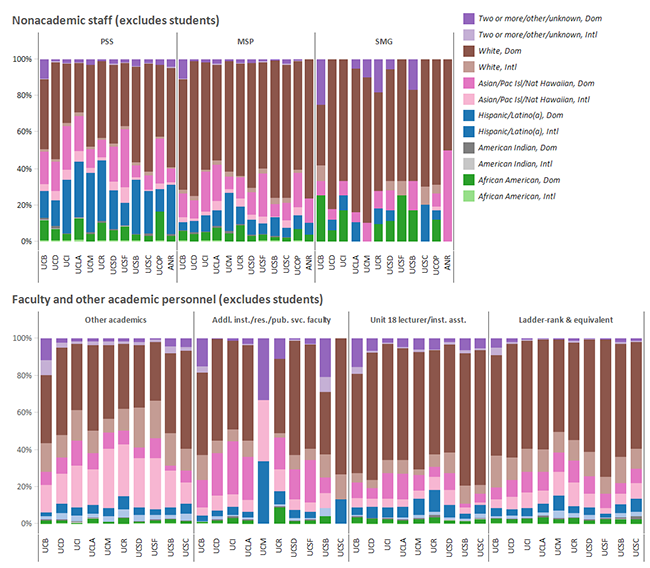
Source: UC Corporate Personnel System and UC Information Warehouse Data Center. Note: ANR stands for Agriculture and Natural Resources. UCOP is UC Office of the President.
Women constitute more than 40 percent of all student, staff and academic employee groups, except for ladder-rank faculty and senior managers.
7.3.4 Gender distribution of the University community, Universitywide and by location; Fall 2015
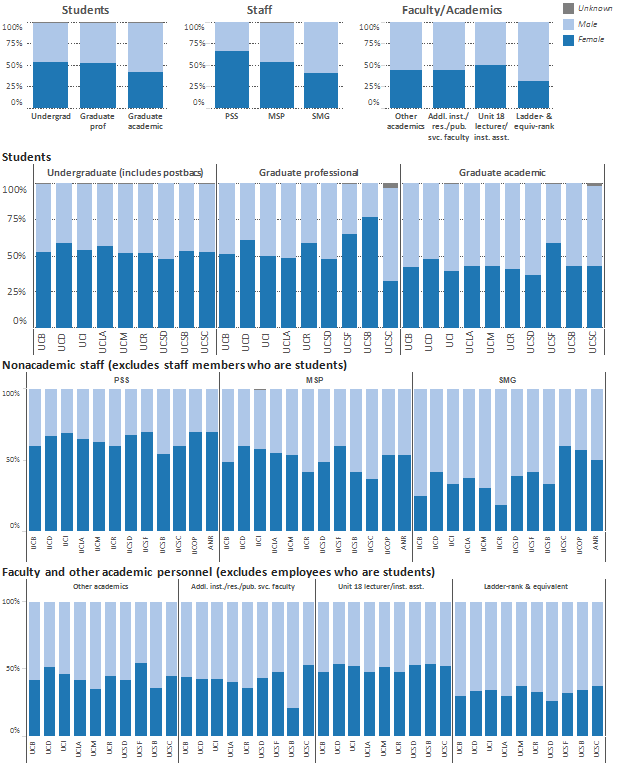
Source: UC Corporate Personnel System and UC Information Warehouse Data Center. Note: ANR stands for Agriculture and Natural Resources. UCOP is UC Office of the President.
Surveys show that most undergraduates feel that students of their same race/ethnicity are respected on campus, but the proportion of African Americans who report feeling respected is lower than other groups.
7.4.1 Response to “Students of my race/ethnicity are respected on this campus,” Universitywide and UC campuses, Spring 2008, 2010, 2012 and 2014
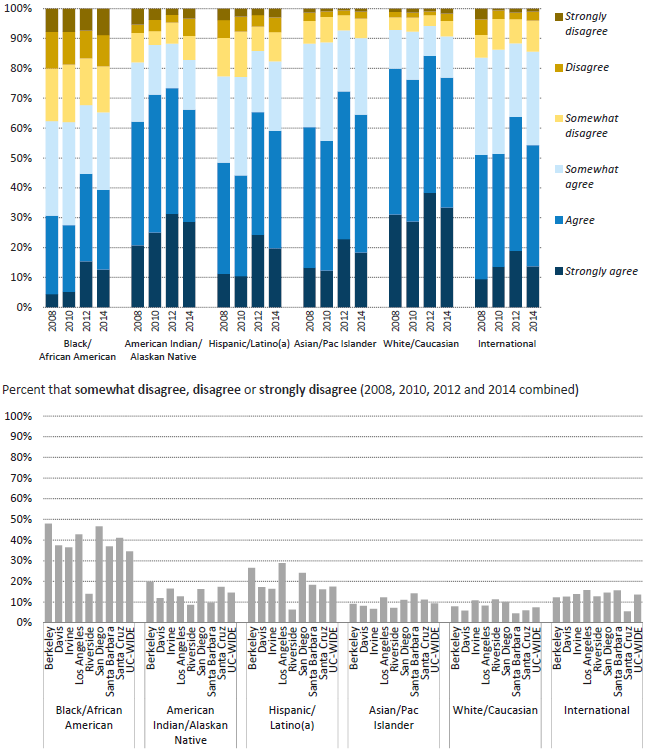
Source: UCUES
7.4 UNDERGRADUATE CAMPUS CLIMATE
More than 70 percent of students from major religious groups feel that students of their religions are respected.
7.4.2 Response to “Students of my religion are respected on this campus,” Universitywide and UC campuses, Spring 2008, 2010, 2012 and 2014
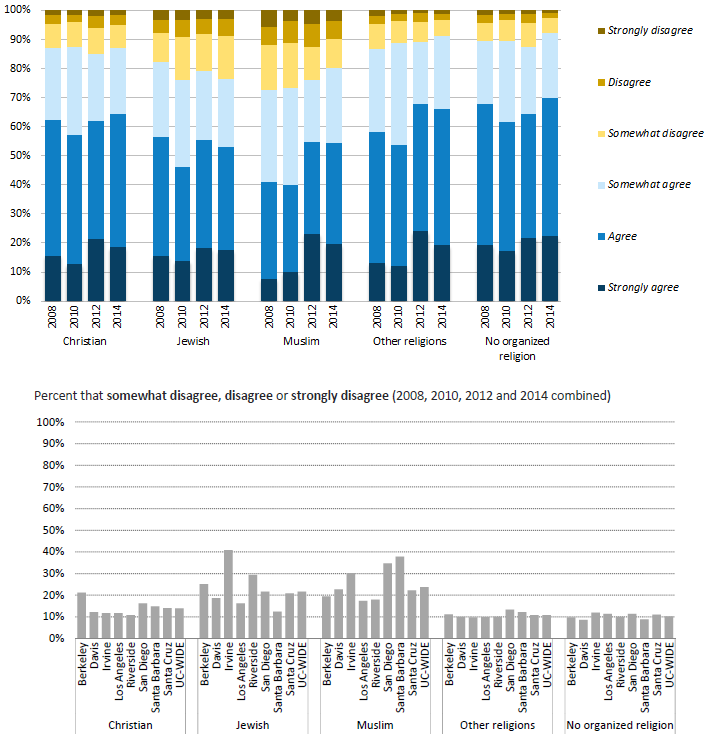
Source: UCUES
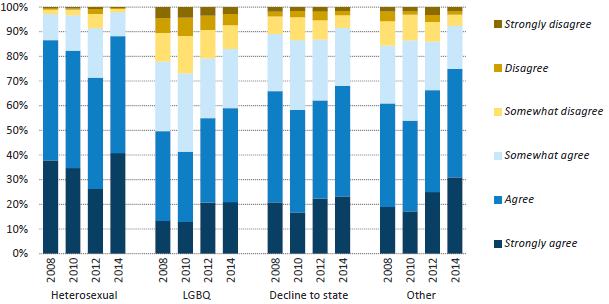
Undergraduates who identify as LGBQ and those who identify as other than male or female are less likely to feel respected on campus than those who do not.
7.4.3 Response to “Students of my sexual orientation are respected on this campus”, Universitywide, Spring 2008, 2010, 2012 and 2014
7.4.4 Response to “Students of my gender are respected on this campus,” Universitywide, Spring 2008, 2010, 2012 and 2014
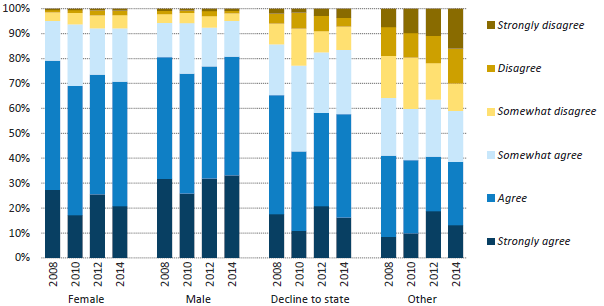
Source: UCUES. The LGBQ category includes: Gay/Lesbian, Bisexual, Self-identified Queer and Questioning/Unsure. The Other category is its own category in UCUES; the data shown here do not include any other responses. Because the numbers for some of the groups are small, campus data are not reported separately.
7.4 UNDERGRADUATE CAMPUS CLIMATE
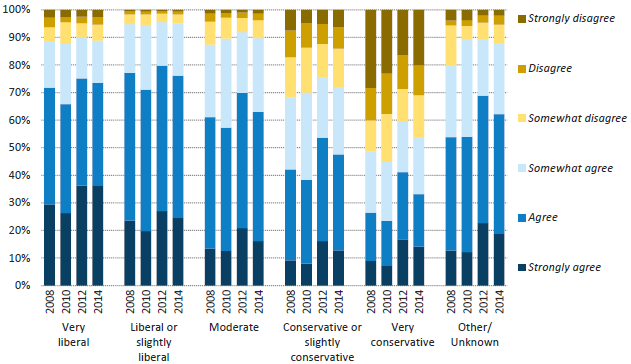
Undergraduates who categorize their political beliefs as conservative are less likely to feel respected on campus than those with liberal or moderate political opinions.
7.4.5 Response to “Students of my political beliefs are respected on this campus”, Universitywide, Spring 2008, 2010, 2012 and 2014