Accountability Report 2016

Chapter 9:

The broad scope of UC research

The California Master Plan for Higher Education designates the University of California as the primary state-supported academic agency for research. UC research contributes to the state and to the nation through discoveries that improve health, technology and the quality of life.

UC has more than 800 research centers, institutes, laboratories and programs that span ten campuses, five medical centers, three national energy laboratories and numerous research facilities. All forms of intellectual inquiry are represented, from the search for sub-atomic particles to the study of distant galaxies, and all things in between, including our own species, the natural world we inhabit and the societies we create. The extraordinary diversity and quality of research at UC is reflected in the rankings assigned to UC campuses (see Chapter 14).

Evaluating the research enterprise

UC’s research may be assessed in a variety of ways: expenditures; quality and impact; enhancement of UC students’ experience; contribution of findings to public knowledge; and economic and societal benefits. This chapter focuses on quantitative measures such as expenditures, employees and publications.

However, these measures do not present a comprehensive account of UC’s research. They underrepresent research achievements in the arts, humanities, social sciences and theoretical sciences, where work leaves less of a financial footprint, but still contributes to UC education and society.

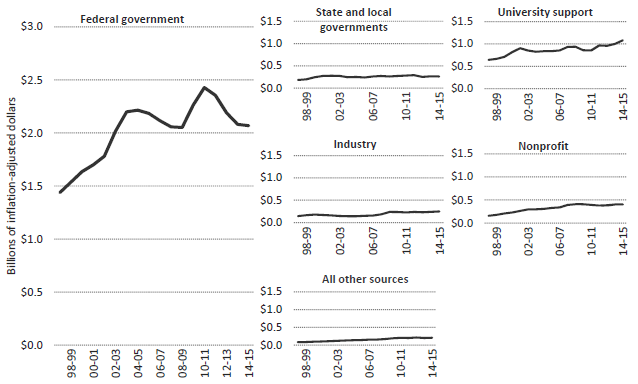
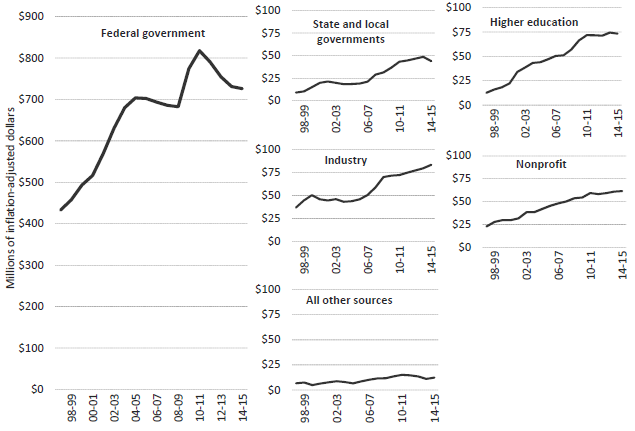
Sources of Research Funding

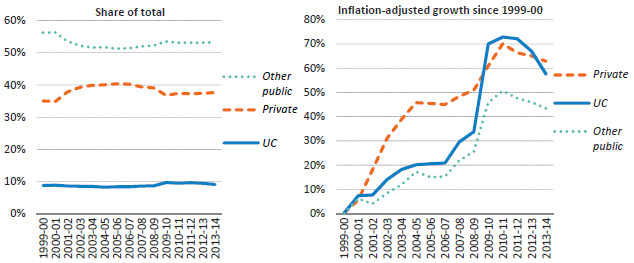
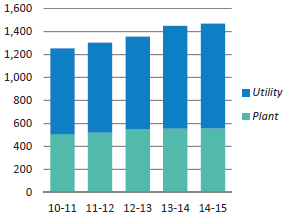
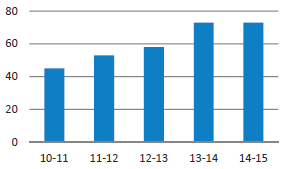
Research expenditures at UC nearly doubled over the last 15 years, to about $4.3 billion. In comparison with its peers, UC excels in research dollars per faculty member. Federal funds account for more than half of the total. Private support is a growing component, funding research in health, life sciences, technology, materials engineering, education and other fields. Private support only accounts for about 22 percent of research awards — 10 percent from corporations and 12 percent from nonprofit organizations. This leaves UC’s research susceptible to federal budgetary fluctuations.

A small sample of research funded in 2014–15:

  • UC Berkeley was awarded $15 million by the William and Flora Hewlett Foundation to study cybersecurity and internet policy.
  • UC Davis School of Veterinary Medicine received $47.6 million from the US Agency for International Development to monitor the global emergence of pathogens from animals.
  • UC Irvine’s Center for Chemistry at the Space-Time Limit was granted $8 million from the National Science Foundation.
  • UCLA received $5.2 million from Biomarin Pharmaceuticals to explore gene therapy for sickle cell disease.
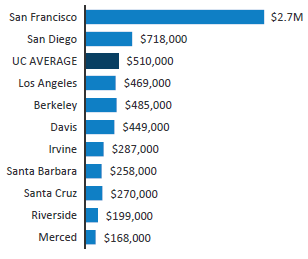
  • UC Merced was granted $2.7 million by the National Institutes of Health for research on copper exposure and neurological disorders, including Alzheimer’s.
  • UC Riverside was awarded $3 million by the U.S. Department of Energy to study nanoscale electronic systems.
  • UC San Diego received $21.5 million from the National Science Foundation to study the role of high-performance cyberinfrastructure in furthering science.
  • UC San Francisco was awarded $11.2 million by the National Institute of Allergy and Infectious Diseases to improve the delivery of AIDS therapy in Africa.
  • UC Santa Barbara’s Kavli Institute for Theoretical Physics received $4.6 million from the National Science Foundation.
  • UC Santa Cruz was granted $3.5 million by the National Human Genome Research Institute for its Genome Browser.
  • UC’s Division of Agriculture and Natural Resources was awarded $2 million by the US Geological Survey for drought research.
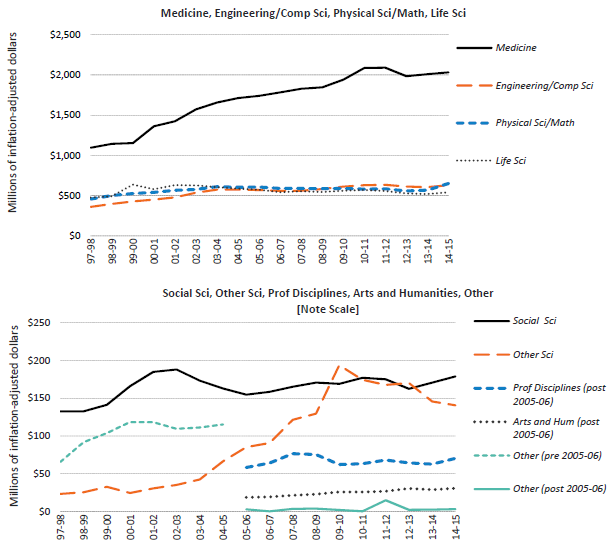
Research activities

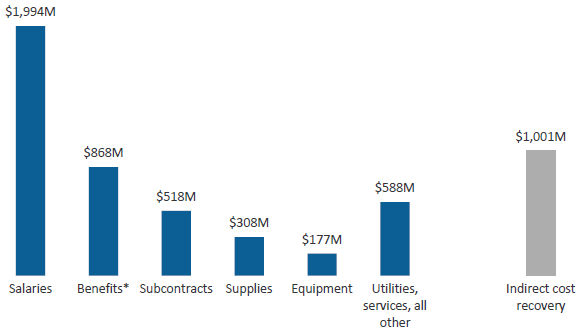
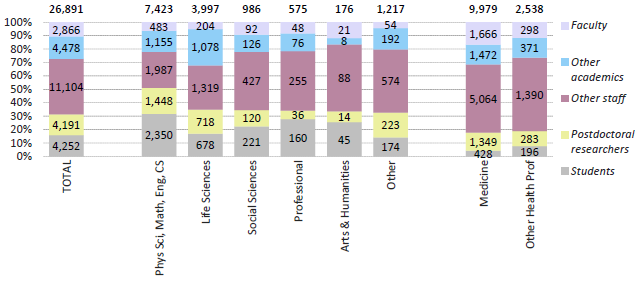
Nearly two-thirds of direct research expenditures in 2014–15 went to salaries and benefits. Only about 25 percent went to faculty; the majority supported staff researchers, and about one-fifth went to students and postdocs.

Research results — enhancing instruction

UC’s research enhances the student experience. Faculty often incorporate their research results into their courses. This provides UC students with access to insights and discoveries even before they are published. UC students also participate; the 2014 UC Undergraduate Experience Survey found about half of seniors had been involved in research projects or creative activities.

Participation in research defines graduate education, and graduate student researchers make up a significant portion of the research workforce. In 2014–15, of UC’s 52,500 graduate students, about 15,800 were employed as paid research assistants. UC also trains about 6,200 postdoctoral scholars.

Research results — spurring the economy

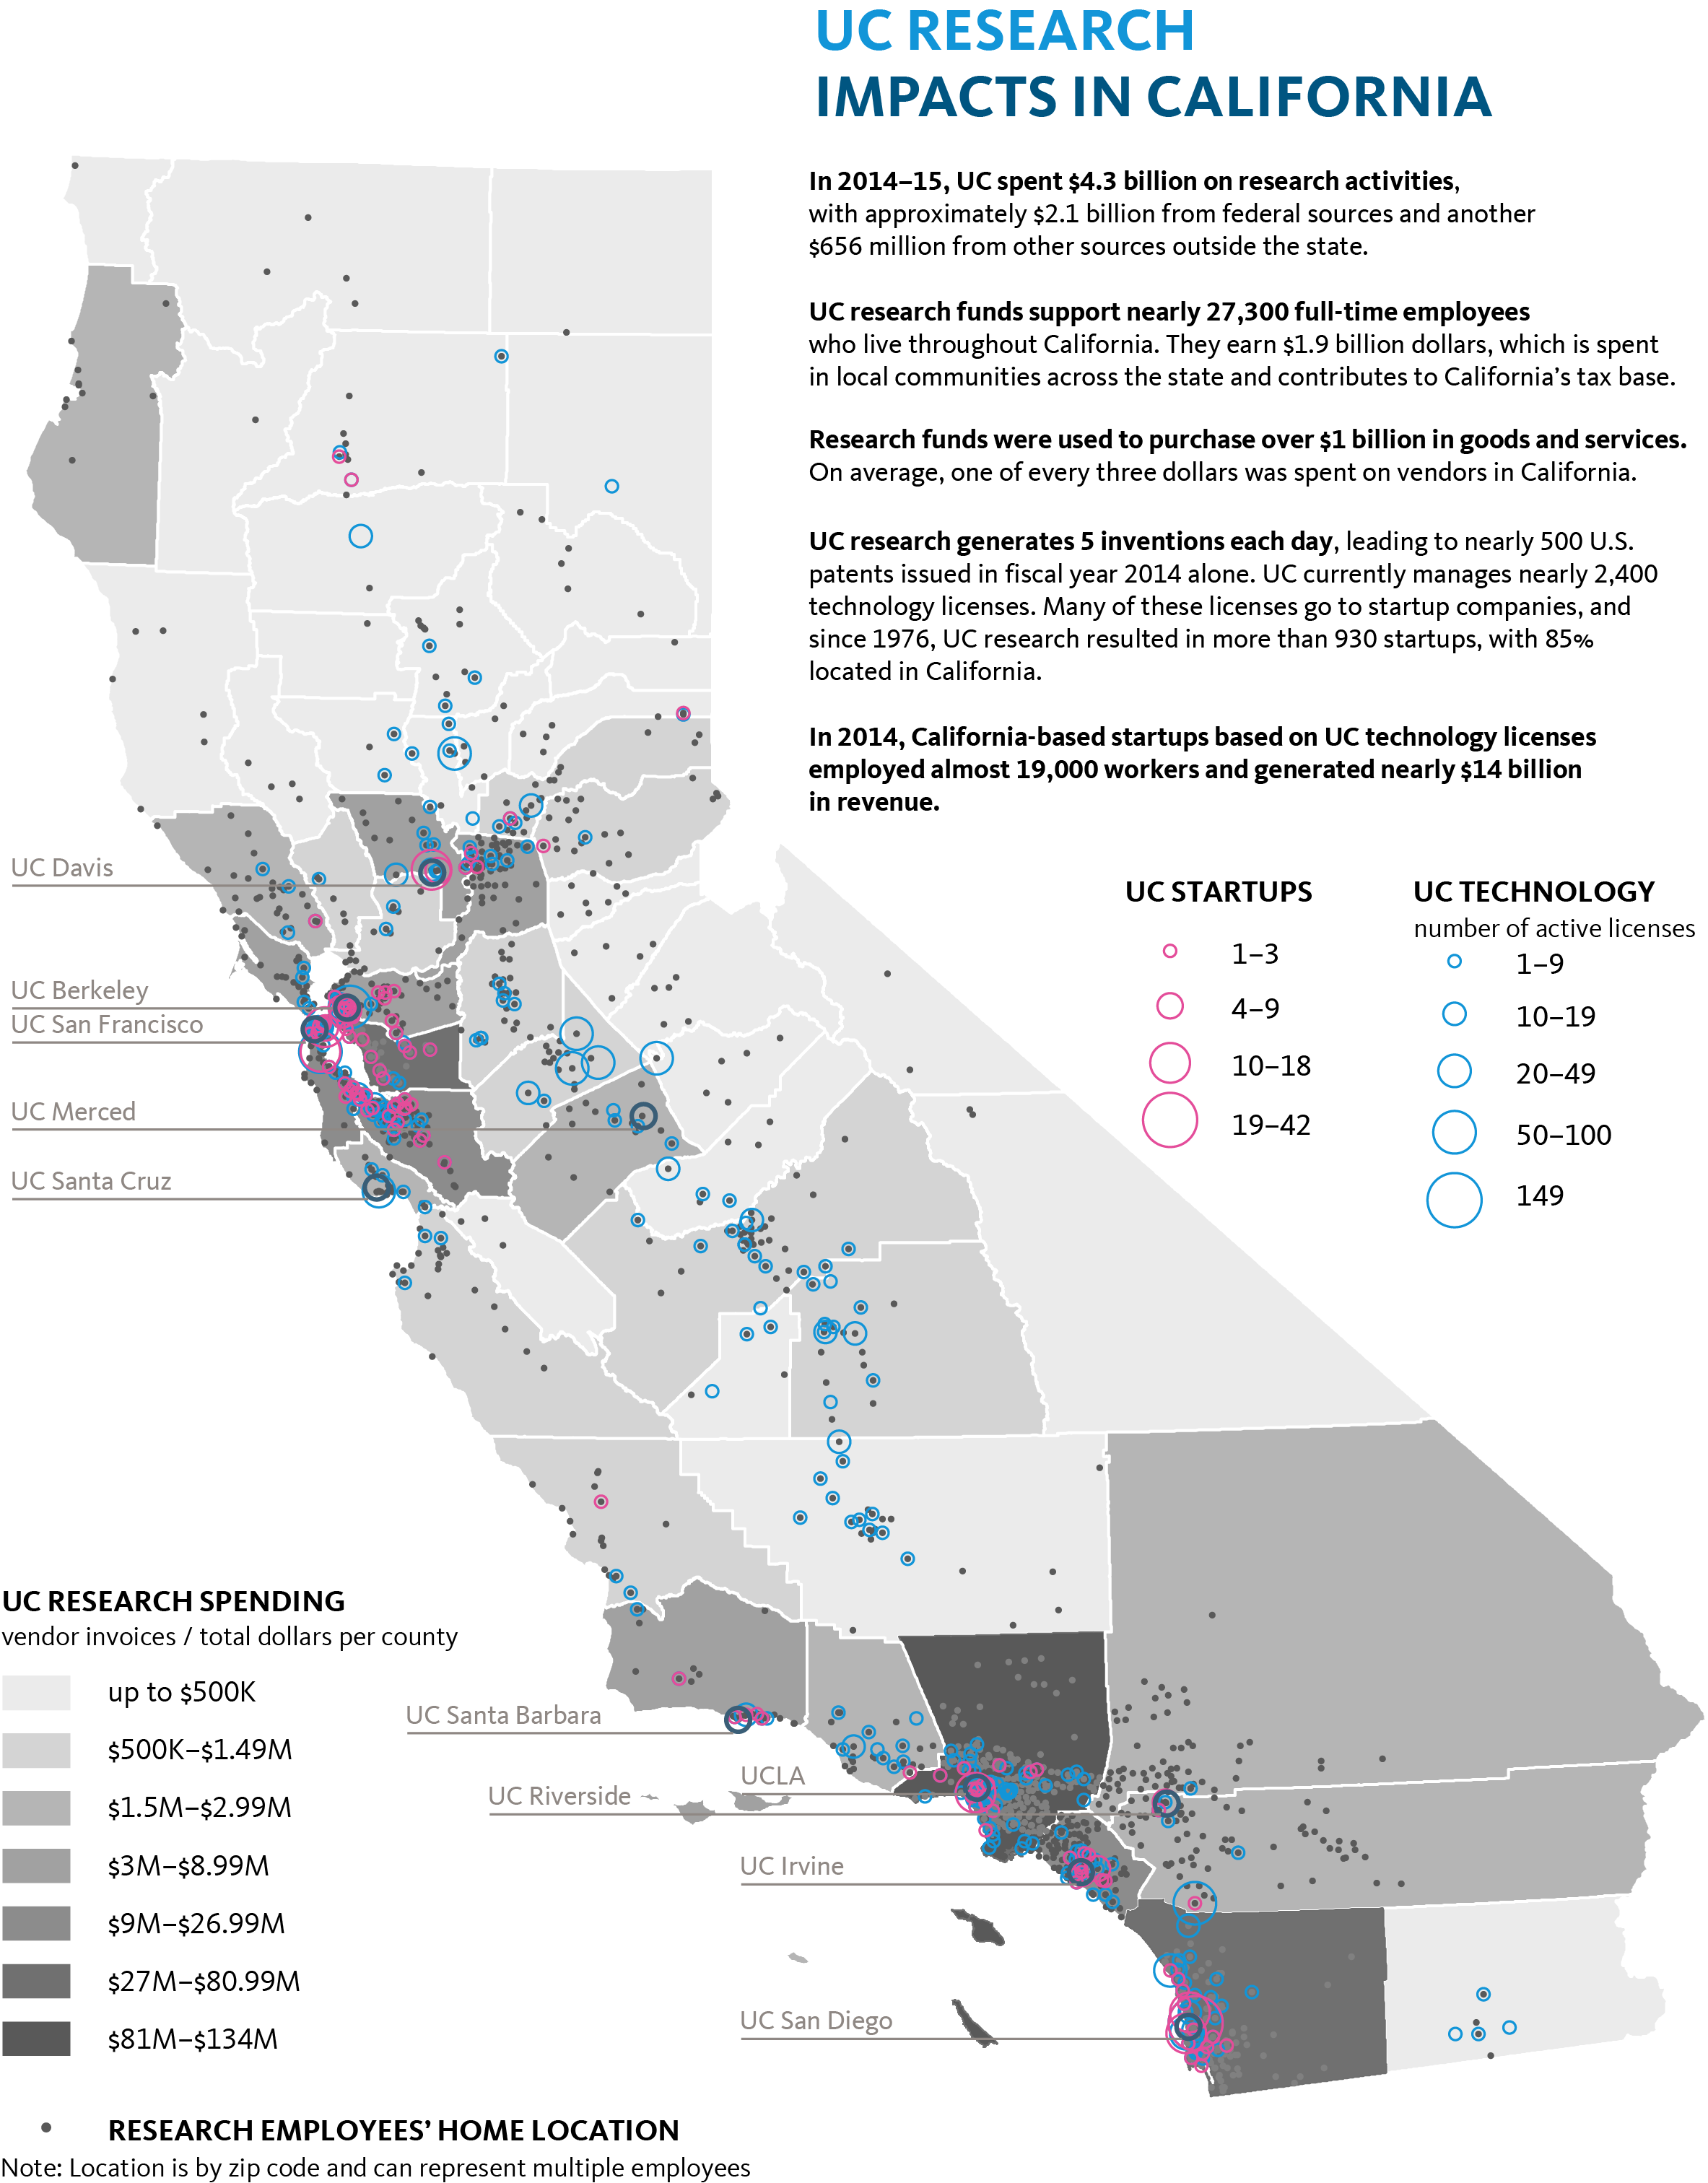
The economic benefit of UC’s research enterprise to the state of California is significant. For every dollar spent by UC, the state’s economy increases by about two dollars. The $4.3 billion spent by UC on research multiplies to nearly $9 billion statewide. Research employees’ salaries are spent all across the state. Research funds also purchased over $1 billion in goods and services, with one in three dollars supporting California vendors.

In addition to direct economic impact, many businesses in California are based on technology developed at UC or rely on the skills of UC graduates. Research becomes public knowledge through publications and the patent process. These innovations enhance industries, stimulate economies, and improve health and well-being. Over the past two decades, UC has secured more licensable patents than any other U.S. research university. Since 1976, 934 startup companies have been founded around UC inventions, with 85 percent based in California.

Research results — diffusing knowledge

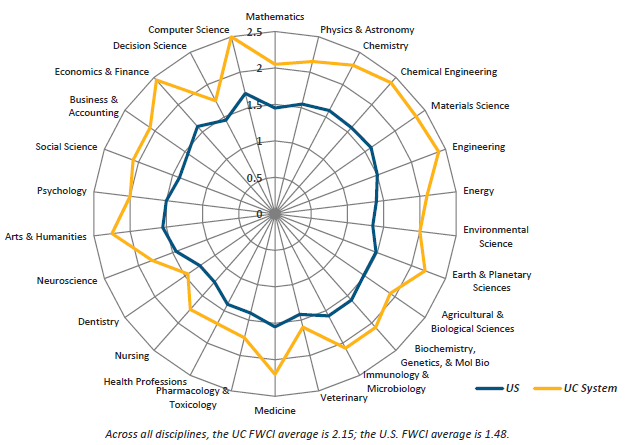
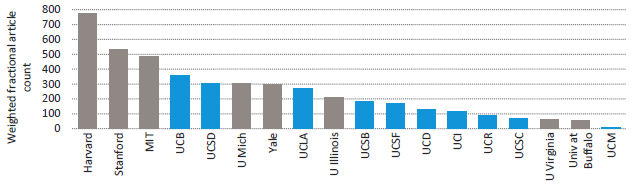
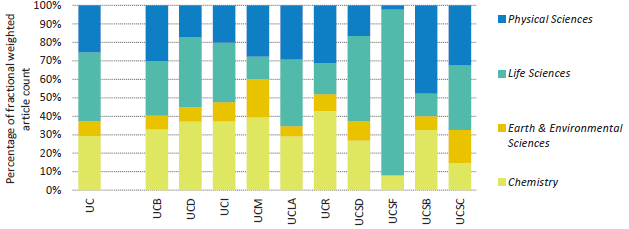
Publications are perhaps the most visible results of UC research. This chapter includes an analysis by academic publisher Elsevier of the impact of UC research publications, attributing one out of 12 research publications in the United States to UC.

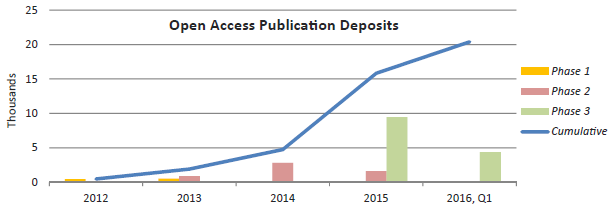
The books, periodicals and journals in which research findings are published are expensive and often only available through subscriptions. This puts them beyond the reach of many researchers, students, journalists and others with limited financial resources, especially in developing regions. To ensure that research findings become public, UC has adopted Open Access policies enabling UC authors to make their articles available through the eScholarship repository, operated by UC’s California Digital Library. This chapter presents a progress report on UC’s Open Access program since its inception in 2012, charting publication availability and worldwide utilization.

Research results — improving global health

During 2014–15, about 2,900 clinical trial research projects were underway at UC. Clinical trials occupy a unique position in academic research. Unlike basic research, these projects represent the final stage in the journey from a scientific discovery to an effective treatment. Of the research dollars that came to UC from businesses during 2014–15, half of the total was directed toward clinical trials.

Research results — addressing climate change

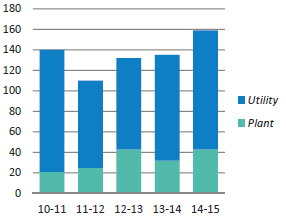
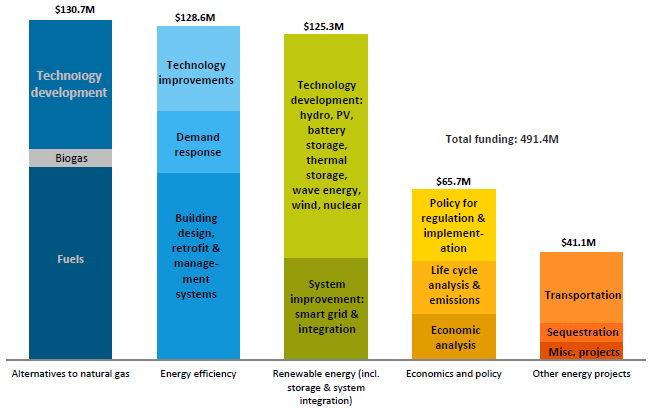
UC is a leader in research on technologies and practices to reduce carbon emissions and impacts. In addition to appropriations from the U.S. Department of Energy to Lawrence Berkeley National Laboratory, UC campuses secured about $491 million over a six-year period for work on carbon neutrality.

Research workforce changes

UC’s research mission faces numerous challenges. These include recruiting and retaining faculty, attracting and supporting graduate students and postdoctoral researchers, and fully funding the research enterprise, because UC does not recover the full costs of research from either governmental or private sponsors.

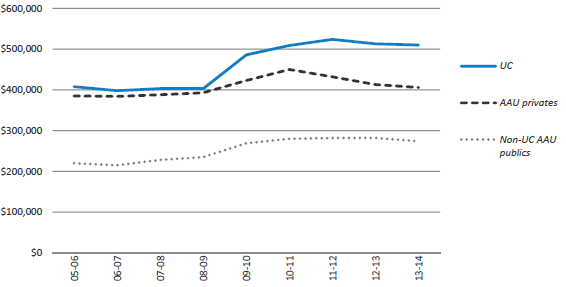
A nationwide issue is the lack of federal support for basic research and development. For more than a decade, federal research support has been essentially flat, with the exception of American Recovery and Reinvestment Act stimulus funds. Between late 2009 and 2011, the Act provided UC with over $1 billion for research. In 2012–13, cutbacks in federal spending reduced UC’s research awards to early 2000’s levels. As a result, the workforce has fallen by 9.2% from its peak in 2011 of nearly 29,600 FTE (full-time equivalent) to 26,890.

The effect of these reductions has impacted the University’s instructional mission, as research funding supports graduate student researchers and postdoctoral researchers. The impact has varied by campus and by discipline, with more of an impact on fields such as medical research, which depend on funding from UC’s largest research sponsor, the National Institutes of Health.

Since 2011, the FTE of graduate student researchers (GSR) has dropped 15 percent, from over 4,000 FTE to about 3,400. The total number of UC’s academic doctoral students has remained about the same, which indicates that graduate students, overall, are spending less time as compensated researchers. The number of postdoctoral researchers increased more dramatically than the number of GSRs under the Recovery Act. Their numbers also declined with Recovery Act expenditures, but not as sharply as GSRs — from 4,600 FTE to 4,300, representing a drop of 6.5 percent.

Looking forward — federal research funding

Federal funding supports more than half of UC’s research. The Federal Bipartisan Budget Act of 2015 calls for two years of substantial increases in federal agency appropriations for academic research and projects. The increases in appropriations vary among federal agencies: UC’s largest research sponsor, the National Institutes of Health (NIH), anticipates an increase of 6.6 percent; UC’s second-largest research sponsor, the National Science Foundation, expects an increase of 1.6 percent.

Beyond this two-year horizon, the long-term prospects for federal research sponsorship remain uncertain, in part because the competition for federal funding has grown. The success rate for federal grant proposals for all research universities has declined over the last decade to about one proposal funded for every five received at NIH. UC faculty are submitting an ever-larger number of proposals to maintain the same level of funding. The administrative effort of drafting, reviewing, submitting and tracking proposals is one of the less-visible costs of conducting research — costs that are not fully recovered from federal sponsors.

To offset some of the uncertainty involved in federal funds, UC and other research universities are increasingly looking to private sources of support, such as foundation grants and corporate investment.

For more information

UC’s Budget for Current Operations 2016–17 contains information on the contributions and impacts of UC’s research on the California economy.

The Technology Commercialization Report for 2015 provides information on patents, technology licensing and startups.

The UCOP Office of Research and Graduate Studies maintains resources on UC’s research enterprise.

Research Sponsorship: an interactive storyboard at the UC Information Center.

The UCOP Institutional Research and Academic Planning website provides a map of the economic impact of UC research activity in California and more information about UC's research enterprise, including quarterly updates on UC's research funding.


Federal funds support most of the research work done at UC.

9.1.1 Direct research expenditures by source, Universitywide, 1997–98 to 2014–15

Expenditures

Source: UC Corporate Financial System1

UC’s direct research expenditures during 2014–15 amounted to nearly $4.3 billion. Forty-eight percent of this total came directly from federal agencies, the lowest percentage in 15 years. A further 8 percent represents federal flow-through funds that came to UC as sub-awards from the state, corporations, non-profit organizations or other research universities. Together, about 56 percent of UC’s research expenditures started as federal funds.

About three-quarters of UC’s federal research funds came from two agencies: the National Institutes of Health and the National Science Foundation.

Fluctuations in federal appropriations have a major impact on UC’s research. Cutbacks at federal agencies starting in 2006 ended a long period of growth. This downturn was reversed during 2009–10 by the American Recovery and Reinvestment Act, which provided over $1 billion in research funds to UC. Federal appropriations have been relatively stable for the last two years, and the Federal Budget Bill of 2015 calls for funding at about the same level for the next two years.

University support, accounting for 25 percent of all 2014–15 direct research expenditures, derives from a variety of sources. These funds include UC general funds (including a portion of recovered indirect costs), state government specific appropriations, endowment income and gifts.


 Amounts have been adjusted for inflation and do not include accrual funds for postemployment retirement benefits or indirect cost recovery funds.


9.1 RESEARCH EXPENDITURES

The true costs of conducting sponsored research at UC are significantly greater than the amounts the University receives, even for federally funded projects.

9.1.2 Research indirect cost recovery by source, Universitywide, 1997–98 to 2014–15

Research indirect cost recovery by source

Source: UC Corporate Financial System

Budgets for externally funded research include both a direct cost component — the actual amount of salaries, benefits, equipment and materials — plus a percentage to cover the facilities and administration required to support the research project, including debt service, maintenance and libraries. These costs are called “indirect costs.”

In 2014–15, UC’s indirect cost recovery was just over $1 billion. The true indirect costs of research are typically much higher than the rate that research sponsors are willing to pay to UC or, for that matter, to other research universities. Actual indirect cost recovery rates vary widely. Rates negotiated with federal agencies are among the highest, at about 52–56 percent, but nonetheless run between 5 and 18 percentage points below the true indirect costs. Most non-federal research sponsors, including corporations, nonprofit organizations and the state of California, have policies that limit indirect cost rates to well below federal rates. UC estimates that the true costs of its research exceed direct awards and indirect cost recovery by $600 million annually, which must be made up from other sources.


Salaries and benefits represent more than half of all research expenditures.

9.1.3 Research expenditures by type, Universitywide, 2014–15

Research expenditures by type

* Includes post-employment benefit accruals.  Source: UC Corporate Financial System

Total research expenditures of about $5.45 billion during 2014–15, which include about $1 billion in recovered indirect costs, represent about one-fifth of UC’s total expenditures.

About a quarter of research salaries went to faculty. Twenty percent went to postdoctoral researchers and students. The great majority of those students were graduate students
Research salary distribution              $ millions              %
Faculty 512 26%
Academic researchers 324 16%
Other staff 758 38%
Postdoctoral researchers 217 11%
Students 183 9%
Total 1,994 100%


In 2014–15, funded research projects provided employment for about 26,900 full-time-equivalent personnel. This represents over 25 percent1 of the total UC full-time-equivalent workforce, including student employees.

9.2.1  Research workforce by discipline, FTE, Universitywide, 2014–15

Research workforce by discipline

Source: UC Corporate Personnel System2

A diverse community of faculty, other academics, postdoctoral researchers, students, professional researchers and support staff all participate in UC’s research enterprise. Student researchers (primarily graduate students) contribute to research in all disciplines and comprise almost one-third of the paid research workforce in the physical sciences and technology fields.

The 2014–15 research workforce is about 1.6 percent smaller than it was last year, due principally to a decline in the number of postdoctoral researchers and other staff.

The figures shown above include only staff and students paid through an externally funded research program or by UC’s own research funds. This does not capture the effort of faculty and students who engage in research in the normal course of their work, or the staffers who provide administrative, facilities and equipment maintenance support as part of the overall University mission. In disciplines without significant external research funding, such as the arts and humanities, this work constitutes the lion’s share of the total research effort.

1 UC has about 106,000 full-time-equivalent employees.

2 Data shown here represents full-time-equivalent personnel receiving earnings from research accounts.


Postdoctoral scholars (“postdocs”) are an integral part of the research function in many fields, and the training they receive at UC helps to create the next generation of scholars and researchers.

9.2.2 Postdoctoral scholars by discipline, UC Campuses, Fall 2015

Postdoctoral scholars by discipline

Source: UC Information Center Data Warehouse, October 2015 Payroll Data1  

There are more than 6,200 postdoctoral scholars at UC. Not all have full-time appointments. Postdoctoral scholars are paid mainly from research grants, and for this reason are more prominent in fields with greater external research funding. Postdoctoral scholars contribute to instruction in the laboratory sciences by working side by side with graduate students. They may also have a formal supervisory function in the laboratory.

1 Includes all postdoctoral scholar titles: employee, fellow and paid direct. Includes those who may hold concurrent titles in other academic or staff categories. Professional Fields include architecture & environmental design, business & management, communications, education, home economics, law, library science and social welfare. Other health professions & clinical sciences include dentistry, nursing, optometry, other health professions, other health sciences, pharmacy, public health and veterinary medicine.


The University of California performs nearly one-tenth of all the academic research and development conducted in the United States.

9.3.1 UC share of U.S.research expenditures, Universitywide, 1999–2000 to 2013–14

UC Share of research expenditures

Source: IPEDS

UC’s contribution to academic research and development activity in the United States has remained constant over the last decade, at between 9 and 10 percent. Over this period, the rate of growth in UC’s research expenditures exceeded the average pace at other public universities. This reflects both UC’s competitiveness in securing federal awards and UC’s successful relationships with the private sector.

UC is the largest single recipient of funding from the two federal agencies principally responsible for academic research: the National Institutes of Health and the National Science Foundation. UC generally receives 5 to 6 percent of NIH’s annual appropriations for research and 7 to 8 percent of NSF’s annual appropriations.

All research universities experienced a decline in research expenditures during 2012–13 and 2013–14, as stimulus funds from the American Recovery and Reinvestment Act (ARRA) were spent and when Congress enacted cutbacks on research appropriations. The decline at UC was steeper than at private and other public universities on average, largely because UC was successful in attracting over $1 billion in stimulus funds. The current federal budget calls for relatively steady agency research funding for the next two years, so research expenditures should remain constant for that period.


Inflation-adjusted expenditures for research in the medical fields have increased by 86 percent since 1997–98, compared to 48 percent for all other disciplines.

 9.3.2 Direct research expenditures by discipline, Universitywide, 1997–98 to 2014–15

Direct research expenditures by discipline

Prior to 2005–06, “Other” included professional and arts and humanities. Source: UC Corporate Financial System. 

Research expenditures in all STEM (Science, Technology, Engineering and Mathematics) and medical fields represented over 90 percent of total research expenditures each year during the past decade. This reflects the availability of funding and parallels the nationwide pattern.

Measures based on expenditures substantially underrepresent research activity in the arts and humanities, social sciences and professional disciplines, which make important contributions to scholarship and the quality of life yet have relatively little access to external funding.


Annual research expenditures per ladder-rank faculty are higher at UC than its comparison peers.

 9.3.3 Average inflation-adjusted research expenditures per ladder-rank faculty, UC and AAU comparison universities, 2005–06 to 2013–14

Avg. inflation-adjusted research expenditures per ladder-rank faculty

Source: IPEDS

UC faculty are extremely successful at attracting research support from both government and private sponsors. On average, UC annually conducts $510,000 in research per tenured and tenure-track faculty member, which surpasses the average of $406,000 per faculty member for American Association of Universities (AAU) private institutions and $274,000 for AAU public institutions.

The largest single source of research sponsorship is the National Institutes of Health, and campuses with medical schools and hospitals are in the best position to compete for these funds. UC’s second-largest source of research support is the National Science Foundation.


9.3.4 Average research expenditures per ladder-rank faculty, UC campuses, 2013–14

Average research expenditures per ladder-rank facuty, UC Campuses, 2013-14

 UCSF is an exclusively health science campus, where many non-ladder-rank (clinical) faculty conduct significant research.


UC’s Open Access policies have already resulted in a growing body of freely available research publications in the eScholarship online repository, expanding the global reach of UC’s research findings.

 9.4.1 Open Access Project Initiative progress report, Universitywide, 2012 to March 2016

Open Access Usage Distribution

Source: California Digital Library

This map shows the geographic distribution and concentration of article downloads for materials deposited in eScholarship, a repository run by UC’s California Digital Library. There are currently over 100,000 open access publications available in the repository, 20,000 of which have been recently deposited under the UC Academic Senate’s Open Access Policy.

Open Access Deposits by Year

Phase 1 of this initiative represents the rate of deposit prior to the adoption of the Senate’s policy in 2013. Deposits to eScholarship increased during Phase 2, once the Senate policy was in place. Starting in 2015, an automated publication management system was implemented, resulting in a greater public distribution of research findings. The recent application of these policies to all UC employees, not just Senate Faculty, by the Presidential Open Access Policy should accelerate the growth of publications in eScholarship.


The University of California is a major research presence at both the state and national levels, producing about one-twelfth of the nation’s research publications.

 9.5.1 Total UC research publication impact within the national context, by field-weighted citation impact and discipline, Universitywide, 2009 to 2013

UC research publication impact, by field-weighted citation impact and discipline

Publication databases can be analyzed to develop measures of the output and impact of UC researchers. A recent Elsevier study showed that UC research publications accounted for 8.3 percent of all research publications in the United States between 2009 and 2013.

In assessing research output, it is important to consider not only volume but also quality. A field-weighted citation impact (FWCI) compares publication citation data across disciplines and compares the quality of UC research output to state, national and global levels. The FWCI for the UC System as a whole is 2.15 across all disciplines, higher than both the world average (1.0) and the U.S. average (1.49) between 2009 and 2013.

In all fields, the impact of UC publications significantly exceeded U.S. national averages. UC’s publication impact is particularly high in the fields of arts and humanities, economics, computer science, engineering and medicine.

Source: Elsevier, “Research Performance of the UC System,” March 2015.


UC is a major contributor to the world’s publication output in the natural sciences, with each campus individually producing annual numbers of articles similar to comparison universities.

9.5.2 Natural sciences research output, UC campuses and eight comparison institutions, 2015

Natural sciences research output, comparison locations

Among all North American academic institutions, three UC campuses consistently rank in the top ten for research output in the natural sciences: UC Berkeley (4th), UC San Diego (5th), and UCLA (9th).

Within the natural sciences, UC’s research publications are fairly equally distributed among life sciences (30 percent), chemistry (29 percent) and physical sciences (25 percent), with a much smaller percentage in the field of earth and environmental sciences.

9.5.3 Natural sciences research output by subject area, Universitywide and campuses, 2015

Natural sciences research output, by subject area

Source: Nature Index1

1Nature Index is a database of author affiliation information collated from research articles published in a selected group of 68 high-quality science journals. Data are compiled by the Nature Publishing Group. Weighted fractional article count is a measure of research output that counts the number of articles with authors affiliated with an institution, but it takes into account how many coauthors an article has; it also down-weights articles published in the fields of astronomy and astrophysics, which are over-represented among natural science journals.


The amounts spent on UC research projects diffuse throughout the state and support local economies.

9.6.1 Impact of UC research activity in California, Universitywide, 201415.

Research activity impact in California


Licenses issued in California contribute to successful businesses. The number of active plant and utility licenses in California is growing.

9.6.2 New Licenses for UC technology issued to California businesses, 2010–11 through 2014–15

New technology licenses

Research is part of UC’s mission, and much of this research is basic, foundational research. However, some UC research leads directly to new inventions and innovations; bringing those innovations from the lab to the marketplace is an intrinsic part of UC’s public service mission.

Innovations from UC take two paths to the marketplace: they may be licensed to an existing company or they may become the cornerstone of a new startup company. Both pathways ultimately benefit the economy of the state of California.

University inventions are classified as utility licenses or plant licenses. Utility licenses cover inventions protected by utility patents, such as processes, machines, manufactured items or compositions of matter. Utility licenses are often exclusive to the licensee. Plant licenses cover sexually and asexually reproducing plant varietals, and are often licensed via nonexclusive licenses to nurseries and distribution centers. From the high-tech centers of San Diego and Silicon Valley to the agriculture of the Central Valley, UC technology is licensed throughout California.

9.6.3 Licenses for UC technology currently active in California, 2010–11 through 2014–15

Active licenses for UC technology in California

UC startups are independently operating companies that formed to commercialize a UC technology. The number of startups has increased to over 70 companies each year. More than 85% of these startups were founded and remain in California. As of 2015, 492 UC startups are actively operating in California, employing over 5,000 people and generating a combined $654 million in annual revenues. An additional 22 startups have grown and merged with other, larger companies, representing an additional 13,324 employees and $13.7 billion in annual revenues.

9.6.4 UC startups formed per year in California, 2010–11 through 2014–15

UC startups formed in California

Source: UC Innovation Alliances and Services


Over a six-year period, UC researchers secured over $491 million to develop technologies and management practices aimed at achieving the goals of UC’s Carbon Neutrality Initiative and addressing global climate concerns


9.7.1 UC strengths in carbon-neutrality research topics, Universitywide, Q4 2008-09 to Q4 2014–15

Carbon neturality researchSource: UC Contracts & Grants System

In 2007, all ten UC campuses pledged to achieve carbon neutrality by 2050, establishing a timeline that would make UC the first public university to achieve this ambitious goal. In 2013, UC President Janet Napolitano strengthened that commitment by announcing the University of California Carbon Neutrality Initiative and advancing the carbon neutrality goal to 2025. To identify research strengths, gaps and areas where further investment would have the greatest impact, the Office of Research & Graduate Studies at the UC Office of the President compiled an inventory of all research awards to UC over a six-year period on topics relevant to UC’s Carbon Neutrality Initiative.

Although the distribution of research activity among the major topic areas appears to be well-balanced, the subcategories within these areas reveal gaps. Most notably, research on the development of biogas from organic waste received relatively low support, with about $6.1 million total funding over the six-year period. More research in this area will need to be done in coming years, given the need to substitute alternative biogas fuels for the large quantities of natural gas currently used on campuses with large, natural-gas-fired co-generation facilities for heating and on-site electricity generation.