Executive Summary
The University of California produces the annual Accountability Report to provide greater awareness of the University’s efforts, operations and impact. The report serves as a planning tool for UC leaders, faculty and staff. As part of the University’s transparency efforts, the report is shared with a broad range of external stakeholders.
This executive summary provides select highlights from this year’s report and concludes with a dashboard including content used in annual budget hearings between the President and Chancellors, illustrating how this data is used to support both transparency and accountability efforts.
- 10 campuses, 5 medical centers and 3 national laboratories
- 265,000 students and 1.8 million alumni
- Fourth largest health care delivery
system in California - Third largest employer in California
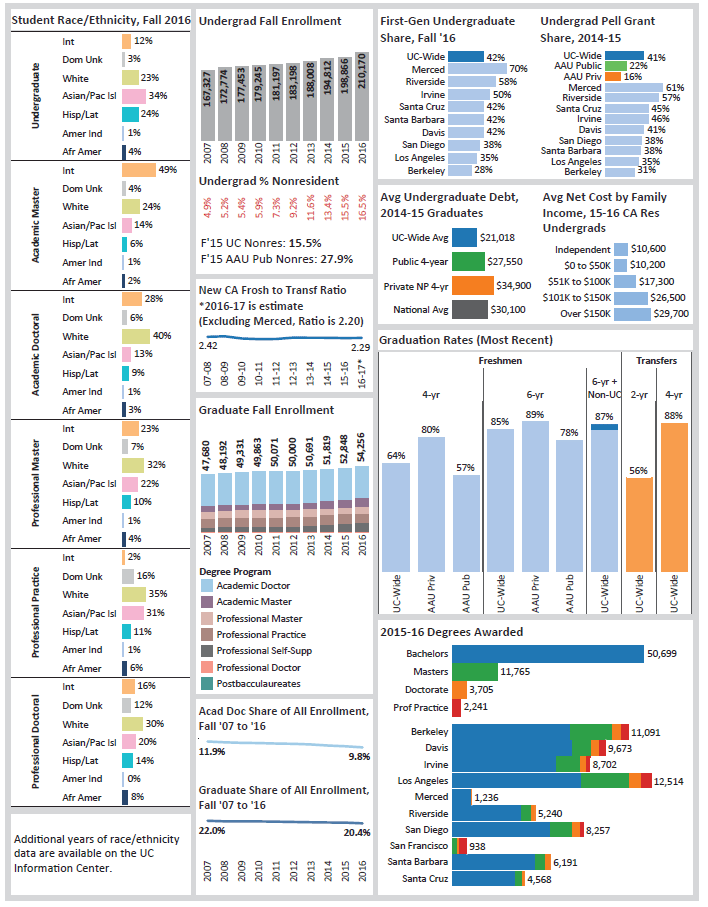
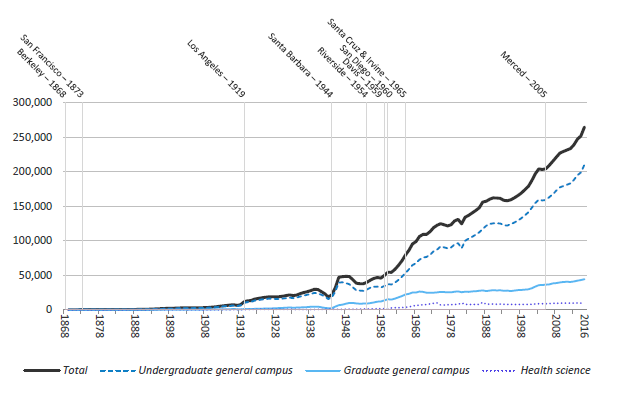
Over the last 50 years, enrollment at the University of California has quadrupled with the majority of growth at the undergraduate level. Last year, UC enrolled the largest incoming class of California undergraduate residents since World War II and the largest cohort of new national and international undergraduates, producing UC’s most diverse incoming undergraduate class.
Undergraduate and graduate student enrollment, with campus opening date
Fall 1868 to 2016
The University has a wide ranges of college preparatory programs aimed at connecting with diverse, low-income high schools students to increase their awareness about how to be eligible for UC. In addition, the Academic Senate has created major-specific Transfer Pathways for 21 of UC’s most popular majors and the University continues to make progress to its goal of a 2:1 ratio of freshman to transfer entrants. Furthermore, UC received $20 million in one-time funding in 2016-17 to support admission, enrollment, and success of underrepresented minority and low-income students. These funds supported campus programs serving an estimated 29,000 students, as well as expanded outreach to possible future students.
The University of California is recognized for providing unprecedented access to low-income and first generation students. Through its strong financial aid program, including federal and state support, UC continues to keep the cost of attendance and indebtedness levels low. However, some students have experienced food and housing insecurity. In response, the Univeristy has established a UC Basic Needs Leadership team to recommend where to provide future support. Keeping these students in colleges is critical to advancing economic mobility. Not only do Pell grant recipients have comparable graduation rates to non-Pell grant recipients, within five years of graduation, the majority of these students go on to earn more than their families (i.e., $50,000).
Key Undergraduate Fact Points:
- 41 percent Pell grant recipients, compared to 22 percent for non-UC American Association of University (AAU) public and 16 percent AAU private peers
- 47 percent graduate with no debt; UC’s average loan debt is just over $21,000, compared to a $30,100 national average
- Nearly 90 percent of freshman and transfer entrants graduate, with the average time to degree at 4.1 years for freshman and 2.2 years for transfers
- Within two to 10 years, undergraduates across majors see their earnings double
Graduate enrollment growth has not kept pace with undergraduate growth; academic doctoral enrollments remains flat since 2010 and increases are concentrated in academic masters and graduate professional self-supporting programs.
The University is taking steps to increase affordability of graduate education, along with improving graduate student well-being. Graduate fees have continued to increase, particularly for professional degree programs, and UC net stipends remain below competitive offers, though the gap had decreased between 2010 and 2013. UC is conducting a graduate cost of attendance survey to get a better idea of how to help graduate students finance their education. In addition, UC completed a graduate survey of mental health and well-being that included student feedback on where to prioritize efforts to improve the graduate student experience.
Key Graduate Fact Points:
- 20 percent graduate enrollment at UC, compared to 27 percent for non-UC AAU public and 54 percent of AAU private peers
- 20 percent of California’s graduate academic masters, 63 percent of academic doctoral, 26 perecent of graduate professional doctorate degrees, and 60 percent of graduate medical professional practice degrees
- Over 70 percent PhD completion rates, with an average time to degree of 5.7 years
- 63 percent of domestic and 50 percent of international PhD degree recipients plan to stay in California
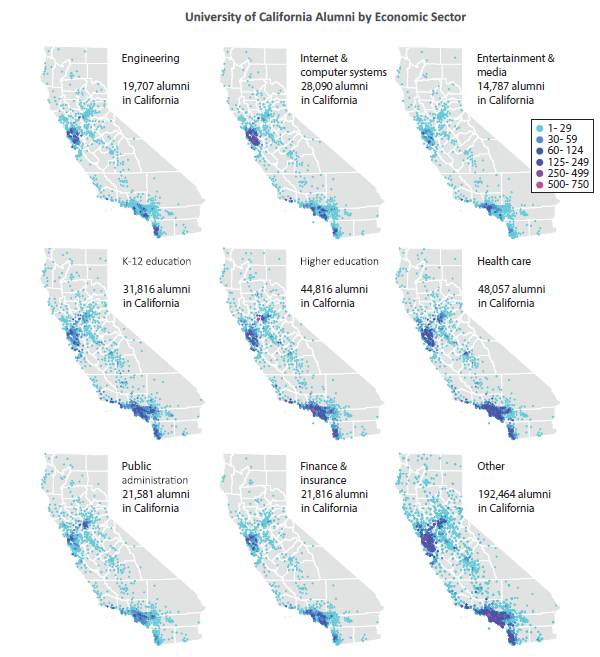
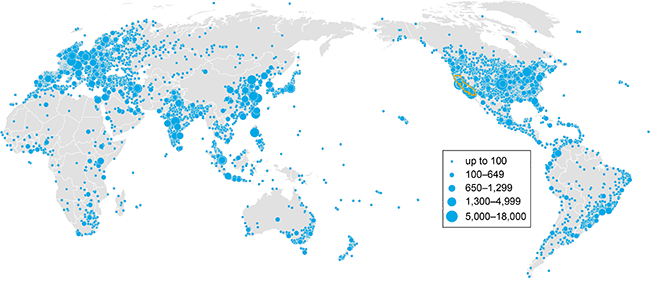
These maps illustrate where UC alumni live, along with the economic industries where they are employed. Over 48,000 alumni work in health care, more than 44,800 in higher education, almost 32,000 in K-12 education, and over 28,000 in internet and computer systems industries.
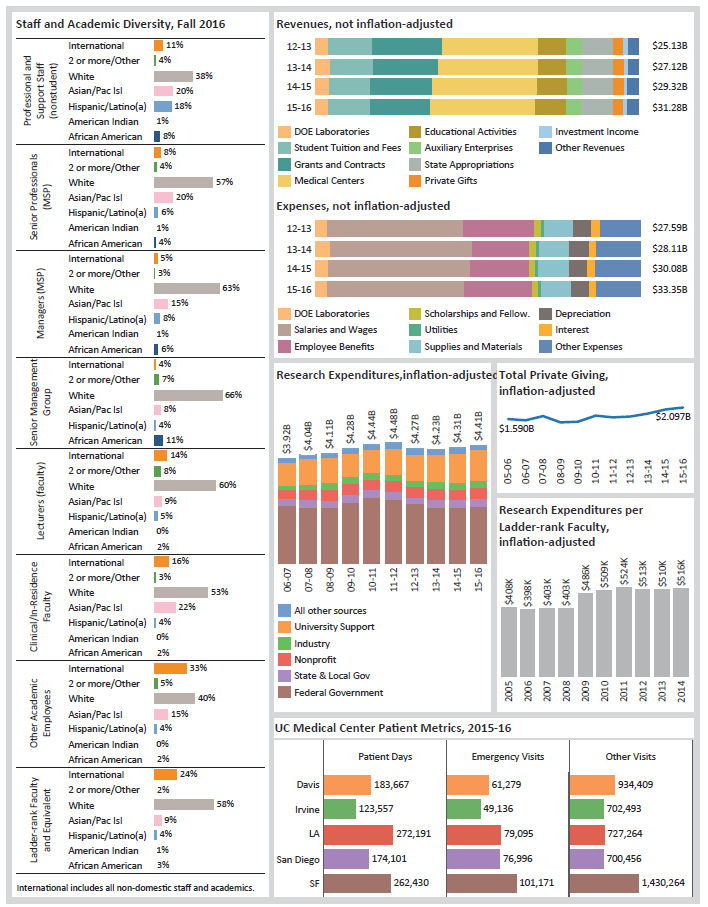
UC faculty and other research personnel attract billions of dollars and talent into California resulting in job creation, local spend, and discoveries that benefit the state and beyond. Of the $4.4 billion in 2015-16 research expenditures, 55 percent started as federal funds and three-quarters of it from the National Institutes of Health and the National Science Foundation.
Key Research Fact Points:
- Nearly one-tenth of all academic research and development in the United States is at UC
- $516,000 in research expenditures per tenured and tenure-track faculty, compared to $413,000 for AAU private and $283,000 for AAU public peers
- Over 1,000 startup companies since 1976 founded around UC inventions, 85 percent in California
UC’s Open Access policies help ensure that research findings become public by enabling UC authors to make their articles available through UC’s California Digital Library eScholarship repository. Since 2012, there have been more than 45,000 publications deposted and nearly one million article downloads worldwide.
Open Access Project Initiative, March 2013 to March 2017
UC’s impact can be seen throughout California with a significant presence in nearly every community. In addition to managing an extensive network of world-class museums, libraries, herbaria and other facilities that are open to the public, UC promotes the agriculture industry, health care, environmental stewardship, and education at all levels.
UC’s Student Academic Preparation and Educational Partnership (SAPEP) has helped nearly 200,000 K-12 students at more than 1,100 public schools prepare for college and more than 25,000 California students develop math and science skills through the Mathematics, Engineering, Science Achievement (MESA) programs. UC also manages more than 7,800 teacher professional development and 65 teacher preparation programs. UC’s Natural Reserve System comprises 39 sites with more than 756,000 acres in the state, protecting environments for research, education and public service.
Key Agriculture and Natural Resources Fact Points:
- All 58 California counties are served by Cooperative Extension that brings UC research for use in local communities
- Manages all 4-H programs throughout California
Key UC Health Fact Points:
- Operates five major trauma centers that provide half of all transplants and one-fourth of extensive burn care in the state
- More than 167,000 inpatient admissions, 368,000 emergency room visits, and nearly 4.9 million outpatient visits a year
- More than 60 percent of UC patients are covered by Medicare or Medi-Cal or lack health insurance
- The full report, data, and visualization can be downloaded at the Accountability Website.
- The UC Information Center provides additional detail.
- Additional UC in California maps are also available.
2017 UC ACCOUNTABILITY DASHBOARD