Accountability Report 2019

chapter 2: undergraduate students: affordability

chapter spotlight

Before she came to UC Santa Cruz, Diana Alvarado thought university would mean books and lectures. Instead, Alvarado has spent much of her senior year amid sand and ocean mist, researching elephant seals at Año Nuevo Natural Reserve.

During regular visits to the reserve, Alvaradotakes pictures of female seals via a quietly hovering drone. She’s refining an image analysis tool that might enable scientists to easily track seals’ weight without disturbing them.

“To be able to be part of that as an undergraduate is an amazing opportunity and truly a privilege,” she says.

Her path to this point included a work-study job as a peer adviser, guiding students through academic and other challenges. That plus financial aid made education more affordable. A scholarship from the STEM Diversity Program covered living expenses during a summer research internship, and additional scholarships funded her image analysis research.

Alvarado will graduate this year with a degree in marine biology. Her goal is to earn a Ph.D. and continue working with marine mammals.

Goals

The goal of the University’s undergraduate financial aid program is to ensure that the University remains accessible to all academically eligible California students, regardless of their financial resources.

Affordability is among UC’s highest priorities. The University has maintained a strong record of enabling families from all income levels to finance a high-quality education, and it closely monitors the impact of its pricing decisions and financial aid programs.

Maintaining access

The total cost of attendance and the composition of undergraduates in terms of financial resources set the framework for what is required to provide adequate financial support.

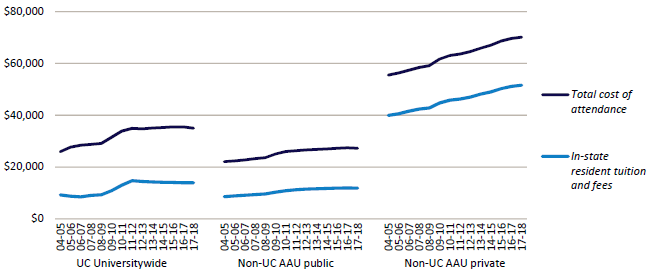
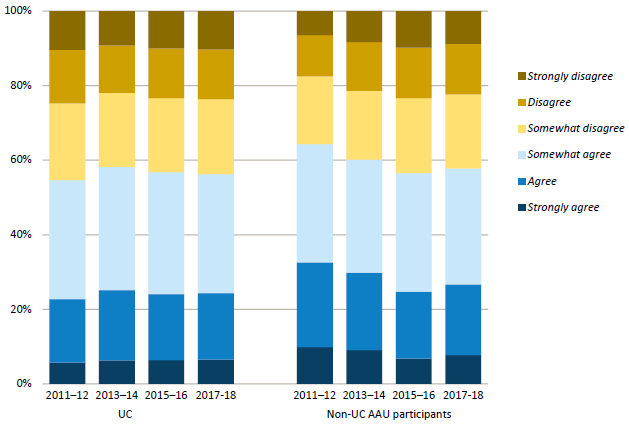
For in-state students who live on campus, the total annual cost of attendance, which comprises tuition and fees and other expenses (e.g., living and personal expenses, books and supplies, transportation, and health care), has remained relatively flat over the last several years at about $35,000. This figure compares to about $27,300 on average at other American Association of Universities (AAU) public institutions and around $70,000 for the AAU private institutions (2.1.1).

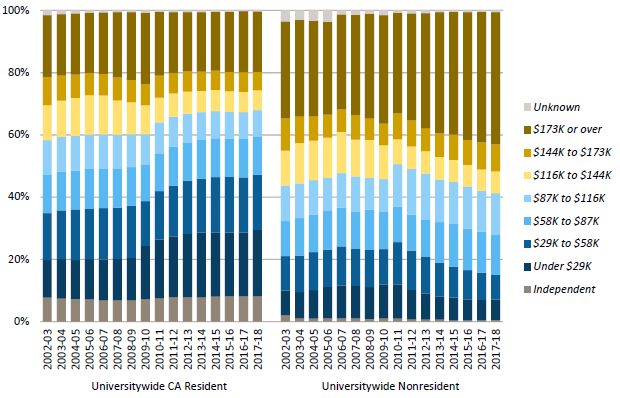
The income profile indicators demonstrate that the University remains accessible to low-income students. Between 2008–09 and 2017–18, the proportion of UC in-state undergraduates in the lowest income category increased from 14 percent to 21 percent, with offsetting declines among upper- and upper-middle-income families (2.2.2). These trends reflect both the manageability of UC’s net cost for low- and middle-income families, and the decline in the incomes of UC families since the 2009 economic recession.

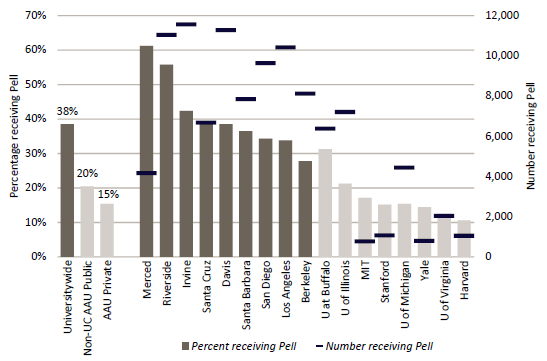
In fall 2018, 37 percent of all UC undergraduates received a Pell Grant, which is a federal grant for low-income students with family incomes typically under $50,000.

Financing a UC education

UC is able to provide access to students across the economic spectrum thanks to a progressive financial aid program that considers how much parents can afford; federal, state, and University gift aid or grants; and a manageable student “self-help” contribution from work or borrowing.

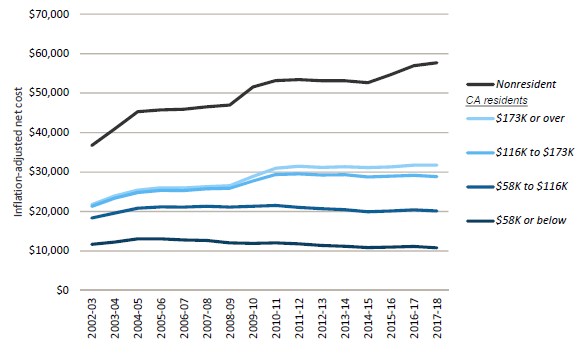
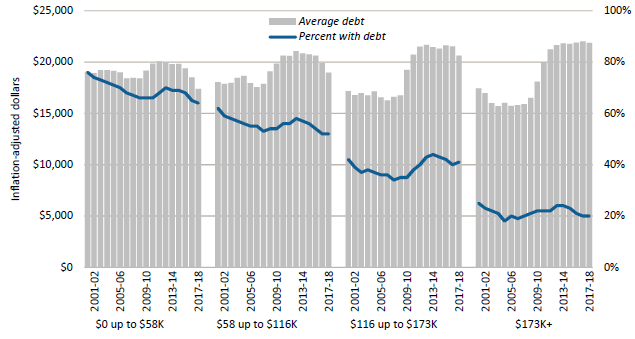
Gift aid dramatically reduces the net cost of attendance for students and enables those from low- and middle-income backgrounds to enroll in sizable numbers and proportions. The resulting inflation-adjusted net cost of attendance for in-state students from families in the lowest income bracket (less than $56,000) has declined or remained stable since 2004–05.

Federal and state governments provide critical support through the Pell Grant and Cal Grant Programs. In addition, UC’s commitment to affordability is evident in the University’s strong systemwide financial aid program. As a result of this robust institutional financial aid program, which combines support from different sources, 57 percent of California resident undergraduates paid no tuition in 2017–18. Furthermore, over two-thirds of UC’s own grant program helps students cover non-fee costs such as room, board, and book expenses.

Both UC and the State of California have made it a priority to provide financial support to undocumented students. Approximately 4,400 undocumented students received Cal Grants or need-based UC grants in 2017–18, totaling $94.9 million. The California Dream Loan Program continues to provide student loans to undocumented Assembly Bill (AB) 540 students at CSU and UC. The Legislature provided $3.5M in UC’s 2018–19 budget for the program, which has been matched by UC’s own funding of another $3.5M. Undocumented students who qualify for a waiver of nonresident supplemental tuition under AB 540 have been eligible for Cal Grants and UC grants since 2013 under the California Dream Act.

An undergraduate’s self-help requirement can be met through a combination of work and loans. UC relies on student surveys — including the UC Undergraduate Experience Survey (UCUES) and Cost of Attendance Survey — to measure how much students work. UCUES data show that over 50 percent of undergraduates do not work. Studies indicate that 20 hours of work per week is the threshold at which undergraduate academic performance may be adversely affected, and UC’s financial aid programs are structured to expect no more than 20 hours. Nevertheless, in the most recent UCUES survey (2018), ten percent of students reported working more than 20 hours per week, the same share as two years earlier.

For the academic year 2017–18, about 42 percent of California undergraduates relied on federal student loans to help finance their education, with loan amounts averaging $6,200. Parental borrowing under the federal PLUS program remained at about six percent, with the average PLUS loan amount at about $17,000 per year.

Since 2014–15, California’s Middle Class Scholarship program has provided a new source of gift assistance for students at UC and the California State University with household incomes of up to $164,000 who receive limited or no need-based financial aid. In 2017–18, UC students received $24.8 million in Middle Class Scholarship awards.

Addressing basic needs

Universities across the nation are attempting to address student basic needs. UC provides unprecedented access to low-income students and has prioritized efforts to address food and housing insecurity. Spring 2018 UCUES survey results show 47 percent experience low to very low food security (27 percent report very low food security) and four percent report being homeless. The UC Office of the President has partnered with UC Systemwide Basic Needs Committee members to share data collection efforts and findings with intersegmental groups, including our California State University and California Community College colleagues, and has presented survey results to the UC Board of Regents Special Committee on Basic Needs.

Limiting cumulative debt

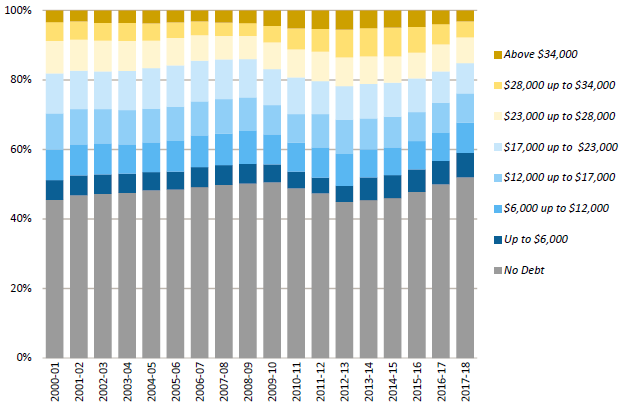
The proportion of undergraduates leaving with debt is lower than a decade ago. About 48 percent of the class of 2017–18 graduated with debt, with an average amount of $20,200. This translates into a monthly repayment amount of about $214 for ten years at a five percent annual interest rate. This level of debt is manageable, considering that a typical graduate who takes out loans earns about $3,300 a month within two years after graduation (2.3.2).

Comparison data show the 2016–17 cumulative debt for UC undergraduates was $21,100, compared to $27,293 for public four-year institutions and $32,810 for private nonprofit four-year institutions (2.3.4).

Looking forward

Both the Governor and State Legislature have proposed ideas for reforming and expanding the Cal Grant Program. Governor Newsom proposed increasing Cal Grant awards to students who are parenting young children, and this is currently under review. The State Legislature requested the California Student Aid Commission (CSAC) to study opportunities for reform of the state’s Cal Grant Programs. Proposals now being considered include a wide variety of reforms, from eliminating requirements that disenfranchise nontraditional students, to accounting for the total cost of attendance in Cal Grant awards. University of California President Napolitano and California State University Chancellor White released a joint statement in November of 2018 outlining common policy priorities for Cal Grant Reform for the public university systems. Under the UC 2030 multiyear plan, UC’s goal is to increase timely graduation which would reduce student debt and the cost of education.

For more information


UC resident tuition and fees and total costs have remained relatively flat over the last several years, and while they still exceed the national average for other AAU public institutions, they remain below the average for AAU private institutions.

2.1.1 Total cost of attendance for undergraduate in-state residents, Universitywide and comparison institutions, 2017 inflation-adjusted dollars, 2004–05 to 2017–18

Total cost of attendance for undergraduates, Universitywide and comparison institutions

Source: IPEDS1

The total cost of attending college includes tuition and fees as well as living expenses, books and supplies, transportation, health insurance, and personal expenses. The total cost of attendance is higher at UC than at AAU public comparison institutions primarily because of higher costs beyond tuition and fees, especially the high cost of living in California.

UC tuition and fees and the total cost of attendance have remained relatively flat over the past several years.

Charges are for in-state students living on campus. Averages are simple averages. Weighted averages for UC can be found at ucop.edu/student-affairs/data-and-reporting/student-budget-tables/index.html. A list of the 28 non-UC AAU public and 26 AAU private institutions in the comparison groups can be found in the data glossary.


Regardless of income, the net cost of attendance after financial aid for CA resident students has remained stable or declined since 2011–12. The net cost of attendance for nonresident students is substantially higher and has grown. 

2.1.2 Net cost of attendance by family income and California residency, Universitywide, 2017 inflation-adjusted dollars, 2002–03 to 2017–18

Net cost of attendance by family income, Universitywide

Source: UC Corporate Student System1

A general measure of the University’s affordability is its average net cost of attendance. This represents the total cost of attendance at the University for undergraduates after taking into account scholarships and grants. Scholarships and grants reduce the net cost of attending UC for students at all income levels but have the greatest impact on students from low- and middle-income families.

The availability of scholarships and grants has mitigated the impact of cost increases on students from families earning less than $100,000.

Between 2002–03 and 2017–18, net cost has declined by about $800 in inflation-adjusted dollars for in-state students in the lowest income category due to this scholarship and grant support.

Nonresident students face a much higher net cost of attendance because they face annual supplemental tuition charges of approximately $28,000, and, since 2016–17, have not been eligible to receive institutional need-based grant aid.

1 Income ranges are approximate. Independent students are excluded. Net cost is the full cost of attendance less any grants, scholarships, and fee exemptions. Income is based on amounts reported in either the Free Application for Federal Student Aid (FAFSA) or the UC Application for Undergraduate Admission, or, if missing, is imputed based on demographic profiles.


UC enrolls a higher percentage of Pell Grant recipients than public or private peers.

2.2.1 Undergraduate Pell Grant recipients, UC and comparison institutions, 2016–17

Undergraduate Pell Grant recipients, UC and comparison institutions

Source: IPEDS1

The percentage of undergraduate students with Pell Grants, a federal aid program for low-income students, provides a useful means to compare different institutions in terms of their accessibility for low-income students. It is also a useful indicator for comparing the socio-economic diversity of an institution’s undergraduate student population.

The data shown above represent the most recent year for which data on comparison institutions are available. The proportion of UC undergraduates receiving Pell Grants went up from 31 percent in 2008–09 to 38 percent in 2016–17. This is primarily a result of increased federal spending, which made more students eligible for Pell Grants, as well as the economic downturn, which caused broad declines in family income. In fall 2018, 37 percent of UC undergraduates and 44 percent of CA Residents received Pell Grants. Nationally, the percentage of Pell Grant recipients has declined since 2010–11, partially due to a recovering economy.

1 Percentage reported is that of students who received Pell Grants at any time during the 2016–17 year as a percentage of all undergraduates. Note that Pell Grant eligibility criteria change annually because of the federal appropriations process and other formula changes. Thus, trend analysis of Pell recipients would not be a valid measure of changes in low-income students but rather would reflect the changes in eligibility criteria. A list of the institutions in the AAU comparison groups can be found in the data glossary.


A large proportion of UC students come from low-income families, particularly among in-state students.

2.2.2 Undergraduate income distribution, Universitywide, 2017 inflation-adjusted dollars

Undergraduate income distribution, Universitywide

Source: UC Corporate Student System1

In-state students are more likely to be from low-income families, with 21 percent in the lowest income category in 2017–18. Since 2008–09, the proportion of low-income CA resident students increased noticeably, with an offsetting decline among upper- and upper-middle-income families. During the last two years, however, the income distributions of CA resident families have stabilized.

This suggests that the University’s financial aid programs keep the net cost of attendance within reach of CA resident and low- and middle-income families.

Conversely, more than 40 percent of nonresident students came from families in the highest income category in 2017–18. This proportion has increased steadily over the years while those in the lower- and middle-income categories have decreased. Nonresidents are not eligible for UC financial aid.

1 Note that prior to 2007–08, an increasing number of students at one campus with parent incomes above $100,000 were incorrectly categorized as having an income of $100,000. This problem was fixed in 2007–08, resulting in an apparent (but not actual) decline in the percentage of students shown in the $107,000 to $134,000 category and a corresponding increase in the percentage shown in higher income categories.


The share of UC students who felt that the cost of attendance was manageable has been relatively stable over the past several years.

2.3.1 Student response to “With grants and scholarships, if any, the total cost of attending the school is manageable," Universitywide and comparison institutions, 2011–12 to 2017–18

 Per capita gift aid for new freshmen, UC campuses and comparison institutions

Source: UCUES and SERU1

Fifty-six percent of UC undergraduates in spring 2018 felt that the cost of attendance was manageable. This figure was 57 percent in spring 2016, 58 percent in spring 2014, and 55 percent in the spring 2012 UCUES survey. Fifty-eight percent of survey respondents at other participating AAU institutions in 2017–18 agreed that the cost of their education was manageable.

The list of non-UC AAU participants in this comparison was not the same for all four years shown. The non-UC schools included in 2011–12 were University of Minnesota, Rutgers University, University of Pittsburgh, USC, Texas A&M University, and University of Virginia. In 2013–14, additional schools included University of Michigan, Indiana University, Purdue University, University of Iowa, and University of Washington, and in 2017–18, additional schools included University of Oregon, University of Texas at Austin, University of Florida, University of North Carolina, University of Kansas, and Michigan State University.

1 SERU is the Student Experience in the Research University survey, which is administered at a number of AAU institutions.


The average inflation-adjusted debt at graduation of student borrowers increased by 3.1 percent (from $19,600 to $20,200) over the past 17 years, while the percent graduating with no debt increased.

2.3.2 Student loan debt burden of graduating seniors, inflation-adjusted, Universitywide, 2000–2001 to 2017–18 (average debt of those with debt shown above each year)

 Average gift aid, cost of attendance and net cost for very low-income students, UC campuses and public AAU institutions

Source: UC Corporate Student System1

Fifty-two percent of UC undergraduates graduate with no debt at all. For those who do borrow, the average student loan debt at graduation in 2017–18 was about $20,200. The monthly repayment for this amount is about $214 for ten years at the five percent average interest rate that typically applies to student loans. Lower payments are available with longer repayment periods. For more information about estimated loan repayment amounts using this rate, visit the “Loans and Earnings” tab of the UC Alumni-at-work dashboard at: universityofcalifornia.edu/infocenter/uc-alumni-work

These figures reflect the borrowing of all graduating UC students. California resident students, however, are more likely than out-of-state students to graduate with debt. In 2017–18, about 55 percent of UC graduates who originally entered as California resident freshmen had student loan debt upon graduation, compared to only 17 percent of out-of-state students. In-state graduates’ average debt, however, was significantly lower than that of the out-of-state students who borrowed ($19,700 vs. $27,600).

1 Figures are adjusted for inflation in 2017 dollars using CA CPI-W. Borrowing shown here represents loans coordinated through the campus financial aid offices; some families also borrow from outside sources, which are not captured in this indicator. Data only include graduates who originally entered as freshmen.


Despite recent increases, the proportion of students graduating with loan debt across all incomes was still lower in 2017–18 than it was 17 years ago.

2.3.3 Student loan debt burden of graduating seniors by parent income, Universitywide, 2000–2001 to 2017–18

Indicator 2.3.3 graphic

Source: UC Corporate Student System1

The proportion of students who borrow decreased steadily from 2000–01 through 2009–10 for students in nearly every income category. From 2010–11 through 2012–13, student borrowing increased, both in percentage and in cumulative amount. This uptick in borrowing may reflect a combination of higher costs and a reduction in other borrowing alternatives (e.g., home equity loans). In the last year, however, student borrowing remained the same or decreased slightly for the lowest two income categories and for the highest income category. UC student debt remains below the national average for both public and private non-profit four-year institutions.

2.3.4       Average cumulative loan debt, UC and national comparison institutions, 2016–17 graduates

Berkeley

$18,197

Davis

$19,124

Irvine

$19,745

Merced

$19,551

Santa Barbara

$20,665

UC AVERAGE

$21,100

Riverside

$21,104

San Diego

$21,430

Los Angeles

$22,013

Santa Cruz

$22,804


Public 4-year

$27,293

Private nonprofit 4-year

$32,810

National Average

$28,350

 Source: Common Data Set and TICAS. National average excludes private for-profit institutions.

1 Figures are adjusted for inflation in 2017 dollars using CA CPI-W. Borrowing shown here represents loans coordinated through the campus financial aid offices; some families also borrow from outside sources, which are not captured in this indicator. Independent students and students with unknown parent incomes are not shown. Data only include graduates who originally entered as freshmen.


By five years after graduation, students from almost all of UC’s baccalaureate programs have debt-to-earnings ratios of less than 10 percent.

2.3.5 Debt-to-earnings ratios for UC undergraduate alumni at two and five years after graduation, Universitywide and by Campus, Undergraduate graduating cohorts 2000–2015, with student loan debt who are working in California


Debt-to-Earnings 2 Years After Graduation

Debt-to-Earnings 5 Years After Graduation

Campus

% of programs with <10% debt-to-income ratios

10th

Median

90th

% of programs with <10% debt-to-income ratios

10th

Median

90th

Berkeley

95.9%

3.4%

5.6%

8.4%

100.0%

2.4%

4.0%

5.9%

Davis

97.5%

3.5%

5.7%

8.5%

100.0%

2.5%

3.8%

5.6%

Irvine

87.9%

4.1%

7.0%

10.5%

98.7%

2.9%

4.5%

6.6%

Los Angeles

91.9%

3.9%

6.6%

9.5%

99.1%

2.9%

4.4%

6.5%

Merced

76.2%

5.6%

7.9%

11.2%

100.0%

3.3%

5.0%

5.8%

Riverside

69.0%

5.5%

8.7%

11.9%

98.8%

3.7%

5.4%

7.3%

San Diego

93.9%

4.6%

6.8%

9.4%

100.0%

3.1%

4.5%

6.6%

Santa Barbara

91.3%

4.3%

7.2%

9.7%

100.0%

3.2%

4.7%

6.4%

Santa Cruz

88.1%

3.4%

5.6%

8.4%

100.0%

2.4%

4.0%

5.9%

UC

90.0%

4.2%

7.2%

9.7%

99.6%

2.8%

4.5%

6.5%

Source: AEO (CA Employment Development Department), student financial aid and degree data

Students who graduate from UC’s baccalaureate go on to achieve positive earnings trajectories and have manageable student loan repayment obligations. The benchmark used to evaluate manageability is the percentage of average earnings required to repay a student’s debt at graduation based upon a standard ten-year repayment plan.1 UC considers debt that requires between five percent and nine percent of a student’s postgraduate earnings to be manageable. Students may choose alternative repayment plans (e.g., income-based plans) based on their individual circumstances. These can increase debt manageability for students with high levels of debt and/or low income, but can result in higher interest costs over time.

About 90 percent of UC baccalaureate programs systemwide have a debt-to-earnings ratio of ten percent or less at two years after graduation and nearly all of them do at five years after graduation.

Some arts, humanities, and social science programs have debt ratios that exceed 10 percent two years after graduation. This stems from a variety of factors, including the lower average earnings associated with industries in which these graduates tend to work in. (See 3.3.5 for earnings by major and industry in Chapter 3.)

1 Under a standard ten-year repayment plan at five percent interest.