Accountability Report 2019

chapter 3: undergraduate student success

chapter spotlight

Alejandro Quiñones, a 2018-19 senior biology and premed major at UC Riverside and first in his immediate family to attend college, lived in one room with his parents and three siblings before coming to Riverside.

Coming to the UC Riverside campus that first summer in 2015 through FastStart, a UC Riverside School of Medicine pipeline program, set the tone for what has been an unforgettable experience.

While he balances a full course load at UC Riverside, Quiñones has found additional ways to gain hands-on experience. He volunteers at the Riverside Free Clinic and the San Bernardino Free Clinic. Quiñones’ job is to help UC Riverside medical students by serving as translator and triage assistant.

On campus, Quiñones is also a Chicano Link Peer mentor, is part of the Latino Medical Student Association, and is a Health Professions Advising Center ambassador. These organizations support undergraduates with mentorship. Several Saturdays a month, he visits senior living homes through the Young At Heart program, of which Quiñones serves as president.

Trends in graduation rates and goals

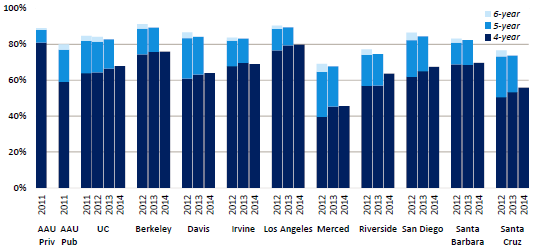
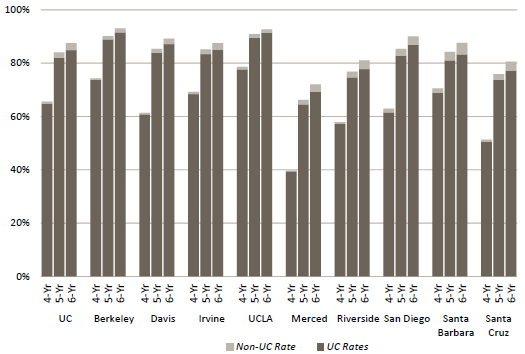
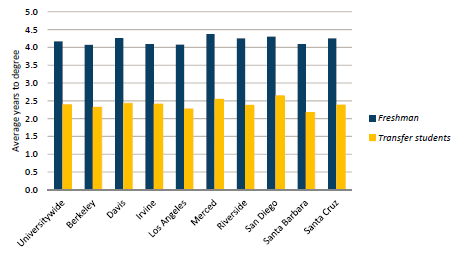
Two traditional measures of student success are graduation rates and time to degree. By both measures, UC’s undergraduates are highly successful. The four-year graduation rates for freshmen have risen significantly over the past 16 years — from 46 percent for the 1997 entering cohort to 68 percent for the 2014 cohort. The most recent six-year graduation rate, for the 2012 entering cohort, is 84 percent (3.1.1), which has increased by five percentage points since 1996. The six-year graduation rate is 88 percent when this measure includes students who transfer to non-UC institutions (3.1.2) and still graduate within six years. In addition, time to degree has steadily improved, with freshman entrants of the 1996 cohort taking an average of 4.4 years to graduate, down to 4.2 years at present (3.1.8).

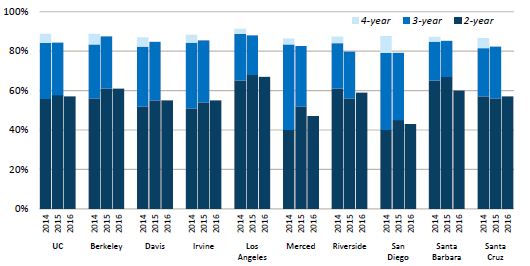
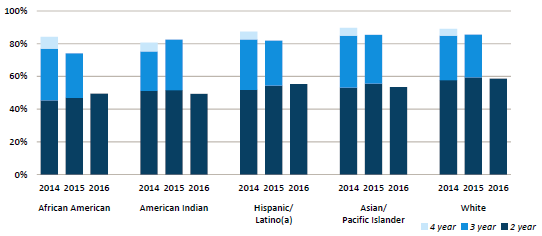
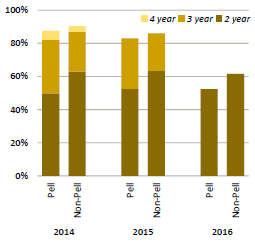
Transfer entrants have made similar gains, with two-year graduation rates increasing from 37 percent for the 1997 entering cohort to 57 percent for the 2016 cohort (3.1.3). The most recent four-year graduation rate for transfers (2014 entering cohort) is 89 percent, an increase of about ten percentage points since 1997. The average time to degree is 2.4 years for the 2011 cohort, down from 2.6 years for the 1996 cohort (3.1.8).

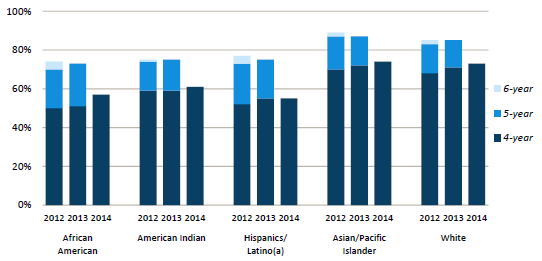
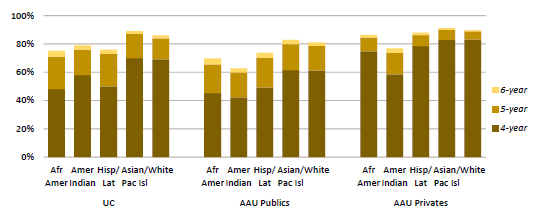
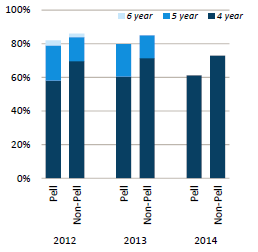
Although graduation rates have increased for all students, there are still gaps in rates between subgroups (3.1.4, 3.1.5, 3.1.6, and 3.1.7). Low-income students, first-generation students, and students from underrepresented groups (URGs) have lower average graduation rates, especially four-year graduation rates for freshmen and two-year graduation rates for transfers.

UC’s goal is to enable all entrants to complete their undergraduate degrees in a timely fashion and to ensure that their education prepares them to be the next generation of leaders for California, the nation, and the world. President Napolitano seeks to increase the four-year graduation rate from 68 percent (2014 cohort) to 76 percent by 2030.

Improving graduation rates and eliminating gaps

The UC Office of the President and campuses have employed predictive analytics to obtain a better understanding of factors that influence graduation rates. Findings indicate that pre-college factors such as academic preparedness measured by high school GPA, the rigor of student’s high school or transfer courses, standardized test scores, and demographics are significantly related to time to degree and graduation rates. However, these factors together only explain a small portion of variance in graduation rates. Campus climate, access to courses, student sense of belonging, student engagement in academic and civic activities, and success in the first year at college, among many other factors, are important to college completion and time to degree.

To address challenges facing students and campuses and reach UC’s goal of improving graduation rates, UC campuses have instituted a wide range of programs to promote the academic success of undergraduates and eliminate gaps in graduation rates between subgroups. These include expanding orientation, advising, and counseling services; supporting and enhancing initiatives that address students’ academic difficulties; streamlining course prerequisites, course sequences, and degree requirements; increasing access to courses offered by Summer Session or UC Extension; developing pedagogical strategies for the diversification of classrooms; removing achievement gaps in the largest, highest-impact courses; and conducting learning analytics to help identify and assist students who might need additional support.

Recognizing the importance of early student success for on-time graduation, UC campuses are specifically making efforts to improve first-year student success. Many campuses offer first-year seminars to assist students with the transition from high school to UC. Seminars help students build a sense of community, understand the expectations of UC, engage with faculty, and learn how to leverage campus resources. Campuses are also making advising mandatory for first-year students. Early advising helps students choose the right classes and obtain support. To help students understand the role of research in education, many UC campuses offer first-year students the opportunity to work on a research project with a faculty member. Systemwide, UC recently launched the First-Generation Faculty Initiative, which connects first-generation students to both faculty and staff mentors.

Undergraduate outcomes

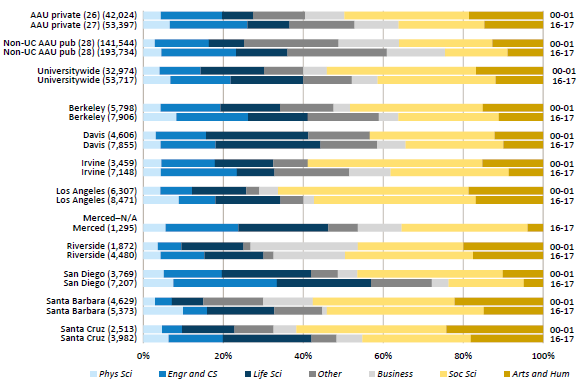
The number of undergraduate degrees awarded by UC over the past 15 years has grown by 64 percent, from about 32,900 degrees in 2000–01 to about 53,700 degrees in 2016–17 (3.3.1). Increases in the size of the entering freshman class and improving graduation rates have contributed to this growth. More than one-third of the undergraduate degrees awarded by UC in 2016–17 were in STEM disciplines.

UC is proposing a multiyear framework that seeks to improve degree attainment and produce 200,000 more degrees through 2030 in addition to the projected baseline of one million degrees. About 88 percent of these additional degrees (175,000) would be at the undergraduate level. In the last three years, UC has already added 14,000 more degrees above the baseline.

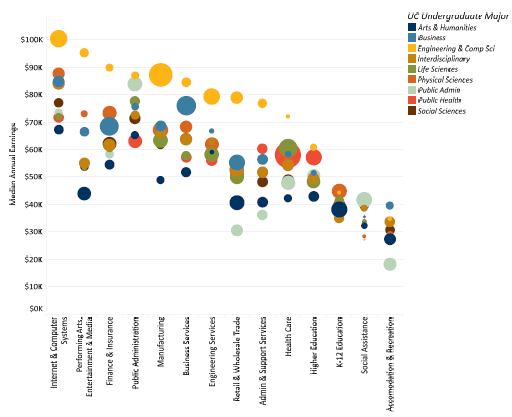
UC undergraduate alumni enroll at graduate schools or work in various industries. Four years after graduation, more than one-quarter of bachelor’s degree recipients have enrolled in graduate or professional programs. More than half are working in key industries such as health care, K–12 education, finance & insurance, public administration, social assistance, higher education, engineering, and internet and computer systems. Many alumni work in industries that closely align with the major they chose. By ten years after graduation, 56 percent of engineering & computer science majors work in engineering, manufacturing, or internet and computer systems; 30 percent of life science majors work in health care; and 34 percent of arts & humanities majors are working in K–12, higher education, or performing arts and entertainment.

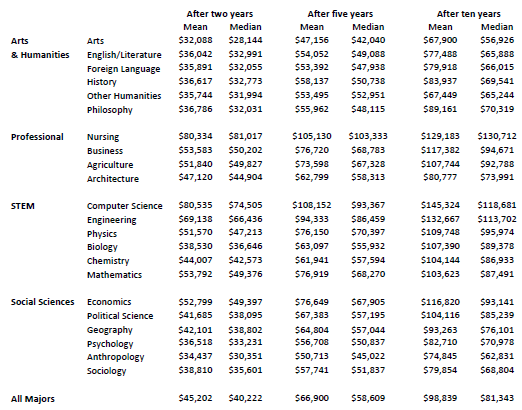
UC alumni working in California surpass the typical earnings of other California bachelor’s degree recipients (aged 25 and over), by six years after graduation. The earnings trajectory of UC alumni increases rapidly — doubling what they were earning at two years after graduation by ten years after graduation, on average (3.3.2). Economic success is prevalent for all socioeconomic groups, including students whose families qualified for federal Pell Grants. Within seven years of graduation, the majority of Pell Grant recipients earn an average income higher than their parents’ combined incomes during the time those students attended UC (approximately $50,000).

Looking forward

Building on UC’s record of success, there are continued systemwide and campus efforts to improve undergraduate outcomes. Through the application of state funds, UC hopes to make additional progress in closing equity gaps in graduation rates between subgroups.
For more information


Over 60 percent of UC freshmen graduate within four years, a higher rate than comparable AAU public universities. 

3.1.1 Freshman graduation rates for all students, UC and comparison institutions, Cohorts entering fall 2012, 2013 and 2014; fall 2011 cohort for AAU comparison

Freshman graduation rates for UC and comparison institutions

Source: UC Data Warehouse and IPEDS1

UC’s six-year graduation rate is higher than that of comparable AAU public institutions. UC’s four-year graduation rates for freshmen have risen significantly since 1997, from 46 percent for the 1997 entering cohort to 68 percent for the 2014 cohort. In recent years, UC Riverside and UC Santa Cruz improved their four-year graduation rates by about seven and three percentage points, respectively. These improvements are due to factors including campus programs supporting four-year completion, improvements in academic preparation of incoming students, and the current cost of a UC education, all of which motivate students to complete their degrees.

UC’s freshman six-year graduation rate is 84 percent, which is almost a five percent increase over the past twenty years. The final graduation rate is 86 percent.

By 2030, UC is striving to raise four-year completion to 76 percent and six-year completion to 90 percent. UC is seeking financial support from the state to achieve these goals.

More information on trends in UC freshman graduation rates can be found here.

1 Comparison IPEDS data are available for more limited years. The AAU comparison institutions are in the data glossary. AAU comparison is for the 2011 cohort, the most recent data available. Graduation rates are weighted by total cohort size. Institutions with missing data are excluded for that year. Freshmen are those students who entered a university directly from high school and who have not matriculated at another postsecondary institution prior to enrollment. UC statistics give credit to the originating campus for inter-UC campus transfers. 


The six-year graduation rate of UC freshmen is close to 90 percent when students who finished their degrees at a non-UC institution are included. 

3.1.2 Freshman graduation rates, including those who graduated from a non-UC institution, Universitywide and UC campuses, Cohort entering fall 2012

 Freshman graduation rates, including those who graduated from a non-UC institution

Source: UC Data Warehouse and the National Student Clearinghouse1

The extended graduation rate of students who begin their studies as freshmen at UC includes those who transfer to a non-UC institution and complete their bachelor’s degree within four, five, or six years.

By this measure, UC’s overall six-year graduation rate is about 88 percent. The effect of the extended graduation rate varies by UC campus, with Berkeley having fewer students who earn a degree outside of the UC system, while the six-year rates at Merced, Riverside, Santa Barbara, and Santa Cruz improve by as much as four percentage points when students who complete their degree at a non-UC school are included.

1 Intercampus transfers within UC are counted as graduates of their originating UC campus. In this graph, non-UC rates only include those who transferred to non-UC institutions and graduated with a bachelor’s degree.


Nearly 60 percent of transfer students graduated within two years.

3.1.3 Transfer graduation rates, Universitywide and UC campuses, Cohorts entering fall 2014, 2015, and 2016 

 Transfer graduation rates

Source: UC Corporate Student System1

The two-year graduation rate for transfer students has been relatively consistent over the past three cohorts. The two-year graduation rate for transfers is currently at 57 percent, the highest since 1995. The four-year rate is 89 percent, compared to 84 percent for the six-year freshman graduation rate. The final graduation rate is above 90 percent. More information on trends in UC transfer graduation rates can be found here.

UC is striving to improve two-year graduation rates to 70 percent by 2030. UC is seeking financial support from the state to expand programs and services to achieve these ambitious goals.

1 Comparison data on graduation rates for transfer students are not available. UC statistics give credit to the originating campus for inter-UC campus transfers. Merced opened in 2005.


Underrepresented group (URG) students at UC graduate at higher rates when compared to URG students at other AAU public institutions.

3.1.4 Freshman graduation rates by race/ethnicity, Cohorts entering fall 2012, 2013, and 2014

Freshman graduation rates by race/ethnicity; Universitywide, AAU public, and AAU private

By 2030, UC is looking to eliminate graduation gaps for underrepresented groups.

More information on trends in UC freshman graduation rates by campuses and demographic detail can be found here.

UC and comparison institutions, cohort entering fall 2011

UC and comparison institutions, cohort entering fall 2011

Source: UC Information Center Data Warehouse and IPEDS.


Regardless of race/ethnicity, transfer students graduate at a high rate and the rate for two-year graduates is rising.

3.1.5 Transfer graduation rates by race/ethnicity, Cohorts entering fall 2014, 2015, and 2016

Transfer graduation rates by race/ethnicity

Source: UC Data Warehouse.

While ontime graduation gaps are smaller for transfer students than for students who enter as freshmen, gaps still remain. By 2030, UC is looking to eliminate graduation gaps for underrepresented groups and raise the overall ontime graduate rate.

More information on trends in UC transfer graduation rates by campus and demographic detail can be found here.


Over 82 percent of Pell students graduate within six years: Freshmen. 

3.1.6 Freshman graduation rates by Pell Grant receipt status, Cohorts entering fall 2012, 2013, and 2014

 Freshman graduation rates by Pell Grant recipient status

Source: UC Data Warehouse. Pell Grant recipients are those who received a Pell Grant at any time during their time at UC. 

Pell Grant recipients graduate at rates comparable to non-Pell recipients: 82 percent and 86 percent, respectively. Although there is a 12 percentage point gap at the four-year mark between Pell recipients (58 percent) and non-Pell recipients (70 percent), this gap is reduced to four percentage points at the six-year mark. For the 2014 cohort, Pell and non-Pell Grant recipients graduated at comparable rates of 88 percent and 90 percent, respectively, within four years.


Over 82 percent of Pell students graduate within six years: Transfer.

3.1.7 Transfer graduation rates by Pell Grant receipt status, Cohorts entering fall 2014, 2015, and 2016

Transfer graduation rates by Pell Grant recipient status

Source: UC Data Warehouse. Pell Grant recipients are those who received a Pell Grant at any time during their time at UC.

The two-year graduation rate gap between Pell and non-Pell Grant recipient transfer students is reduced to ten percentage points from the 2014 cohort to the 2016 cohorts. 

UC has adopted goals to eliminate graduation gaps by 2030 and is seeking funds from the state to support investment in programs and services needed to help achieve these ambitious goals.

More information on trends in graduation rates can be found here.


As graduation rates rise, undergraduate students at UC are also graduating more quickly.

3.1.8 Average time to degree, Fall 2011 entering freshmen and transfer cohorts

 Average time to degree

Source: UC Corporate Student System. Average time to graduation includes only students who graduated from UC within seven years.

The average time to earn a bachelor’s degree at UC has decreased fairly steadily since 1994. Students entering as freshmen take an average of 4.2 years, about seven percent less time than in 1994. For students entering as transfers, the average time to degree is 2.4 years, about 12 percent less than in 1994. More information on trends in UC time to degree can be found here.


Retention rates are high, but UC is monitoring possible declining trends. 

3.2.1 First-year retention rates, Cohorts entering fall 2008 to fall 2017

First-year retention rates

Source: UC Data Warehouse

The current universitywide retention rate is 93 percent. This is higher than non-UC AAU public institutions (92 percent), but lower than AAU private institutions (97 percent).

3.2.2 First-year retention rates, UC and comparison institutions, Cohorts entering fall 2016

First-year retention rates

Source: Freshman data from IPEDS1 Transfer data from UC Data Warehouse. Comparison data are not available for transfers.

For students leaving in good academic standing (GPA ≥ 2.0), some campuses are expanding honors programs or providing opportunities for undergraduate research as early as the freshman year. For those leaving in poor academic standing (GPA < 2.0), some UC campuses are using Summer Bridge or early orientation. Campuses are also looking into housing and residential programs and cohort programs to integrate undergraduates.

Like entering freshmen, transfer students benefit from a smooth transition to. Several UC campuses have summer programs to support transfer students. More information on trends in UC retention rates can be found here.

1 Freshmen are first-time, full-time, degree-seeking students from the fall who enroll again in the next fall term. The most recent available comparison data available from IPEDS is for 2016.


Social science, life sciences, and arts and humanities are the largest segments of bachelor’s degree recipients.

 3.3.1 Undergraduate degrees awarded by discipline, UC and comparison institutions, 2001–02 and 2016–17

 Undergraduate degrees awarded by discipline UC and comparison institutions

Source: IPEDS

About 40 percent of all undergraduate degrees awarded by UC in 2016–17 were in science, technology, engineering, and mathematics (STEM) fields. This is higher than the proportion at AAU public and private comparison institutions (36 and 37 percent, respectively).


Across disciplines, undergraduate degree recipients tend to double their earnings between two and ten years after graduation.

3.3.2 Inflation-adjusted average and median alumni wages by selected majors, two, five, and ten years after graduation, 2000 to 2015 graduating cohorts, combined

Inflation-adjusted average and median alumni wages by selected majors, two, five, and ten years after graduation

Source: California Employment Development Department and UC Corporate Student System. Includes alumni employed in the state of California only. Amounts are inflation-adjusted to 2017 dollars.

Alumni employment data provide evidence of UC’s contribution to the California economy and its role as an engine of economic mobility. UC enrolls a greater percentage of low-income students (from the bottom 20 percent of the income distribution) than other four-year institutions in California. Recent data made available through a partnership with the Equality for Opportunity Project show that more than one in three UC alumni who come from the bottom 20 percent of income rise to the top 20 percent of income as adults, based on the entering cohorts of 1999 to 2005. Moreover, comparisons using this national data show UC bachelor’s degree recipients working in California tend to earn about 20 percent more than UC graduates who work outside of California. More information on the Equality of Opportunity Project can be found here.


Engineering and computer science majors tend to earn more than other UC undergraduate alumni, but how much UC alumni make also depends on the industry.

3.3.3 Median alumni wages by industry of work for selected majors, five years after graduation, 2000 to 2011 graduating cohorts, combined

Median alumni wages by industry of work for selected majors, five years after graduation

Source: California Employment Development Department and UC Corporate Student System. Includes alumni employed in the state of California only. Amounts are inflation-adjusted to 2016 dollars. The size of bubble corresponds to percentage of alumni within majors employed in the industry. The largest bubble is 36 percent and the smallest is <1 percent.

UC graduates go on to work in a wide range of industries in California. A large share of Engineering and Computer Science majors work in the Internet & Computer Systems and Manufacturing industries, with median salaries of about $100K and $90K, respectively. Business majors are likely to work in the business services or finance & insurance industries where median earnings reach $72K to $78K. Arts & Humanities graduates are most likely to work in K–12 education, where median salaries are much lower, at about $54K at five years after graduation.


Thirty-eight percent of undergraduate degree recipients go on to earn a graduate degree, the majority of which are masters-level degrees.

3.3.4 UC undergraduate alumni graduate degree attainment by campus, 2000 to 2010 graduating cohorts, combined, as of June 2018

UC undergraduate alumni graduate degree attainment by campus

Source: UC Information Center

Earning a graduate degree is a major objective of many undergraduates who attend a research university. Nearly 40 percent of undergraduate students go on to earn a graduate degree after their undergraduate studies at UC.

The UC Information Center provides more details on graduate degree attainment by race/ethnicity, gender, Pell grant eligibility, and entry status. By 2030, UC aims to increase access to graduate degrees for populations that currently are less likely to attend graduate school.