chapter spotlight
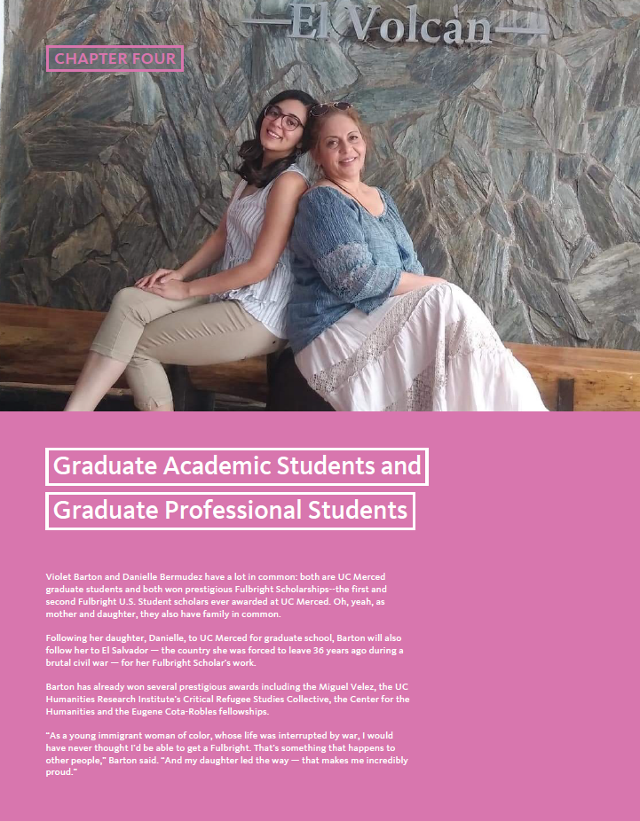
Violet Barton and Danielle Bermudez have a lot in common: both UC Merced graduate students and both won prestigious Fulbright Scholarships--the first and second Fulbright U.S. Student scholars ever awarded at UC Merced. Oh, yeah, as mother and daughter, they also have family in common.
Following her daughter, Danielle, to UC Merced for graduate school, Barton will also follow her to El Salvador--the country she was forced to leave 36 years ago during a brutal civil war--for her Fulbright Scholar's work.
Barton has already won several prestigious awards including the Miguel Velez, the UC Humanities Research Institute’s Critical Refugee Studies Collective, the Center for the Humanities and the Eugene Cota-Robles fellowships.
“As a young immigrant woman of color, whose life was interrupted by war, I would have never thought I’d be able to get a Fulbright. That’s something that happens to other people,” Barton said. “And my daughter led the way —that makes me incredibly proud.”
Goals
California’s Master Plan for Higher Education gives the University of California the responsibility of enrolling and preparing graduate academic and graduate professional students to help meet the needs of California and the nation and to further the UC mission of teaching, research, and public service. Thus, reviving adequate support for the University of California is important, as its graduate education enterprise fuels California’s role as a national and international leader.
UC’s goals for graduate education are to offer outstanding degree programs, advance research, support undergraduate instruction, and prepare students to join a professional workforce. UC produces the leaders of the future — the teachers, artists, thinkers, innovators, scientists, inventors, doctors, lawyers, and nurses; it creates an environment of exploration and discovery that stimulates innovation and invention. UC’s internationally renowned graduate education enterprise serves to drive California’s economy, allowing it to grow, create jobs, and offer its residents the standard of living for which the state is well known.
Types of graduate degrees
UC awards both graduate academic degrees and graduate professional degrees.
Graduate academic degrees — These include academic doctoral and academic master’s degrees in education, physical sciences, social sciences, arts, humanities, and engineering/computer science. Other doctoral degrees are offered in various disciplines (such as EdD in education, DrPH in public health, etc.). The largest proportion of graduate academic degrees awarded at UC is in the STEM fields — science, technology, engineering, and mathematics. From the 2014–15 to 2016– 17 academic years, more than two-thirds of UC graduate academic degrees were awarded in STEM fields.
Graduate professional degrees — UC’s professional degrees include professional master’s and professional practice degrees in fields such as law, medicine, nursing, business, education, architecture, public policy, and the arts. The graduate professional category includes professional master’s degrees (e.g., M.B.A., M.Ed.) and professional practice degrees (e.g., J.D., M.D.). In the field of medicine, UC offers the nation’s largest instructional program in health care and health sciences.
The University maintains multiple funding models for its graduate professional programs. Many state-supported programs (i.e., M.B.A., law, medicine, etc.) assess professional degree supplemental tuition (PDST), which allows the professional schools to ensure their excellence, accessibility, and inclusiveness, and assists with affordability (given the return-to-aid requirement for tuition revenue). Programs assessing PDST commit substantial resources to student financial support, including grants and scholarships. Since PDST began in 1994, both the number of professional degree programs that charge PDST and the amount charged have increased.
Other UC graduate professional programs, primarily master’s programs, follow a self-supporting funding model. The largest are business and management programs. These programs receive no state support and are funded entirely by revenues generated by the program and other non-state revenues. Self-supporting programs allow the University to serve additional students beyond those supported through state resources. They also fulfill higher education and workforce needs. Some self-supporting programs serve nontraditional populations such as full-time employees, mid-career professionals, and international students with specialized goals. Many programs are offered through an alternative mode of delivery, such as online or hybrid instruction, alternative scheduling, or at off-campus locations.
Graduate enrollment share
UC’s graduate education enterprise enrolls over 57,000 students, with doctoral students representing the largest number (27,000), and professional (23,000) and master’s (7,000) comprising the remainder. Despite its size, UC’s graduate education enterprise represents a smaller share of its total enrollment than that of its peers. Graduate students comprise 21 percent of total student enrollment at UC, which is lower than the proportion of graduate enrollment among other Association of American Universities public (27 percent) and private (55 percent) peer institutions. In addition, while the graduate share of UC’s total enrollment has remained relatively constant over the last decade at 21 percent, the doctoral enrollment percentage has declined. The graduate professional percentage has risen steadily (4.2.1). Despite these enrollment trends, UC research degree production is comparable to other public university competitors.
UC is proposing a multi-year framework that seeks to improve degree attainment and produce 200,000 more degrees through 2030, in addition to the projected one million degrees. About 12 percent of these additional degrees (over 25,000) would be at the graduate level.
Supporting diverse career paths and making research accessible
To promote and highlight the work of master’s and doctoral students across UC campuses, UC holds an annual research communication competition called UC Grad Slam. The event challenges its ten participants — the winners of each campus’s own Grad Slam — to distill years of academic research into a three-minute presentation free of technical lingo. Grad Slam encourages students to communicate their research in a clear and compelling way to non-specialists — a skill that employers need and value. Campuses provide workshops and resources for students to develop this skill set. The contest also demonstrates to the public that UC research benefits their lives in both ordinary and quite extraordinary ways. The winner of Grad Slam 2019 was UC Davis student Katie Murphy. Known as the “Corn Queen” to her friends and colleagues, Murphy’s research shows how chemical compounds help corn defend itself against pathogens.
Career Pathways Survey
In 2017, UC launched the Ph.D. Career Pathways Survey, which is a partnership between the University of California and the Council of Graduate Schools. The survey will be conducted in three phases through 2020, and its purpose is to better understand the career preparation and pathways of Ph.D. students and alumni. While the Council of Graduate Schools is specifically focused on humanities and STEM Ph.D.’s, the University of California is collecting data from doctoral students and alumni in all disciplines.
Initial results showed high levels of employment and satisfaction with UC Ph.D. programs. Ninety-two percent of respondents were working in a job for pay, 69 percent indicated they were working in a field closely related to their degree, and 54 percent were employed at a higher education institution. Eighty-eight percent of respondents stated that their Ph.D. training prepared them well for their current job, 76 percent stated that they would pursue a Ph.D. in the same field, and 80 percent indicated they would choose the same institution for their Ph.D. education if given the opportunity to choose again.
Equity and inclusion: Expanding academic pathways
A more diverse community of scholars at all levels has been a longstanding goal for UC, but progress at the doctoral, postdoctoral, and faculty levels has been slow. UC’s difficulties reflect challenges in both enrolling individuals from underrepresented groups in doctoral programs and in attracting and hiring them as postdoctoral scholars and faculty. Systemwide initiatives aimed at increasing the diversity of UC’s academic community include:
UC LEADS – The University of California Leadership Excellence through Advanced Degree program prepares promising UC undergraduate students for advanced education in science, technology, engineering, and mathematics (STEM) fields. The program prepares underrepresented UC undergraduate students for doctoral education opportunities at a UC campus. From its inception in 2000–01 through 2017–18, 1,019 scholars participated in UC LEADS. Of the 851 Scholars who have graduated with their undergraduate degree, 645 (76 percent) are either currently enrolled in graduate school or have already earned degrees in a master’s or doctoral program. Given the importance of gender and ethnic equity within STEM-based doctoral programs, it is notable that 50 percent are women, 53 percent are first-generation college students, and 52 percent are from underrepresented minority groups. Thirty UC LEADS alumni are tenure-track faculty, including seven at UC.
UC-HBCU Initiative – The University of California-Historically Black Colleges and Universities (UC-HBCU) Initiative was established to increase the number of African Americans completing Ph.D.’s at UC by investing in relationships between UC faculty and HBCUs. The program has raised UC’s profile within the HBCU community and facilitated faculty research collaborations in addition to enrolling and retaining students. More information about the UC-HBCU Initiative is presented in Chapter 7.
University of California President’s Postdoctoral Fellowship Program (PPFP) – The PPFP was established to encourage outstanding women and minority Ph.D. recipients to pursue academic careers at UC. The program offers postdoctoral research fellowships, professional development, and faculty mentoring to outstanding scholars in all fields whose research, teaching, and service will contribute to diversity and equal opportunity at UC. More information about the PPFP is presented in Chapters 5 and 7.
Looking ahead
The University continues to develop programs to enhance the graduate student experience. UC’s overall excellence rests on the strength and scope of its graduate programs. Unlike undergraduate enrollment planning, which is based on California’s Master Plan, graduate enrollment planning includes the assessment of state and national needs, faculty expertise, program quality (which includes international competitiveness), and financial support. In early 2018, Provost Michael Brown convened a workgroup on graduate education to examine the adequacy of doctoral student financial support, both as compared to other institutions and in light of rapidly growing living costs in California. This is a subcommittee of the Academic Planning Council, which is examining and addressing issues in graduate education such as providing multiyear guaranteed funding packages, prioritizing mental health and well-being, actively improving diversity and inclusion, and improving professional development support. The workgroup is expected to report its findings and recommendations to the provost in early summer 2019.
For more information
Universitywide graduate academic applications have increased substantially since 2010, while admits and new enrollments have remained relatively flat.
4.1.1 Graduate academic applications, admits and new enrollees by degree program and citizenship, Universitywide, Fall 2010 to Fall 2018
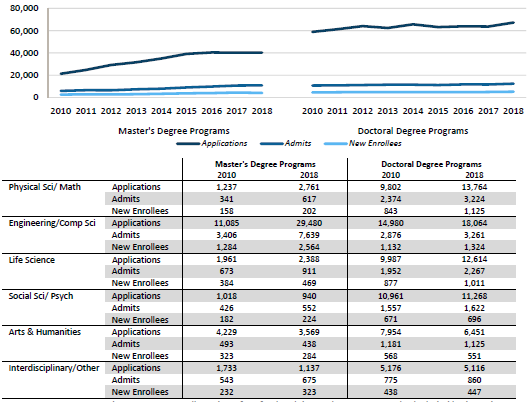
Source: UC Corporate Student System. A small number of professional doctoral programs are also included in these data. Universitywide applications and admits are duplicated in this report since students often apply to more than one campus.
The demand for UC academic master’s and doctoral programs has increased steadily since 2010. Applications for admission grew from 80,000 in 2010 to 107,500 in 2018. Nearly all of this increased demand has come from prospective international students, with international applications growing from 34,400 to 62,400 — a rate of almost eight percent per year. Engineering and computer science programs have significantly higher demand from international students than do other disciplines. Recent survey data compiled by the Council of Graduate Schools show a similar nationwide trend of growth in applications from international students, with engineering as the most popular field for international applicants.1
Since 2010, admits increased from 16,500 to 23,100 in 2018, and new enrollments increased from 7,200 to 9,200. Though applications are now predominantly (58 percent) from international students, both admits and new enrollments of domestic students exceed those of international students.
1Council of Graduate Schools International Admissions Survey
Since 2010, the number and share of graduate academic admissions have significantly increased for international students.
4.1.2 Graduate academic applications, admits, and new enrollees by race/ethnicity and discipline, Universitywide, Fall 2010 and 2018
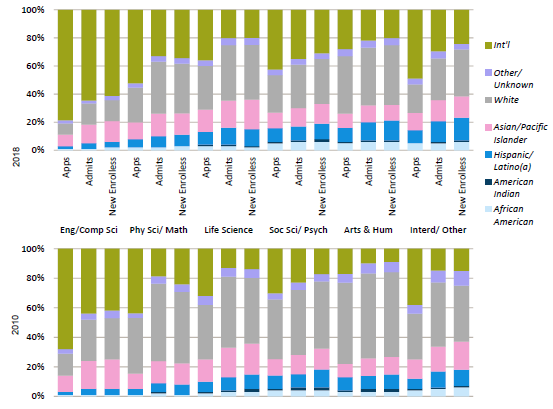
Source: UC Data Warehouse
International students represent the majority of applicants, admits, and new enrollees in engineering and computer science graduate programs. The share of international students in all other disciplines also increased between 2010 and 2018. Social science and humanities programs have the highest shares of enrollment among underrepresented minority students, and those shares increased between 2010 and 2018.
Graduate enrollment, as a share of UC’s total undergraduate and graduate enrollment, has remained relatively steady since 2000.
4.2.1 Graduate enrollment share of total, Universitywide, Fall 2000 to Fall 2018
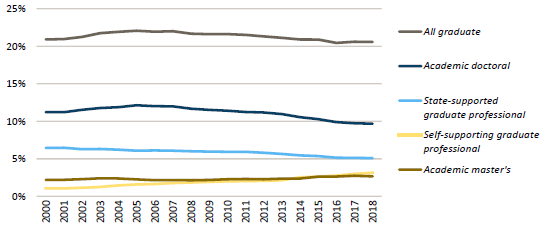
Source: UC Corporate Student System. Academic master’s students include post-baccalaureate, teaching-credential students. Graduate professional includes professional master’s (e.g., M.B.A., M.Ed.) and professional practice (e.g., J.D., M.D.) degrees.
With 21 percent graduate enrollment in 2018, including health science students, UC was lower than the average for non-UC AAU1 public institutions, at 27 percent, and the average for AAU private institutions, at 55 percent.
In fall 2018, the proportion of academic doctoral students varied across UC’s general campuses, from seven percent at Merced and Santa Cruz to 13 percent at Berkeley. At San Francisco, an exclusively graduate health-sciences campus, academic doctoral students made up 27 percent of fall 2018 enrollments. Since 2008, the share of academic doctoral students has declined at most campuses due to more rapid growth in the undergraduate, master’s, and professional populations.
UC awards 20 percent of California’s graduate academic master’s degrees, 62 percent of its academic doctoral degrees, and 21 percent of its graduate professional practice degrees.
| Percent of students who are academic doctoral |
|
Fall 2008 |
Fall 2018 |
| San Francisco |
29% |
27% |
| Berkeley |
17% |
13% |
| Los Angeles |
12% |
11% |
| Davis |
11% |
9% |
| Santa Barbara |
11% |
9% |
| San Diego |
11% |
9% |
| Riverside |
10% |
9% |
| Irvine |
10% |
8% |
| Santa Cruz |
7% |
7% |
| Merced |
6% |
7% |
| Universitywide |
12% |
10% |
|
(25,922) |
(27,249) |
Source: UC Data Warehouse
1A list of the institutions in the AAU comparison groups can be found in the data glossary.
UC net stipends remain below competitive offers, but the gap decreased substantially between 2010 and 2017.
4.2.2 Average net stipend offered to graduate academic doctoral students admitted to UC compared with their first-choice non-UC schools, Universitywide, 2010, 2013, and 2017
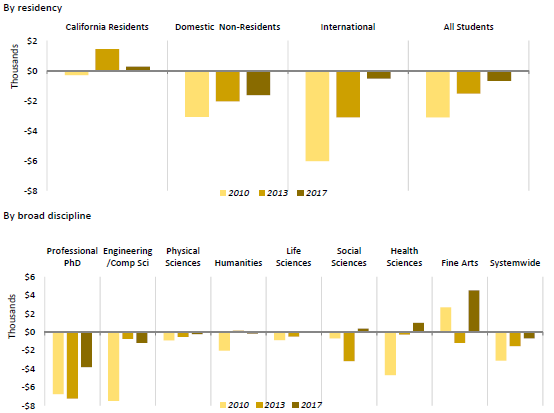
Source: UC Graduate Student Support Survey. Graduate academic professional doctoral programs include EdD, D.Env., DrPH., D.P.T. and D.N.S.
Doctoral students are crucial to a university’s research enterprise and instructional programs. To attract the most highly qualified applicants, universities offer aid packages that include the cost of tuition and stipends. Net stipend is the amount of aid that students have for living expenses after tuition and fees are paid. It does not include loans that the student may be offered. The “stipend gap” varies by discipline, as shown in the chart above. Since 2010, UC has made considerable progress in closing the net stipend gap with competing institutions, reducing it from $3,000 to about $700 in 2017. However, a considerable gap remains between UC’s average net stipend and growing living costs in California.
More than half of UC doctoral students graduate without debt. Doctoral students in the physical and life sciences have seen smaller increases in debt since 2003-04, and graduate with less average loan debt than those in the social sciences and arts and humanities.
4.2.3 Academic doctoral students’ graduate debt at graduation, by discipline, domestic students, Universitywide, Graduating classes of 2003-04 to 2017-18 (every two years)
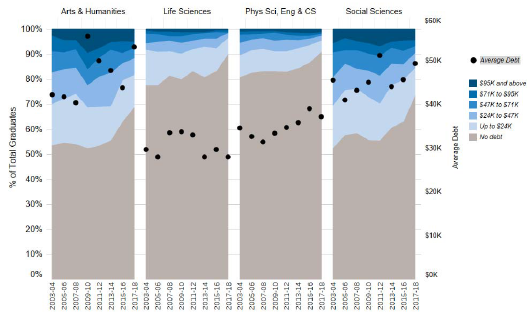
Source: Corporate Student System1
Depending on the field of study, between 70 percent (arts and humanities) and 90 percent (physical and life sciences) of UC doctoral students take on no additional debt during graduate school.
Several factors account for the difference in debt burden between doctoral students in the physical and life sciences and those in other disciplines. Physical and life science students are more likely to be supported by research grants. In addition, their programs take less time on average to complete than do programs in the social sciences or arts and humanities.
1Debt categories are inflation-adjusted in 2017 dollars using CA CPI-W. “Other” includes interdisciplinary and professional fields. Life sciences include health sciences.
Graduates with the highest debt levels come from professional schools that charge higher supplemental tuition.
4.2.4 Graduate professional degree student debt at graduation, by discipline, domestic students, Universitywide, Graduating classes of 2003–04 to 2017–18 (every two years)
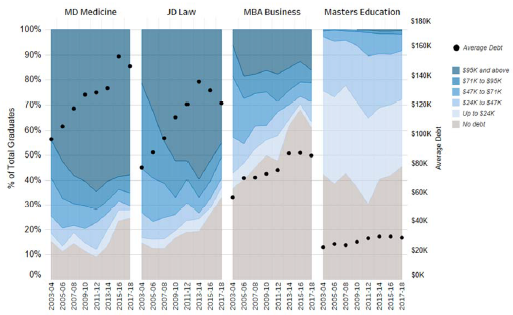
Source: UC Corporate Student System1
On average, about 55 percent of the aid awarded to graduate professional degree students comes in the form of loans rather than fellowships or grants. By comparison, loans constitute less than five percent of the aid awarded to graduate academic students. Graduate funding models require greater reliance on loans for professional degree students as their programs are of shorter duration, and many fields offer potentially higher incomes after graduation.
Most graduate professional degree students finance part of their education by borrowing. The increases since 2002–03 in average inflation-adjusted debt levels of graduating professional degree students vary considerably. Increases in graduate debt result from a combination of factors, including steady growth in tuition, cost of living increases, and greater student reliance on federal student loan programs.
1 Average debt is among graduates with debt. Debt categories are inflation-adjusted in 2017 dollars using CA CPI-W.
Like other major research universities, UC awards a high proportion of graduate academic degrees in science, technology, engineering, and mathematics (STEM) fields.
4.3.1 Graduate academic degrees awarded by discipline, UC and AAU private and public comparison institutions, Number of degrees grouped in 3-year intervals: 2005–06 to 2007–08, 2008–09 to 2010–11, 2011–12 to 2013–14, 2014–15 to 2016–17; campus-level data for 2014–15 to 2016–17
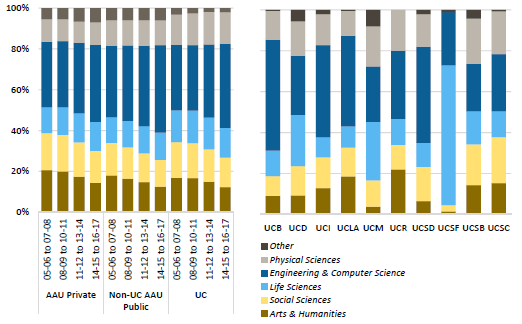
Source: IPEDS1
UC graduates have had major impacts on the nation and the world — creating much of California’s biotechnology and computer industries, developing research breakthroughs that have led to major medical advances, shaping ideas about our world and culture, creating the economic and social infrastructure of our communities, and assuming political leadership in California and the nation.
UC’s graduate STEM programs reflect the predominant industries in California’s economy. In addition to leading all California institutions in the production of engineering and computer science degrees, UC far outpaces them in the production of degrees in the biological sciences — key to driving the growth of California’s biotechnology sector.
More than 25 UC Ph.D. recipients have been awarded Nobel Prizes.
Since2005–06, the number of graduate academic degrees awarded at UC grew by 25 percent, compared to 43 percent at the group of AAU private institutions and 27 percent for the group of non-UC AAU public institutions.
1"Other" includes interdisciplinary and academic degrees in otherwise professional fields, such as architecture, communications and public administration.
UC’s doctoral completion rate increased in nerly every field over the two most recent cohorts studied.
4.3.2 Doctoral completion rates after ten years, by broad field, Universitywide, Fall 2000-2002, 2003-2005, and 2006-2008 entry cohorts
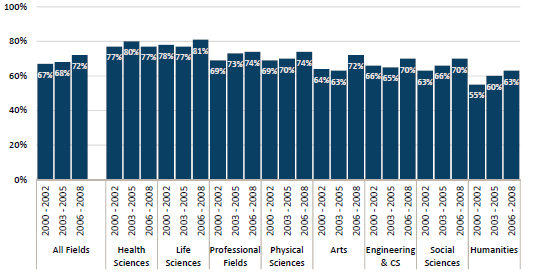
Source: UC Corporate Student System
The Universitywide ten-year doctoral completion rate across all fields for the fall 2006–08 entering cohorts was 72 percent. This is an increase from the 68 percent completion rate reported for the 2003–05 cohort. Among broad disciplines, life sciences and health sciences continue to have the highest completion rates. Engineering and computer sciences, social sciences, and humanities showed the lowest rates, owing to the longer normative time in those fields and different financial support models, although both experienced an increase compared to previous cohorts.
The overall improvement in ten-year completion rates may be attributed to at least two factors. First, student demographics have shifted to include a larger percentage of international students, who, as a group, have a higher ten-year completion rate than the overall cohort’s rate. (A variety of factors influence this difference, including different tuition rates for international students.) Second, shifts over time in enrollment toward disciplines with higher completion rates (STEM fields) affect the overall ten-year completion rate.
The Doctoral Completion Rates dashboard is available here.
UC median ten-year time-to-doctorate by ethnicity and gender compares well with AAU institutions.
4.3.3 Median ten-year time-to-doctorate, by ethnicity and gender, Universitywide, AAU public and AAU private comparison institutions, 2012 to 2014 exit cohort
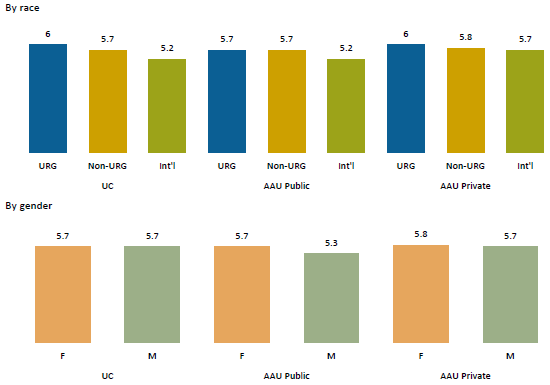
Source: Survey of Earned Doctorates, National Opinion Research Center
The median number of years required to complete a doctoral degree at UC (elapsed time-to-doctorate) is comparable to that at other major research universities. Men and women complete the doctorate in about the same amount of time at UC, compared to AAU public institutions where women’s time-to-doctorate is nearly half a year longer than men’s. Students from underrepresented groups (URG) have slightly longer time-to-doctorate at UC and comparison institutions, whereas international students required substantially less time to complete the doctorate.
The Time to Doctorate dashboard is available
here.
UC median ten-year time-to-doctorate varies by ethnicity, gender, and discipline.
4.3.4 Median ten-year time-to-doctorate, by ethnicity, gender, and discipline, Universitywide, 2015 through 2017 exit cohort
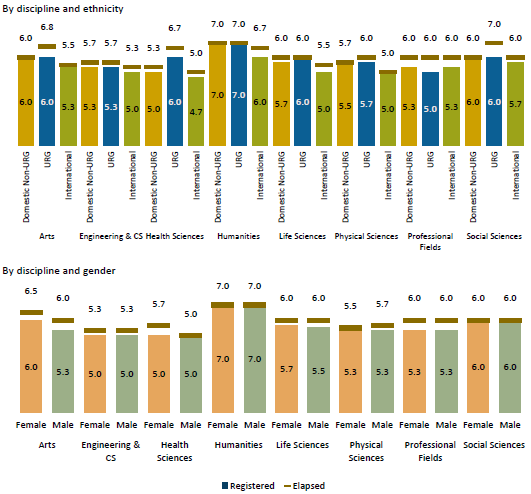
Source: Survey of Earned Doctorates. Excludes UC Merced.
In three of eight disciplines, students from underrepresented groups (URG) have higher registered time-to-doctorate (RTD) than non-URG and international students. URG students have slightly lower RTD than non-URGs in the professional fields. The elapsed time-to-doctorate (ETD) for URGs are higher than or equal to non-URGs. International students generally have lower ETD and RTD in all disciplines.
Men and women generally have comparable time-to-doctorate, with exceptions in health sciences, where women have a longer ETD, and the arts, where women have a longer ETD and RTD.
The Time to Doctorate dashboard can be found here.
More than half of UC’s academic doctoral degree recipients plan to stay in California, a greater share than those who attended high school or college in California.
4.3.5 Origin and planned destination of UC academic doctoral degree recipients, Universitywide, 2010–11 to 2015–16
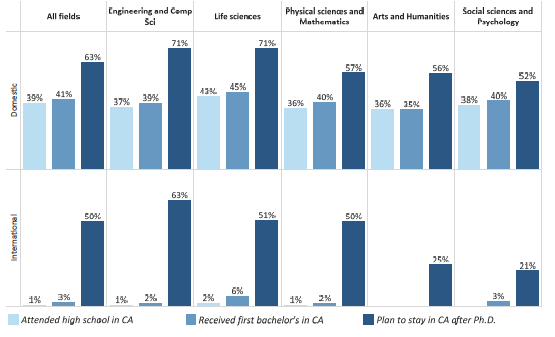
Source: Survey of Earned Doctorates. Excludes UC Merced.
The most recent data for UC’s doctoral degree recipients, based on those graduating between 2010–11 and 2015–16, show that over half plan to stay in California. Sixty-three percent of domestic doctoral degree recipients intend to stay, though only 41 percent of this cohort received their bachelor’s degrees in California, and only 39 percent attended high school in California. This proportion is higher in science, technology, engineering, and mathematics (STEM) fields, indicating that UC graduates are contributing to California’s robust economy in these areas.
Though a negligible share of UC’s international (not a U.S. citizen nor permanent resident) doctoral recipients attended high school or college in California, half intend to stay after graduation.
The Survey of Earned Doctorates (SED) is conducted for all individuals receiving a research doctoral degree. It is sponsored by the National Science Foundation, National Institutes of Health, U.S. Department of Education, U.S. Department of Agriculture, National Endowment for the Humanities, and NASA.
Half of UC academic doctoral and master’s graduates who stay in California work in higher education.
4.3.6 Industry of employment of UC graduate academic students in CA, by year after graduation, Universitywide, 2000 to 2015 graduating cohorts
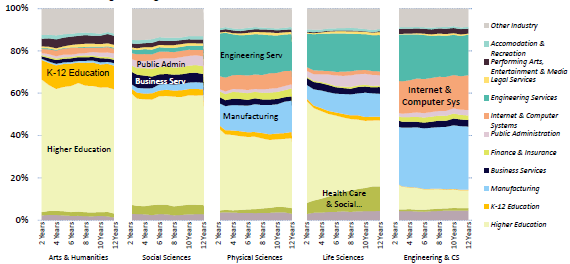
Source: California Employment Development Department and UC Corporate Student System
Note: Includes very small numbers of graduate professional students, who do not affect the overall picture.
More than 30,000 graduates of UC academic doctoral and master’s degree programs in fields other than engineering/computer science have entered the California workforce since 2000. Over half of them (51 percent) have gone on to work in the state’s higher education workforce, which includes all of the two-year and four-year colleges, both public and private. This highlights the critical role of UC’s graduate academic programs in producing the cadre of faculty who teach California’s future college-educated workforce and conduct research that advances the state and national economies.
The contributions of UC academic doctoral and master’s graduates to the state workforce go beyond higher education. About 11 percent of the employed graduates of UC physical sciences and life sciences programs work in the state’s manufacturing sector, while another 18 percent work in the engineering industry. This shows that the skills gained in UC academic doctoral and master’s programs are both applicable and relevant to key high-tech industries.
UC graduate academic programs in engineering and computer science supply workers to the state’s high-skilled and high-tech industries. Since 2000, over 18,000 graduates of these programs have entered the California workforce, with 35 percent working in the manufacturing sector and 30 percent working in engineering services. Another 22 percent go on to work in the state’s fast-growing internet and computer services industry. About 14 percent of engineering and computer science graduates go on to teaching and research positions in the state’s college and university systems.
The job market for doctoral and master’s degree recipients is nationwide, and those who leave California are not tracked in this data source.
Like other major research universities, UC awards a high proportion of professional degrees in business.
4.4.1 Graduate professional degrees awarded by discipline, UC and AAU private and public comparison institutions, Number of degrees grouped in 3-year intervals: 2005–06 to 2007–08, 2008–09 to 2010–11, 2011–12 to 2013–14, 2014–15 to 2016–17
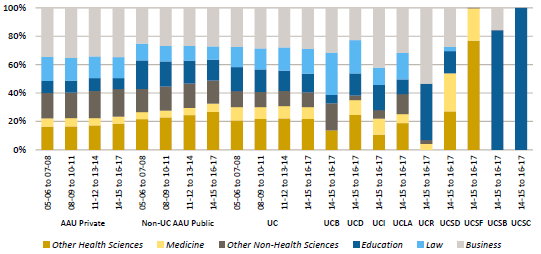
Source: IPEDS1
The proportion of professional degrees awarded by UC is comparable to AAU private and public institutions, with the greatest proportion of degrees awarded in business. The number and size of graduate professional degree programs vary by campus, with UCLA awarding the greatest number of professional degrees.
UC is also showing a growth in the proportion of law degrees, in part due to the School of Law at UC Irvine, which opened in 2006.
Since 2003, UC has opened new professional schools in several other areas, including the Rady School of Management at UC San Diego in 2003, the School of Medicine at UC Riverside in 2013, and the Sue and Bill Gross School of Nursing at UC Irvine in 2017.
1 UC Merced has no professional degree students. “Other” includes disciplines such as public administration, architecture, communications and library science.
UC professional programs prepare graduates for careers related to their field of study.
4.4.2 Industry of employment of UC graduate professional students in California, by year after graduation, Universitywide, 2000 to 2015 graduating cohorts
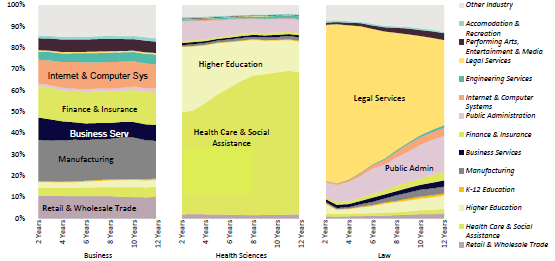
Source: California Employment Development Department and UC Corporate Student System1
Graduates of UC Master of Business Administration (MBA) programs contribute significantly to the state’s high-skilled and high-tech industries. The 18,000 UC MBA graduates who have entered the California workforce since 2000 have worked in a wide array of industries, including manufacturing (26 percent), finance and insurance (20 percent), retail and wholesale trade (18 percent), and internet and computer systems (20 percent).
Over 10,000 graduates of UC health science professional practice programs (e.g., M.D., D.D.S., Pharm.D.) have gone on to work in California since 2000. The majority of these graduates (61 percent) go on to work in the state’s health care and social assistance sector. This highlights UC’s role, per the Master Plan, as the state’s sole public provider of many health science professional practice degrees and validates UC’s success in fulfilling that role. UC health science graduates also play key roles in other areas of public service in the state, including 35 percent who go on to work in the state’s higher education system and 13 percent who work in state government.
UC law school graduates go on to work in two main areas — legal services and government. Of the 9,300 UC law school graduates who have worked in California since 2000, about 79 percent eventually find positions in the legal services industry. Another 14 percent go on to work in the public sector as government prosecutors and public defenders, and in other public agency roles. A large percentage of law school graduates start off in legal services initially after receiving their degree (76 percent), but by ten years after graduation this percentage has fallen to about 48 percent. The percent of UC law school graduates in government rises from seven percent to 15 percent over the same period.
1 Includes very small numbers of graduate academic students (e.g., Ph.D. business), which do not affect the overall picture.