chapter spotlight
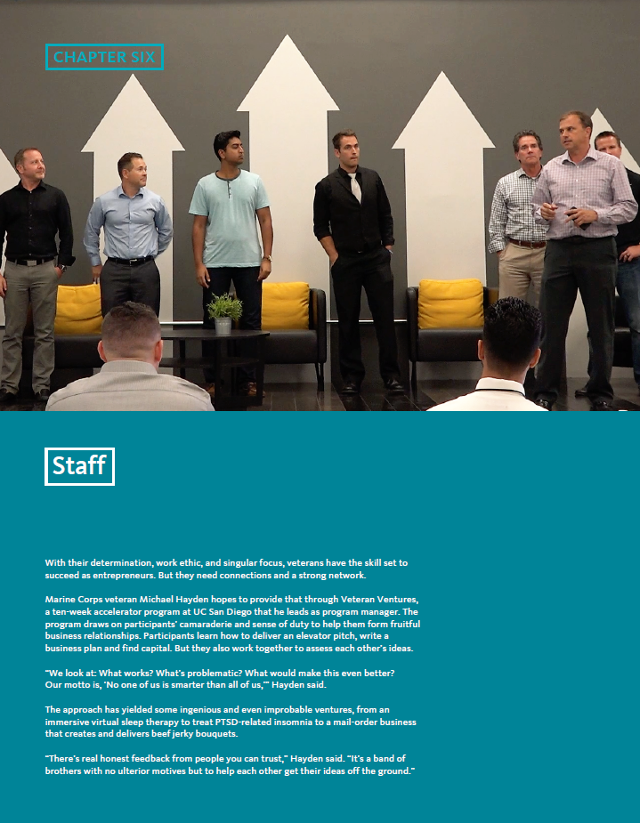
With their determination, work ethic and singular focus, veterans have the skill set to succeed as entrepreneurs. But they need connections and a strong network.
Marine Corps veteran Michael Hayden hopes to provide that through Veteran Ventures, a 10-week accelerator program at UC San Diego that he leads as program manager. The program draws on participants’ camaraderie and sense of duty to help them form fruitful business relationships. Participants learn how to deliver an elevator pitch, write a business plan and find capital. But they also work together to assess each other’s ideas.
“We look at: What works? What’s problematic? What would make this even better? Our motto is, ‘No one of us is smarter than all of us,’” Hayden said.
The approach has yielded some ingenious and even improbable ventures, from an immersive virtual sleep therapy to treat PTSD-related insomnia to a mail-order business that creates and delivers beef jerky bouquets.
“There’s real honest feedback from people you can trust,” Hayden said. “It’s a band of brothers with no ulterior motives but to help each other get their ideas off the ground.”
Overview
The three-pronged mission of the University of California includes undergraduate, graduate, and professional education, research, and public service, none of which can be accomplished without the support of staff who organize and facilitate all that is required to do the work of the University.
Non-academic staff employees constitute nearly 75 percent of UC’s workforce and are responsible for health services, student services, instruction and research support, compliance, and general administration (6.1.1). In October 2018, this group included 157,433 individuals, with about 36 percent of them part-time. Many of these part-time employees are student workers. Overall, this workforce represented 114,568.7 full-time equivalent (FTE) employees in that month.
Staff groups and workforce diversity
- UC Health employs over half of staff FTE (62,699.1) as doctors, nurses, administrators, technicians, and allied health professionals. About 97 percent of these employees are supported by non-core funds, typically the revenues generated by hospital services.
- Student workers for the general campus (non-health) are predominately part-time. While their headcount is 34,731, they comprise only 8,485.7 FTE. Students often work on campus as part of their financial aid packages or for research experience.
- General campus, non-student staff are the remainder, at 43,383.9 FTE. This includes student services employees, librarians, IT specialists, research administration, laboratory staff, food and auxiliary service workers, accountants, maintenance and janitorial staff, safety workers, and analysts (6.1.1).
UC is dedicated to building a more diverse workforce, particularly including those from underrepresented racial and ethnic populations in the U.S. Staff at UC are majority female and increasingly ethnically diverse across all employee groups. However, there are variations among the different employee groups, with less diversity and female representation among senior positions. A more diverse academic and staff population is an increasingly important measure of a great university.
Staff compensatioN
Over the past decade, UC has relied less on core funds (state funds, tuition and fees, and other general funds) to cover staff. While UC has over 20,000 more staff than ten years ago – largely due to UC Health and Student Staff growth – nearly 2,200 fewer FTE are paid on core funds (6.2.1). Even as tuition has increased to cover losses in state funding, less than 20 percent of staff are paid using core funds of any type.
General campus career staff salaries have stayed relatively flat compared to inflation for the past 15 years and have increased modestly for some UC Health professionals. Staff salaries tend to lag behind comparable market positions, and the lack of increases beyond inflation could affect staff satisfaction and turnover (6.2.2, 6.2.3). Chancellor and system leader compensation falls on the lower end when compared to peer institutions (6.2.4).
Staff separations and satisfaction
UC’s separation rate among career staff is about 9.2 percent (6.3.1), which has been relatively steady for the past decade. About 23 percent of staff separations are due to retirement and reflect the baby-boomer generation exiting the workforce. Still, a large portion of separations is due to resignation for other reasons (6.3.2). The 2017 UC Overall Employee Engagement Survey shows some improvement since 2015 in engagement, communication, and performance management, but that UC is still below the national norm in eight out of nine employee satisfaction categories.
For more informatioN
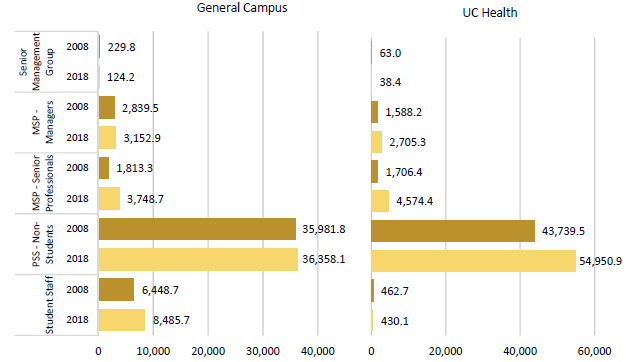
UC Health staff has grown significantly as health services have expanded, while general campus, non-student support staff growth has lagged behind enrollment over the past decade.
6.1.1 Staff Full-time Equivalent (FTE), Universitywide, October 2008* to 2018
Source: UC Corporate Personnel System
* The Oct 2008 Senior Management FTE includes 81 positions (mostly Deans) that in 2010 were recategorized as academic employees. Excludes Lawrence Berkeley National Laboratory, Hastings School of the Law, and Associated Students UCLA.
UC operates six health systems with five academic medical centers as well as schools of medicine, dentistry, nursing, and other health sciences education and research programs. Altogether, UC Health accounts for nearly 75 percent of non-academic staff growth over the past ten years. The growth has been driven by service expansions such as increases in inpatient days as well as outpatient/emergency visits. General campus student employees increased by 2,037 FTE, largely related to the additional 60,000 students UC enrolled over this period. Increased enrollment translates to more student employees working on campus as part of their financial aid packages.
General campus, non-student staff has seen the greatest growth amongst Senior Professionals, due to both the implementation of Career Tracks and the professionalization of UC’s workforce towards higher-skilled analysis and technical capabilities. Career Tracks is a function-specific, market-aligned job classification system that applies consistent interpretations of which positions are Management and Senior Professional (MSP) and which are Professional and Support Staff (PSS). Within PSS, there has been a significant shift away from clerical roles into student services positions and administrative analysis to manage growing campuses and student bodies.
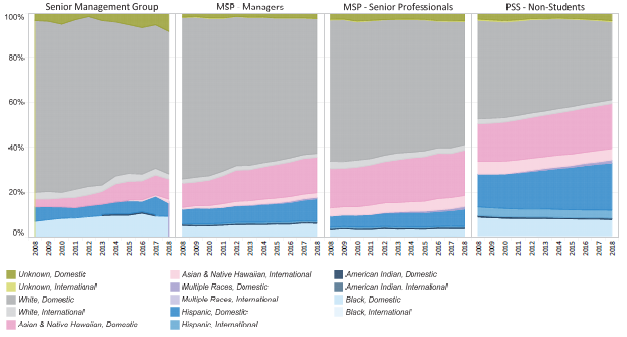
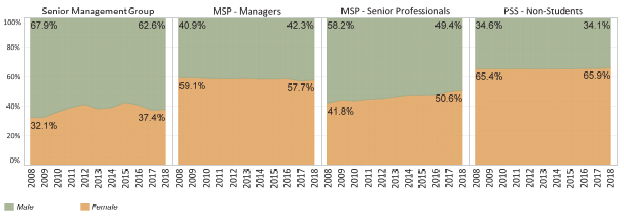
The proportion of nonwhite staff has grown modestly at all levels in the last decade. Female representation has grown at the Senior Professional levels, and has stayed high at the Manager and Support Staff levels.
6.1.2 Racial/ethnic diversity of non-student staff by personnel program, Universitywide, October 2008 to 2018
6.1.3 Gender diversity of non-student staff by personnel program, Universitywide, October 2008 to 2018
Source: UC Corporate Personnel System
UC has sought to improve representation of historically underrepresented domestic racial/ethnic groups. Diversity has increased steadily at all staffing levels; however, management and more senior positions are notably less diverse. Manager and PSS positions are well over 50 percent female. The percentage of female employees has grown steadily within the Senior Management Group (SMG), while Senior Professionals have nearly equal gender representation.
Since 2008, the number of staff supported by core funds has fallen as state funding for the University has decreased. Non-core funds supported all of the UC Health and non-student, general campus staff increases over the past decade.
6.2.1 Non-student staff FTE by fund source, October 2008 and 2018
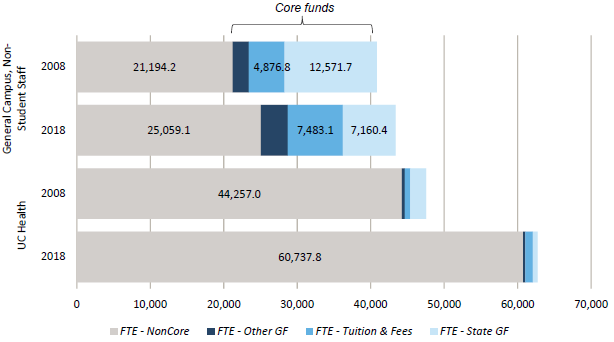
Source: UC Corporate Personnel System
General campus employees are increasingly paid with non-core funds such as research funds, auxiliary revenues, and other sources. Though overall general campus staff increased modestly, overall core-funded staff has decreased. This is due to a drop of over 5,400 FTE in state-funded staff, which more than offsets the increases in staff funded by tuition and fees as well as other general funds.
UC Health almost exclusively relies on non-core funds, particularly from hospital revenues, to support its staff. Despite adding more than 16,000 FTE, even fewer FTE today are paid on core funds than ten years ago.
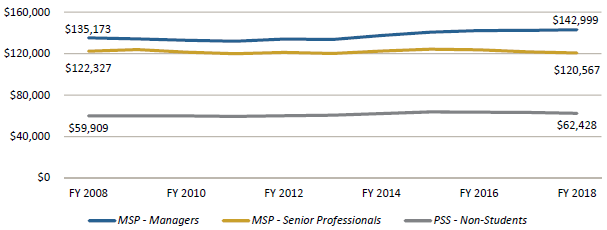
In the past decade, inflation-adjusted salaries have been relatively flat for general campus staff, with moderate increases for some UC Health staff.
6.2.2 General campus career staff average inflation-adjusted base salaries by personnel program, FY 07-08 to 17-18
6.2.3 UC Health career staff average inflation-adjusted base salaries by personnel program, FY 07-08 to 17-18
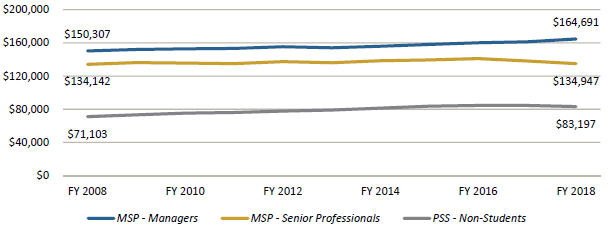
Source: UC Corporate Personnel System; California CPI-W used for inflation adjustment
Over the past ten years, salaries in real dollars have increased modestly for general campus career Managers and Support Staff, and have decreased slightly for Senior Professional staff. At the same time, UC employees are contributing more to health care costs and to the UC retirement system, putting downward pressure on the competitiveness of UC’s total compensation compared with the regional labor markets where University centers are located.
Salaries among UC Health career staff have been increasing moderately in real dollars for Professional and Support Services (PSS) staff and for Managers. This reflects market trends in wages for hospital staff and growing demand for health care professionals. These UC employees are also contributing more to health care costs and to the UC retirement system.
UC chancellors are among the lowest-paid when compared to their Association of American Universities (AAU) peers. The UC president’s salary also remains modest compared to public peers.
6.2.4 Base salaries and additional pay for UC and AAU institution leaders
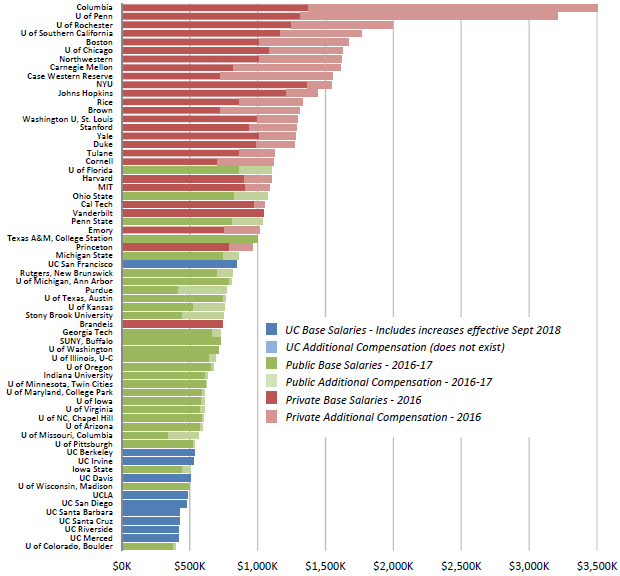
Source: The Chronicle of Higher Education Executive Compensation Report and institutional data sources
UC chancellors continue to place among the lowest-paid university leaders compared with their AAU peers. Nine UC chancellor salaries fall among the lowest quarter in this group. UC San Francisco, an exclusively graduate health science campus, is the only exception.
Among public system leaders (a chancellor or president who administers or coordinates multiple campuses), the compensation for UC’s president ranked 75th, even with a budget twice as large as the next comparator. The UC president’s compensation has not increased since September 2013.
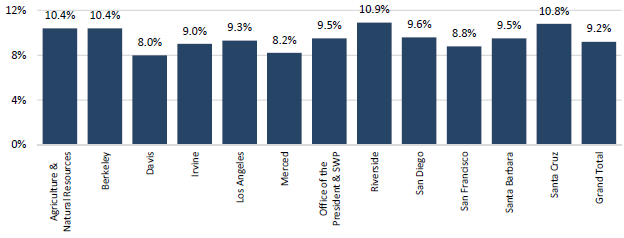
Separation among staff is about 9.2 percent, with significant campus variation. Retirement is the number one reason for separation.
6.3.1 Separation rates for career staff by campus and overall, FY 2017-18
6.3.2 Separation reasons for career staff, FY 2017-18
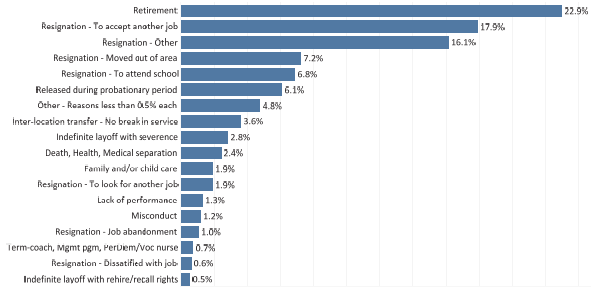
Source: UC Corporate Personnel System
Campuses experience a wide range of separation rates among their career staff, which may reflect different mixes of employees and different work environments. High turnover is often costly in terms of lost productivity, lost institutional knowledge, and replacement costs.
Nearly 23 percent of separations are due to retirement, a result of the aging baby-boomer population. While about half of separations are resignations, 27 percent of those are due to people moving away or choosing to attend school.