Executive Summary
As part of its transparency efforts, the University of California produces the UC Accountability Report to provide greater awareness of University operations. This report, along with the online UC Information Center (ucal.us/infocenter), allows the public to learn more about the University, and UC leadership to identify areas of strength and opportunities for improvement for the system and UC campuses.
The 2021 UC Accountability Report Executive Summary highlights accountability indicators relevant to goals associated with the University of California’s multi-year plan: UC 2030. The UC 2030 plan is a collective effort of UC leadership — the President, Chancellors, and Board of Regents, in consultation with the Academic Senate — to help California cope with a serious shortfall in the number of college-educated people in the workforce and other struggles facing the state.
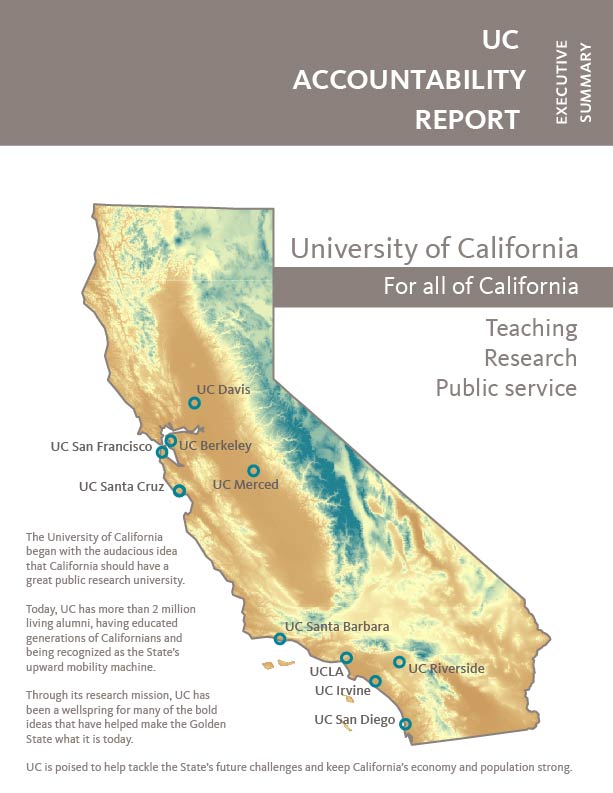
For more than 150 years, UC has served California and its people. The University has educated generations of Californians who have gone on to support the state as civic leaders, educators, scientists, doctors, business owners, taxpayers, and engaged citizens. UC has also been a wellspring for many of the bold ideas that have helped make the Golden State what it is today. Propelled by advances in technology and education, the California economy flourished, and its population and urban centers boomed.
As California’s premier research university, UC is poised to tackle the state’s problems. UC research showed farmers how to remove salts from the alkali soils in the Central Valley, transforming barren land into one of the world’s most productive farming regions. UC research uncovered how chemical pollutants called chlorofluorocarbons were depleting Earth’s ozone layer, providing critical evidence that led to a ban on its use in aerosol spray cans. UC physicians and scientists helped transform a human immunodeficiency virus (HIV) diagnosis from the equivalent of a death sentence to a chronic but survivable condition and are now closing in on a cure.
Just last year, when a new virus began infecting people halfway around the globe, UC leaders marshalled expertise and resources from across the University to help both UC and public health authorities respond. In short order, UC helped identify some of the first COVID-19 cases in the U.S. from community spread, prepared UC’s statewide network of hospitals to meet the expected surge in patients, and helped meet an urgent demand for diagnosis and testing. UC faculty, graduate and undergraduate students repurposed maker spaces to produce desperately needed hand sanitizer and volunteered to provide COVID-19 support for local communities.
At the same time, UC faculty converted classes for remote delivery, allowing students to continue their education through the pandemic. Advising and student support services transitioned from in-person to online. And UC, as the third-largest employer in the state, transitioned all but essential workers to work from home. The University stayed open for business, demonstrating the resilience of our institution and dedication of our employees.
As California emerges from the pandemic, the state will continue to face serious challenges resulting from or exacerbated by COVID-19. UC can help.
The University plays a critical role in bolstering California’s economy, contributing significantly to the state’s vibrancy and economic strength. A recent economic impact report — The University of California: Systemwide economic, fiscal, and social impact analysis — shows that investing in the University provides a strong return on that investment. Every $1 of State funding helps generate or support over $21 in economic impact, of which more than $14 is value added. The map below shows that benefit is spread across California.
UC's systemwide impact on gross state product (value added) per capita
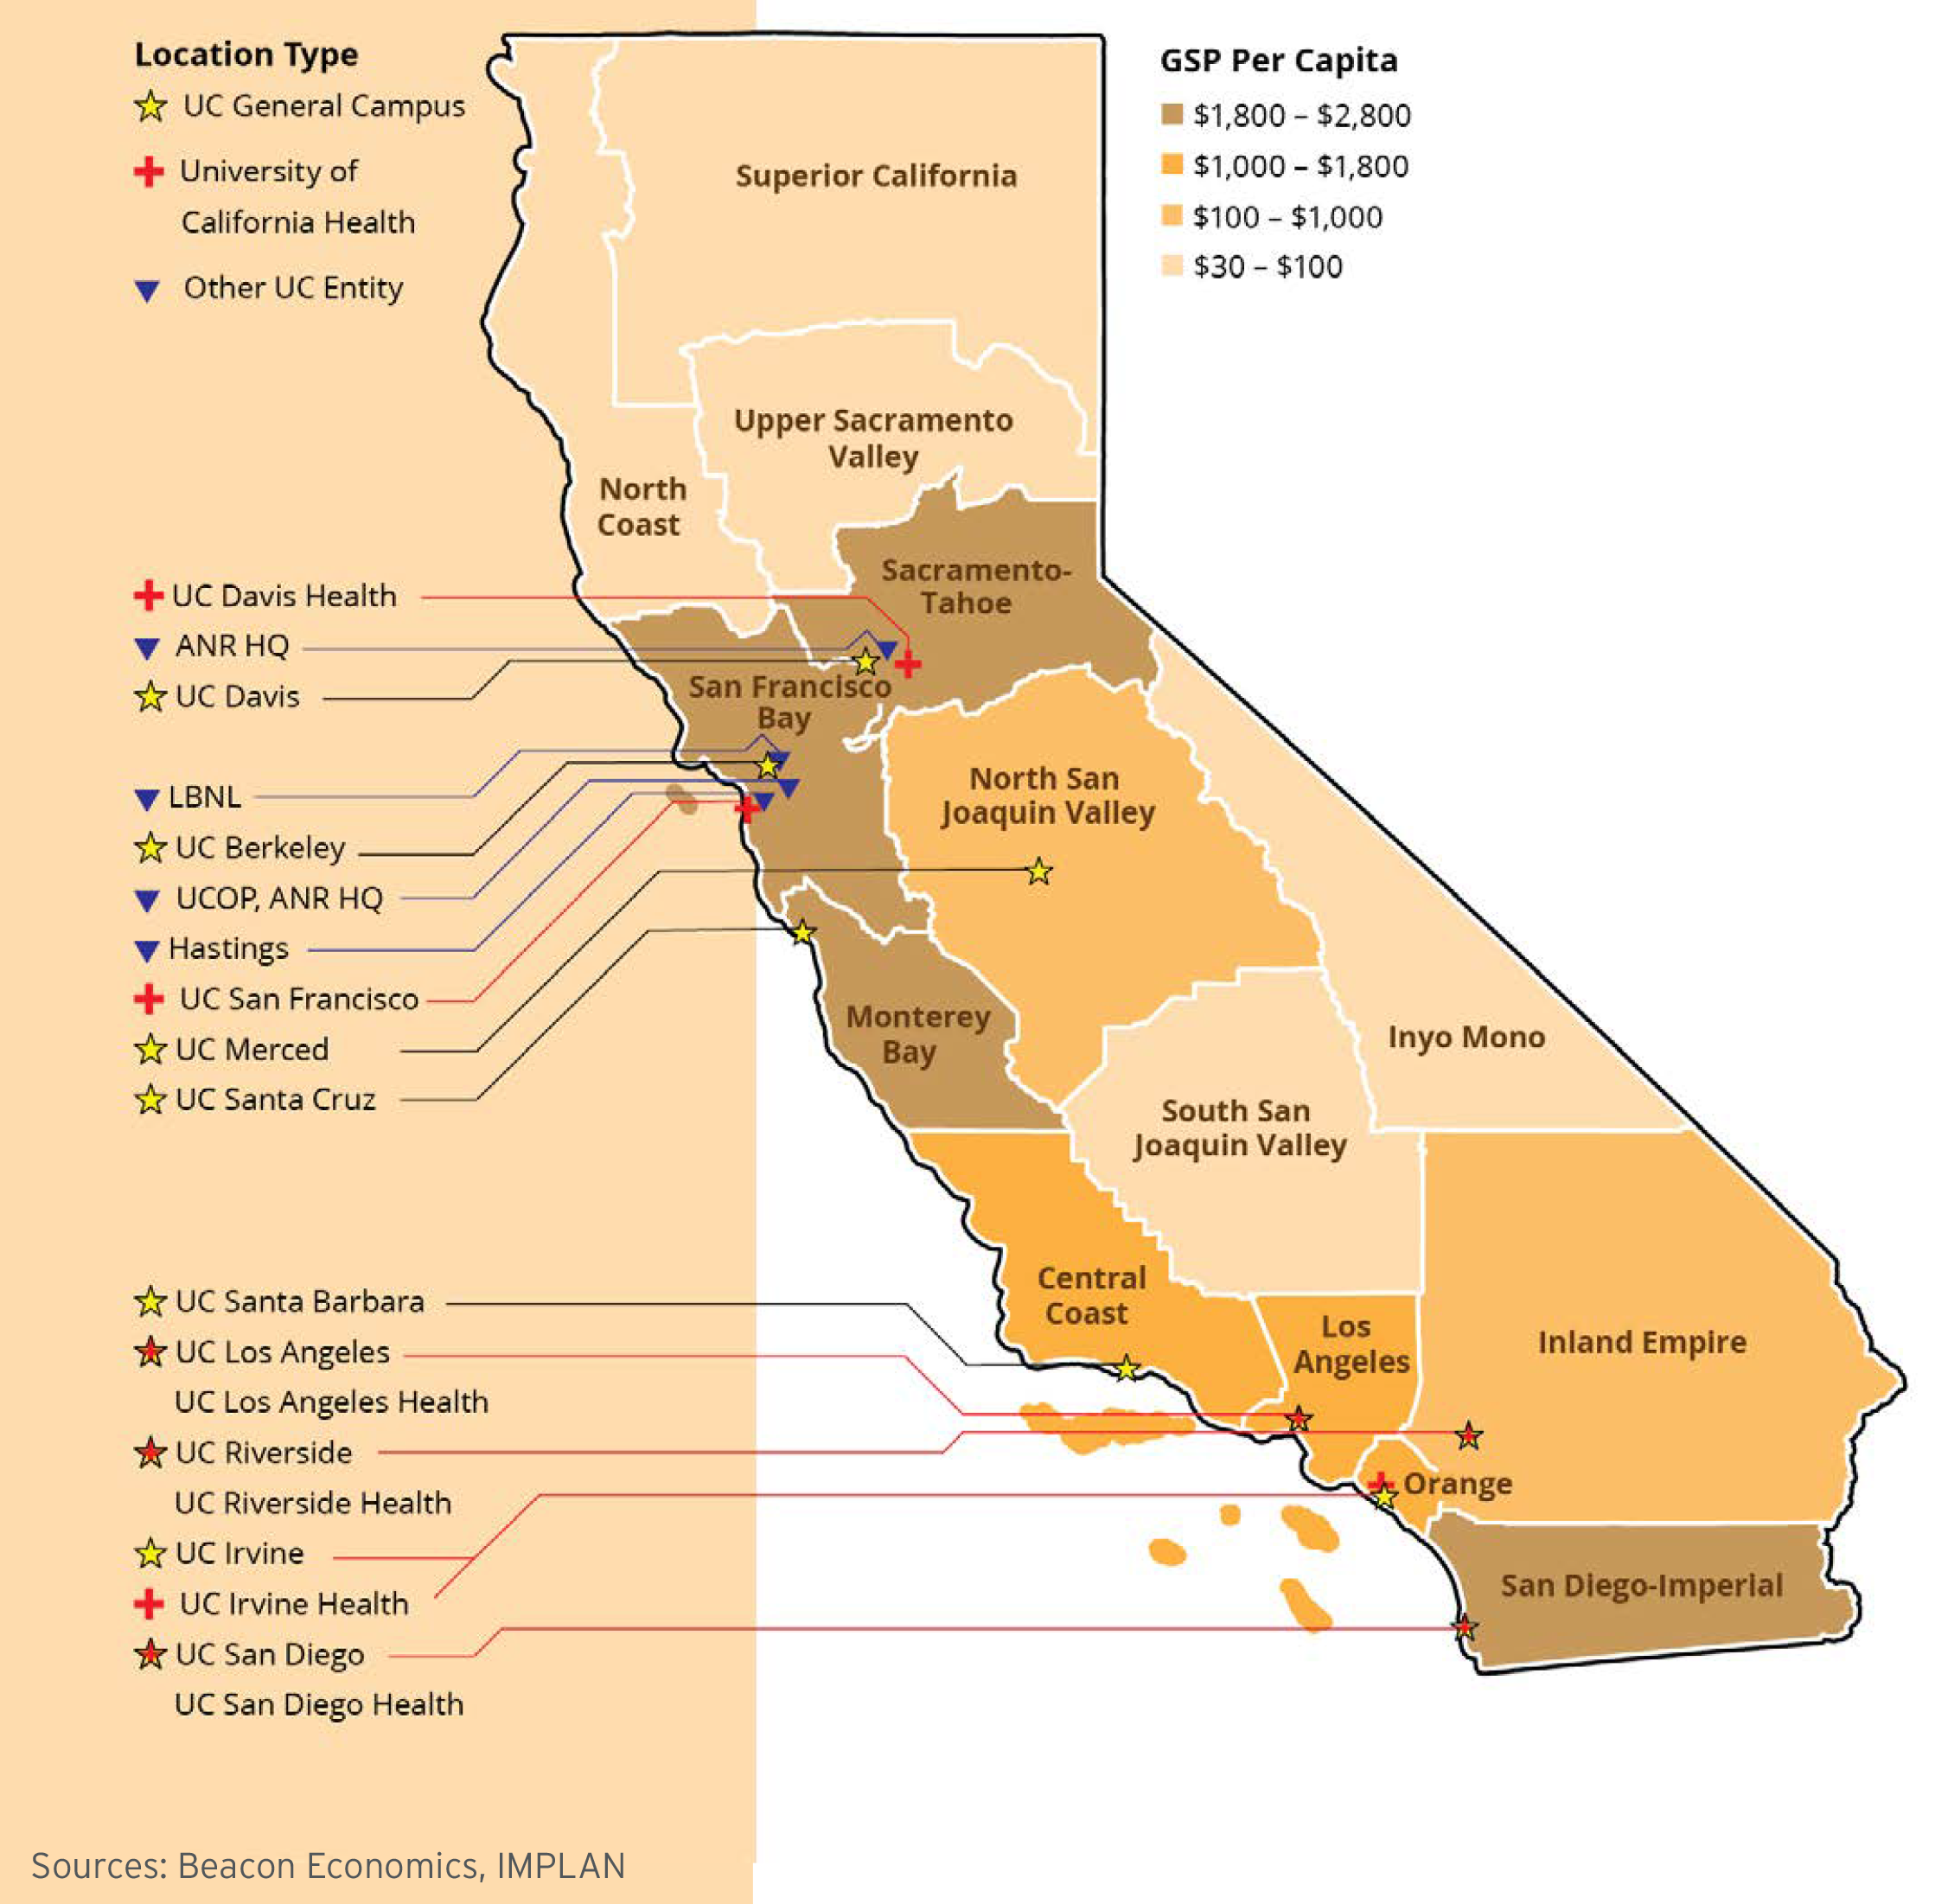
These funds are used to purchase local goods and services, contribute to state and local tax revenues, and support jobs. In fact, UC-related spending supports over half a million jobs in California — or one in every 45 jobs — with less than half of those being UC employees.
The vast majority of support for UC research comes from the federal government. In 2019–20, UC’s direct research expenditures were about $5.1 billion. Of this, 47 percent came directly from federal agencies. A further seven percent represents federal flow-through funds that came to UC from the state, corporations, nonprofits, or other universities. So more than half of UC research expenditures are dollars coming from outside the state into California.
Federal funds support most of the research conducted at UC.
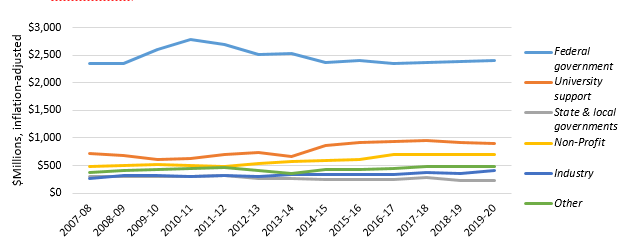
Source: UC Corporate Financial System. Direct amounts have been adjusted for inflation and do not include accrual funds for postemployment retirement benefits or indirect cost recovery funds.
UC research spans virtually every discipline, including hydrology, agriculture, and food security; climate change and energy sustainability; health care; manufacturing and industrial technology; transportation and urban infrastructure; and artificial intelligence. UC research has spurred forward every industry in which California is a world leader — including agriculture, biotechnology, computers, digital media, entertainment, environmental technologies, semiconductors, and telecommunications.
The pandemic has had a significant effect on UC research operations, with a significant proportion of faculty and other researchers unable to continue their work when campuses shifted to primarily remote operations. Two decades ago, UC accounted for 8.7 percent of research expenditures for all US universities. The share peaked at 9.7 percent around 2010, but now has declined back to 8.6 percent.
UC accounts for over eight percent of all research expenditures at all US universities.
9.1.4 Research expenditures, US 4-year universities, 2018-19
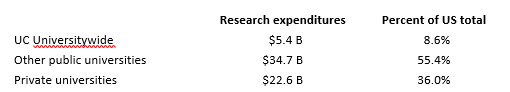
Source: IPEDS. Excludes for-profit institutions, which conduct a negligible share of research. This figure is slightly different from UC’s own figures due to differences in how IPEDS treats non-functional expenses.
Getting UC research activities back to full capacity is critical to maintaining the University’s and California’s competitive position and its ability to continue to attract dollars and talent into the state.
Not only is the University able to help the state address California’s problems by providing the latest research-based findings, but UC researchers disseminate much of the knowledge they create through free, open-access publications. The University feels so strongly about open access (OA) that it ended a partnership with publishing giant Elsevier until there could be an agreement about providing open access to UC research. UC continues to push out research findings through its own OA publishing platform and repository managed by the California Digital Library. Since 2002, UC-sponsored research in eScholarship has been viewed and/or downloaded almost 90 million times by readers around the world. The repository contains over 300,000 individual items, including many articles, research reports, working papers, and the 80-plus OA journals that are published on the platform. As seen on the following map, these materials are being accessed worldwide.
UC’s Open Access policies continue to add to a growing body of freely available research publications in eScholarship, UC’s open-access repository and publishing platform, expanding the global reach of UC’s research findings.
9.2.1 eScholarship views and downloads of UC scholarly materials, Universitywide, through April 2021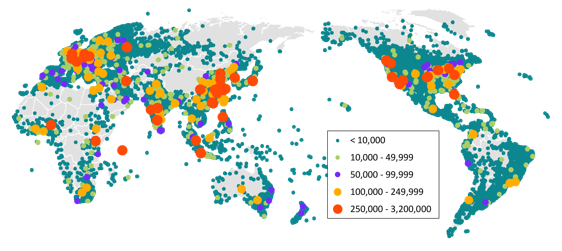 Source: California Digital Library
Uplifting California's Population
California’s greatest strength has been — and continues to be — its human capital, including the new generation of public K–12 students, a majority of whom come to UC from low-income, underrepresented backgrounds and are among the first in their families to attend college. The pandemic has likely exacerbated the historic inequities facing many of these students.
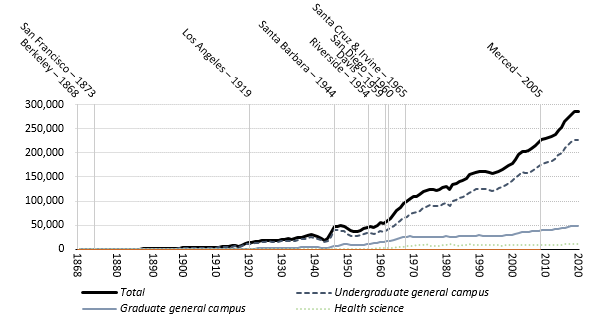
As California has grown, so has the University — expanding enrollment and opening campuses with locations across the state, most recently in the Central Valley.
Undergraduate and graduate enrollment, with campus opening date
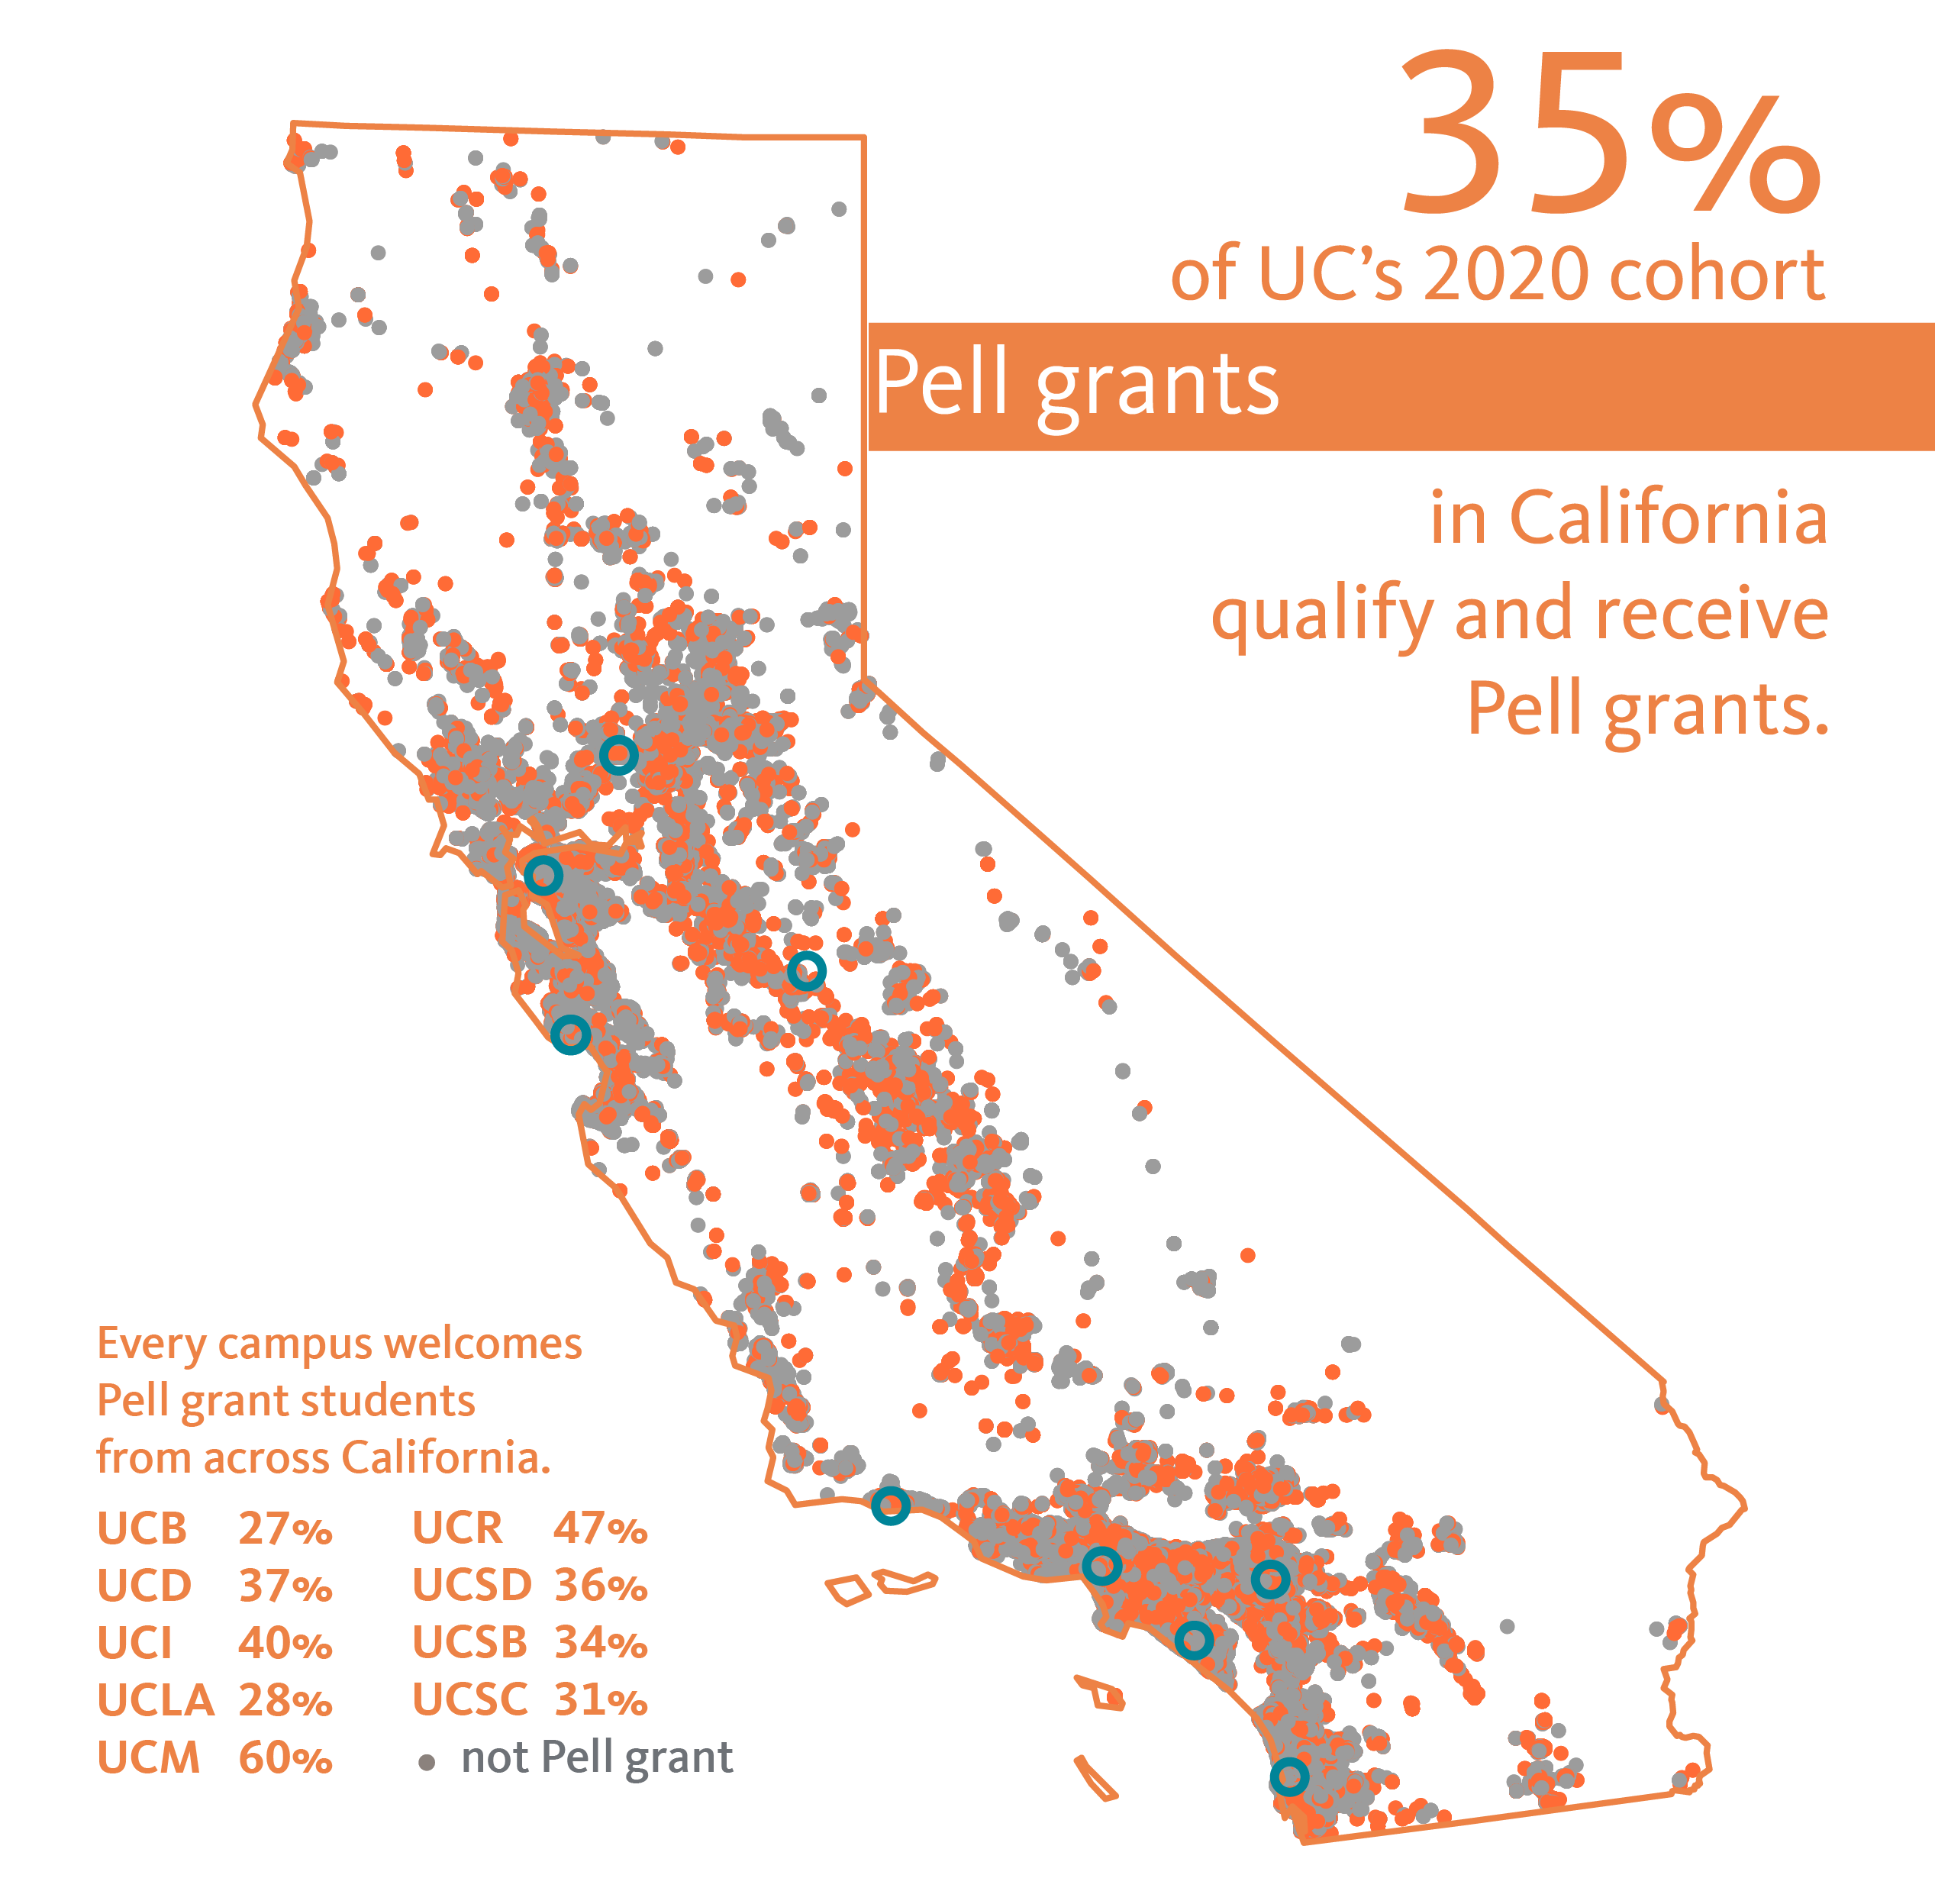
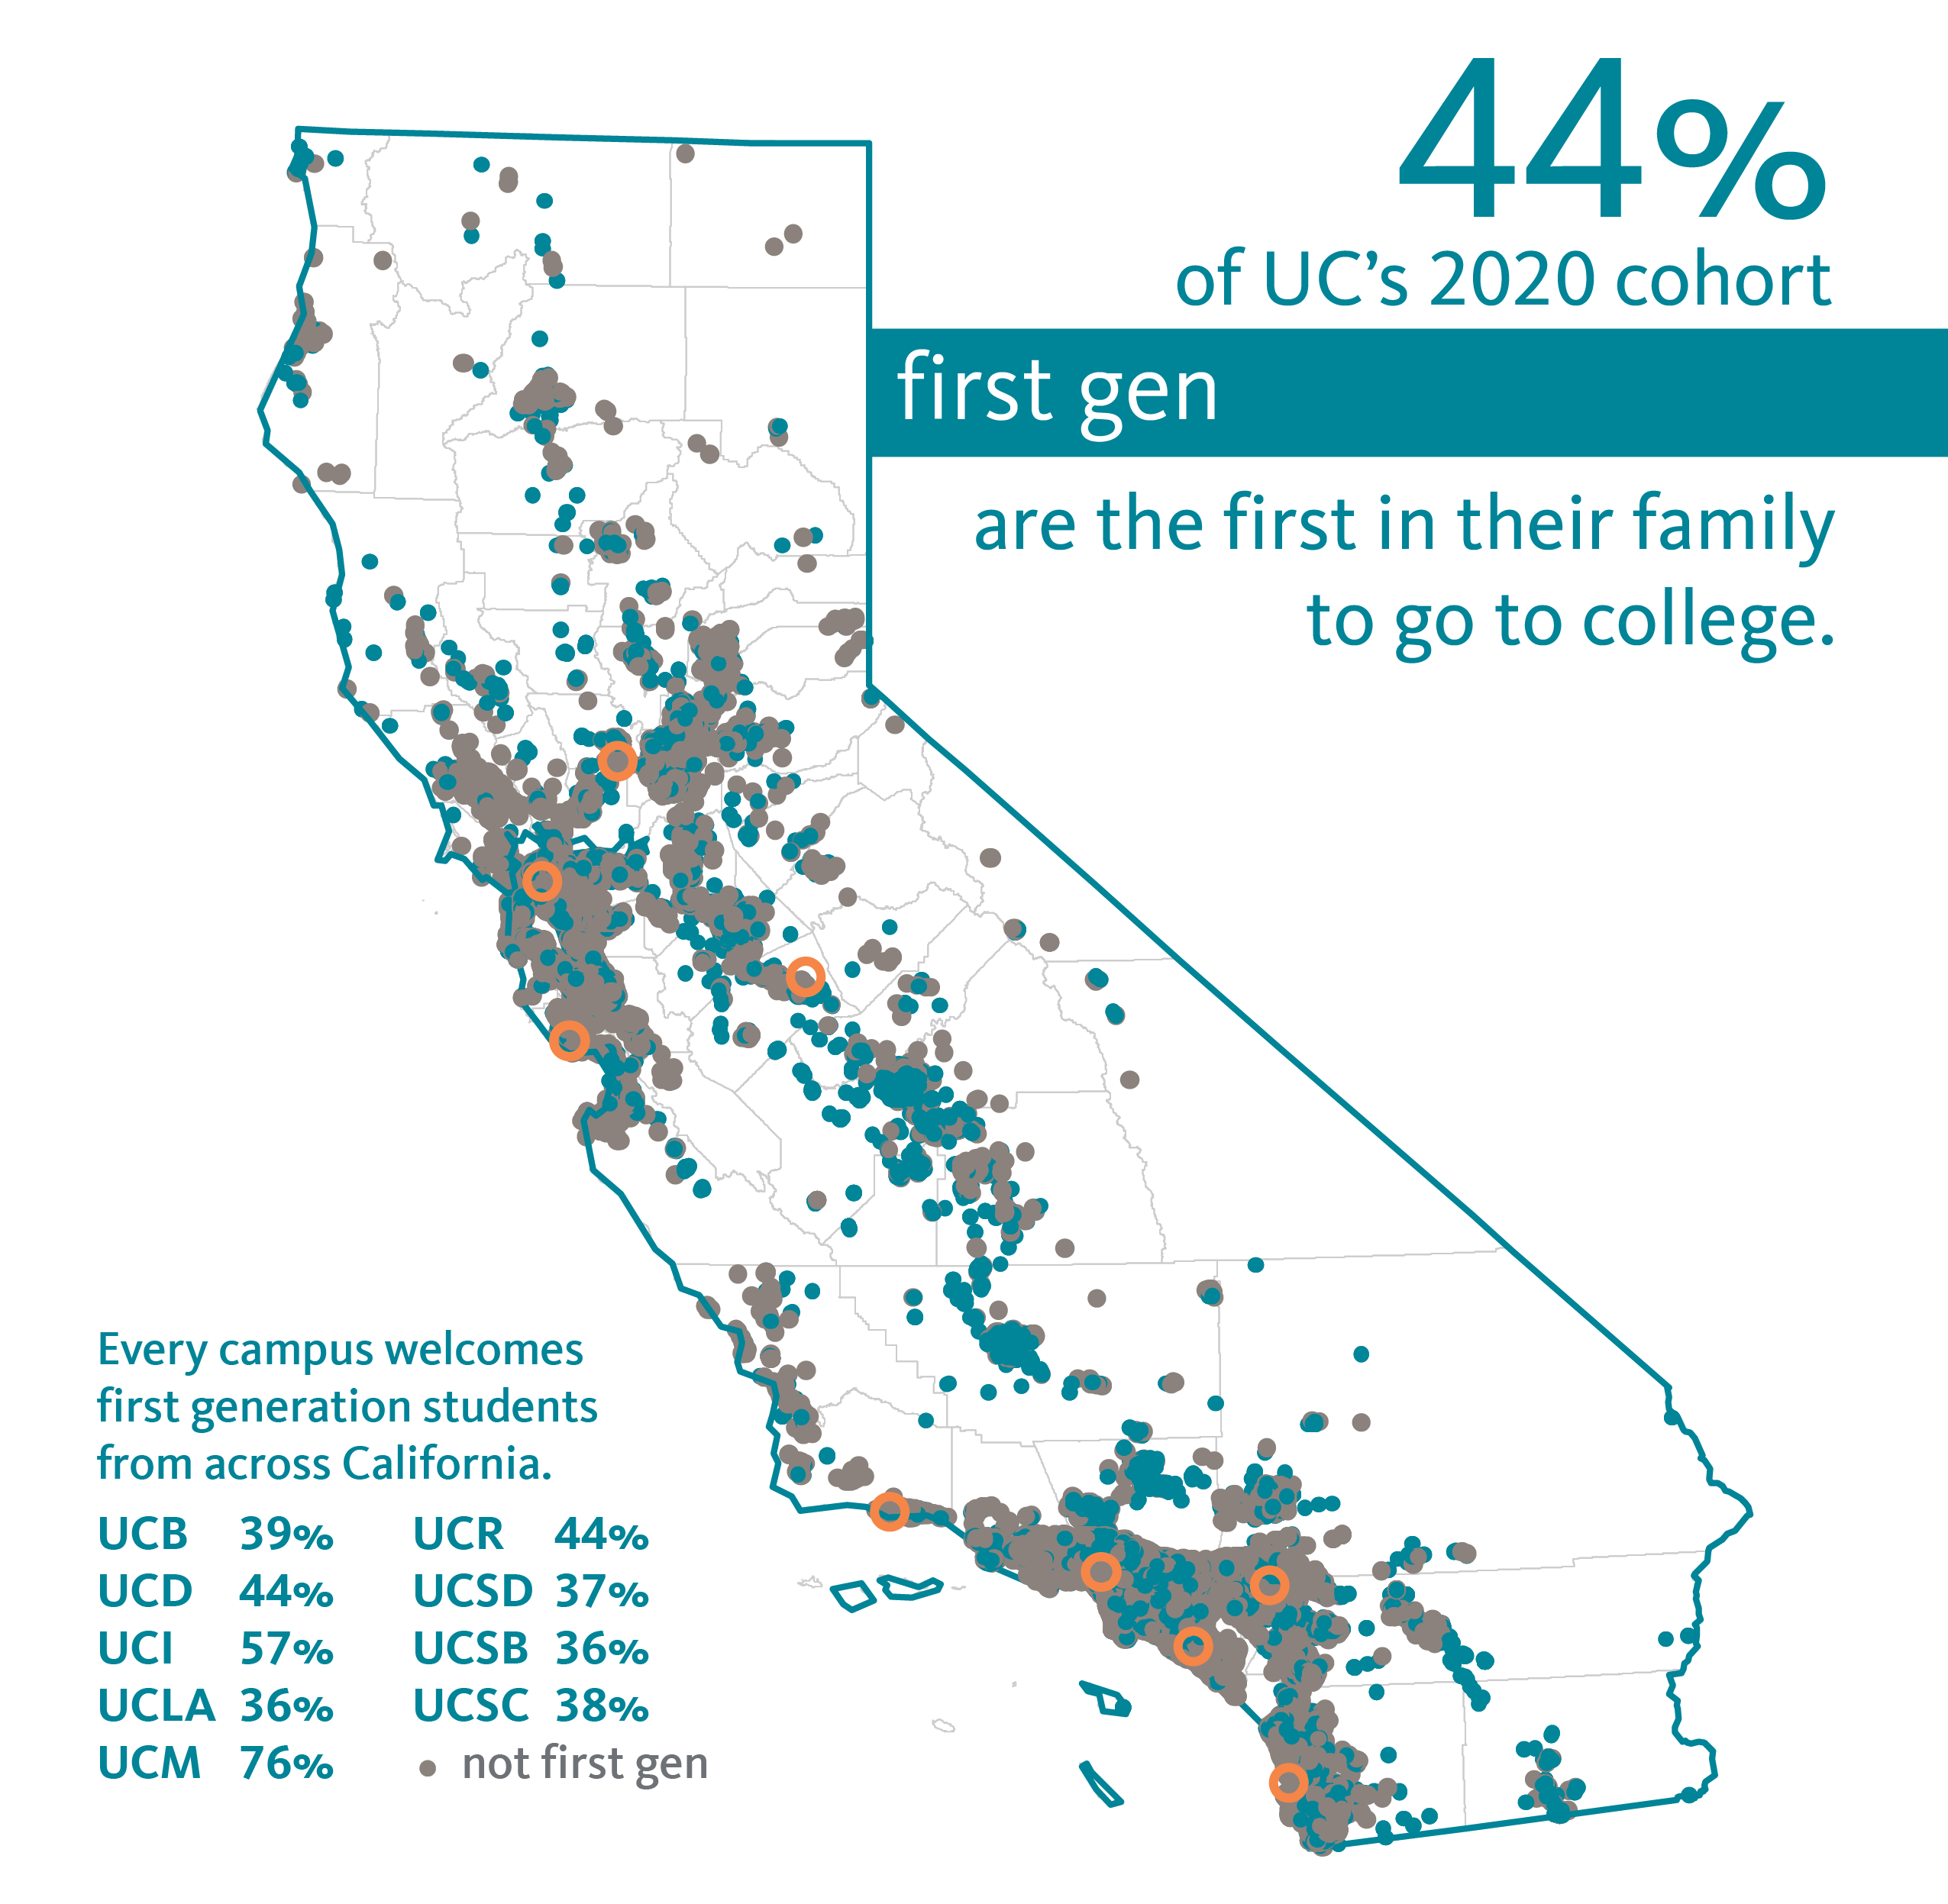
The public value of a UC degree can be seen through the University’s role in meeting critical workforce needs, educating engaged citizens, and advancing economic mobility. Compared to other public and private research universities, a significant portion of UC undergraduates are low-income students who qualify for federal Pell Grants, and are the first in their family to go to college. Within five years of graduation, the majority of UC Pell Grant recipients earn more than their families did, and the same is true for first generation college students seven years after they graduate. These findings demonstrate that a UC degree can help the state address issues of income inequality.
The University is focused on advancing equity, and ensuring that UC’s undergraduate, graduate, and faculty populations better reflect California’s diversity. UC’s 2030 multi-year framework looks to expand the pathway to the professoriate, starting with improving undergraduate outcomes for Pell Grant recipients and first-generation and underrepresented students, as well as increasing diversity for UC’s faculty and its graduate academic and professional student populations. The UC 2030 goals seek to revitalize UC as a leading source of social mobility, research, and innovation.
UC 2030 goals seek to diversify the pathway from UC undergraduate students to the professoriate with a goal of better reflecting California.
7.3.1 Racial/ethnic distribution of students and faculty, domestic population only, Universitywide, Selected years, fall 2007 to 2019
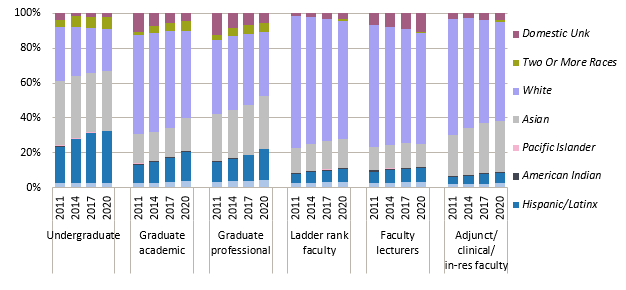
Source: UC Information Center Data Warehouse; Corporate Personnel System
UC 2030: Advancing the California Dream
In 2019, The University of California established its multi-year framework — UC 2030 — with a three-point plan on how the University would strengthen California over the coming decade by:
- producing over 200,000 additional degrees, on top of the one million undergraduate and graduate degrees currently projected;
- achieving a 90 percent graduation rate and eliminating gaps for timely graduation and graduate degree attainment for Pell, first-generation, and underrepresented groups;
- investing in the next generation of faculty and research by adding 1,100 ladder-rank faculty over the next four years.
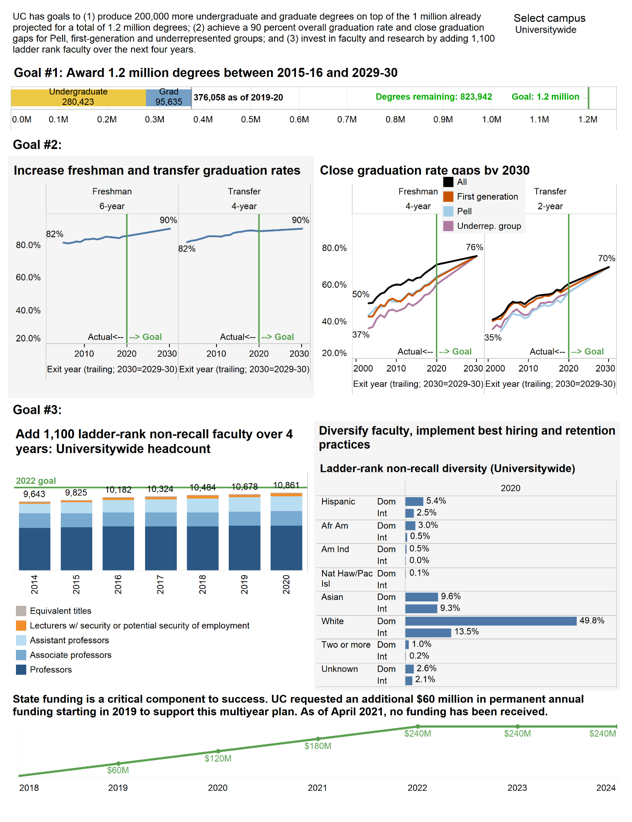
At the end of this Executive Summary is a dashboard displaying UC 2030 systemwide goals; listed below are relevant UC Accountability Report indicators, which set the baseline and highlight existing challenges and opportunities to achieve these goals.
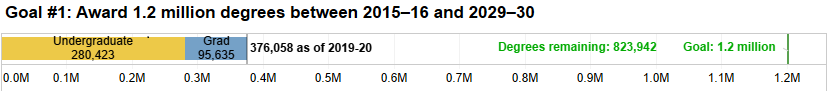
Goal 1: Producing 200,000 more undergraduate degrees and graduate degrees by 2030
The Public Policy Institute of California (PPIC) estimates that California will face a shortfall of 1.1 million workers with at least a bachelor’s degree between 2014 and 2030, in large part due to Baby Boomers leaving the workforce. The University of California has set a goal to add 200,000 degrees over the one million currently projected — or 1.2 million undergraduate and graduate degrees. To date, UC has produced over 376,000 undergraduate and graduate degrees, or just over 31 percent of the 1.2 million total.
At the undergraduate level, much of this improvement will be made by increasing timely graduation, with all campuses proposing improvements that will yield a systemwide goal of increasing four-year freshman graduation rates by eight points, from 68 percent to 76 percent, and two-year transfer graduation rates by 13 points, from 57 percent to 70 percent.
UC four-year freshman and two-year transfer graduation rates gained over 1.5 points.
3.1.1 Freshman graduation rates, UC and comparison institutions, cohorts entering fall 2014, 2015, and 2016; fall 2013 cohort for AAU comparision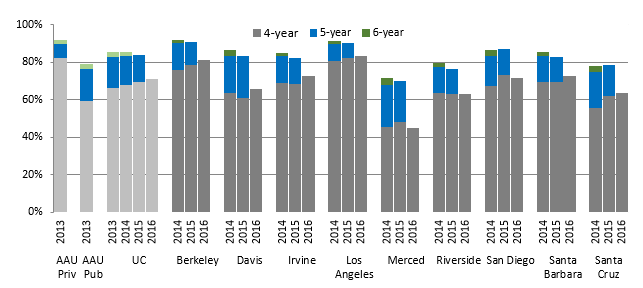
Source: IPEDS and UC Information Center Data Warehouse
3.1.3 Transfer graduation rates, Universitywide and UC campuses, cohorts entering fall 2016, 2017 and 2018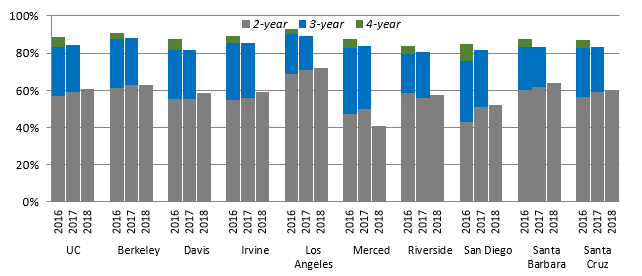
Source: UC Information Center Data Warehouse
When campuses shifted to remote instruction, undergraduates took higher course loads in both spring and fall 2020. There was also a significant increase in students enrolling in the summer. As a result, there was an increase in graduation rates, particularly four-year freshman and two-transfer graduation rates, systemwide and on most campuses. Course loads are now starting to return to pre-remote instruction levels, so it is unclear if this will be a one-year uptick or if graduation rates will continue to increase. If trends continue, UC is cautiously optimistic that it is on track to meet undergraduate degree attainment goals.
Of the additional 200,000 degrees UC will produce, over 40,000 will be graduate degrees, and this growth will primarily be achieved through increased graduate enrollment across the system. UC has not received State funding to increase graduate enrollment in many years and is at risk of not meeting graduate degree attainment goals absent a restoration of State support for graduate enrollment growth.
Graduate enrollment growth would increase mentorship and teaching assistant support for undergraduates, and expand research capacity across UC campuses. For academic doctoral students, more than half remain in California after receiving their doctorates. The majority work in higher education — 25 percent of UC faculty and 20 percent of California State University faculty have a UC Ph.D. — and these graduate students become part of the future professoriate.
UC’s professional degrees include professional master’s and professional practice degrees in fields such as law, medicine, nursing, public health, business, education, architecture, public policy, and the arts.
Half of UC academic doctoral and master's graduates who stay in California work in higher education.
4.3.6 Industry of employment of UC graduate academic students in CA, by year after graduation, Universitywide 2000 to 2017 graduating cohorts
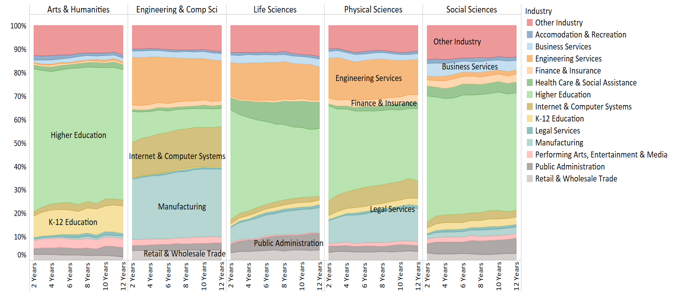
Source:California Employment Development Department and UC Corporate Student System
UC’s graduate academic and professional degree recipients both contribute significantly to the state’s high-skilled and high-tech industries, as seen in the Google and Kaiser Permanente examples presented below. LinkedIn data show that UC Ph.D. students are serving in research and analysis, along with engineering and technical positions. It also shows UC MBA, MD, and JD degree recipients serving in vital positions at these companies, including President or Vice President, medical doctor, and attorney positions.UC graduate degree recipients employed by Google and Kaiser Permanente
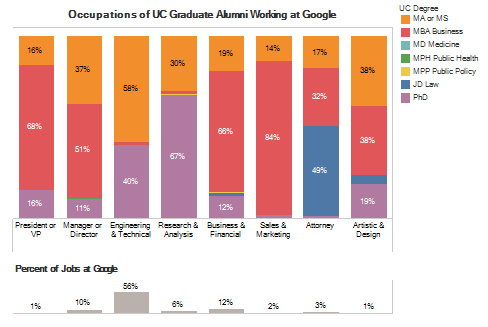
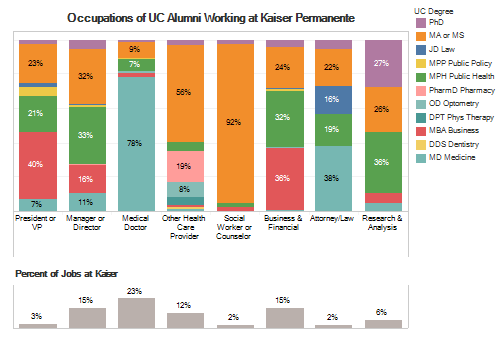
Source: LinkedIn and UC Information Center Data Warehouse
Goal 2: Ensuring the California Dream is for everyone
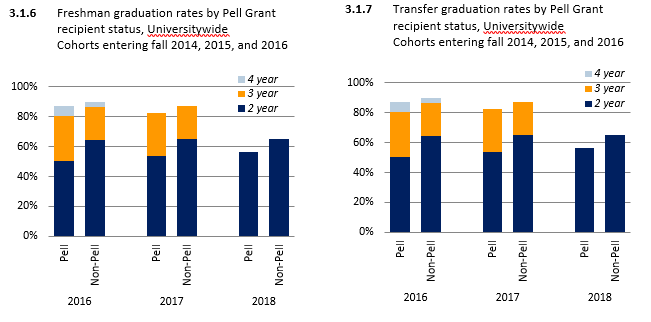
The emphasis of this goal is two-fold: ensuring that nine out of ten freshman and transfer entrants leave UC with a degree, and eliminating timely graduation gaps for Pell grant recipients and first-generation and underrepresented students.
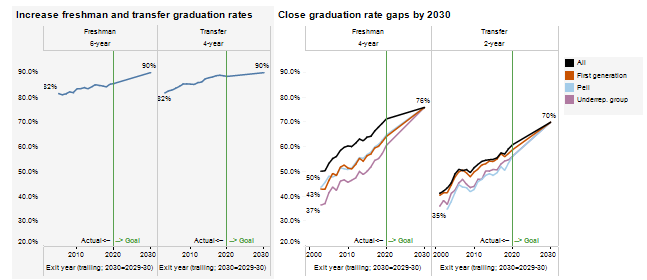
Source: UC 2030 Dashboard https://www.universityofcalifornia.edu/infocenter/uc-2030-dashboard
Over the last 15 years, UC graduation rates have improved, particularly four-year freshman and two-year transfer rates. However, UC has been unable to close gaps in timely graduation for Pell, first-generation, and underrepresented groups, particularly for freshman entrants. UC is seeking to eliminate double-digit gaps in timely graduation rates for Pell, first-generation, and underrepresented students.
UC's gap in timely graduation for Pell and non-Pell recipients remained flat for freshmen and decreased two and a half points for transfers.
Source: UC Information Center Data Warehouse
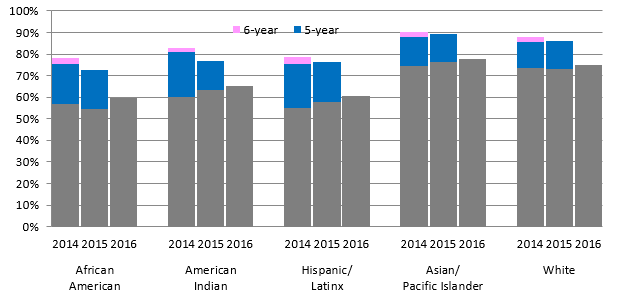
UC’s gap in four-year graduation rates decreased by over one point for underrepresented students compared to Asian and White peers, though the gap is still around 15 points.
3.1.4 Freshman graduation rate by race/ethnicity, cohorts entering fall 2014, 2015, and 2016
Source: UC Information Center Data Warehouse
UC campuses have identified ways to achieve these ambitious goals, including increasing summer orientation programs (e.g., summer bridge/transfer edge), expanding living-learning communities, combining curricular and co-curricular advising, and redesigning gateway courses to eliminate equity gaps. While timely graduation rates are improving, UC is at risk of not being able to eliminate equity gaps by 2030.
Goal 3: Investing in the next generation of faculty and research
While much of the funding that supports UC research activity comes from the federal government, a primary way California supports UC research activity is through State support for world-leading faculty. Campuses estimated the growth in faculty appointments that would be necessary to achieve the goals of the multi-year framework. Based on that input, the University set a goal in 2018 to add 1,100 net new faculty by 2022. Between fall 2018 and fall 2020, UC added around 375 faculty (a 3.6 percent increase).
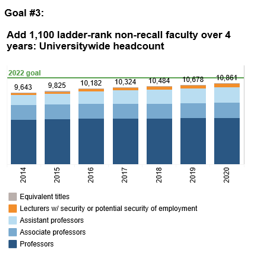
To reach the faculty hiring goal by fall 2022, UC would need to add an additional 722 faculty between 2020 and 2022, which is nearly double the amount of growth over the prior two years. UC campuses have drastically scaled back their faculty recruiting due to the economic uncertainty caused by the COVID-19 pandemic. UC may also see an increase in retirements. For these reasons, UC is not on pace to meet this faculty hiring goal.
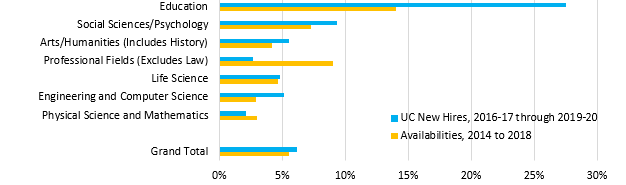
Faculty growth is critical for UC campuses to achieve UC 2030 goals, including increasing faculty diversity. UC’s recent hires are more diverse than existing faculty. In many cases, they meet or exceed national availability pools (5.3.1). UC is looking at further opportunities to diversify the professoriate, including opportunities to grow and expand the diversity of UC Ph.D. students through ongoing partnerships with UC undergraduate programs, along with CSU, other Hispanic Serving Institutions, Historically Black Colleges and Universities, and Tribal Colleges and Universities. Increasing the number and graduating more UC Ph.D. students would create a larger, more diverse availability pool that UC, CSU, and California Community Colleges could tap. With current demographic trends, UC has a generational opportunity to diversify the professoriate if it can do more than just replace the faculty, but grow it. Growing it, inclusively, will also help graduation rate and equity goals.
UC’s hiring of African American, Hispanic/Latinx and women faculty generally meets or exceeds the national availability of doctorates, with variation among discipline groups.
5.3.1 African American new assistant professors compared with national availability by discipline group
5.3.2 Hispanic/Latinx new assistant professors compared with national availability by discipline group
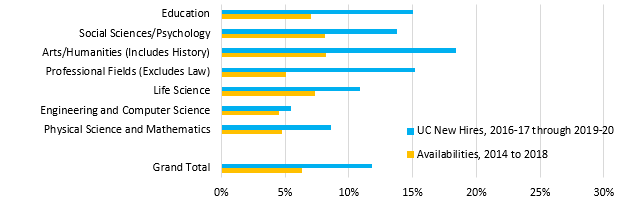
5.3.3 Women new assistant professors compared with national availability by discipline group
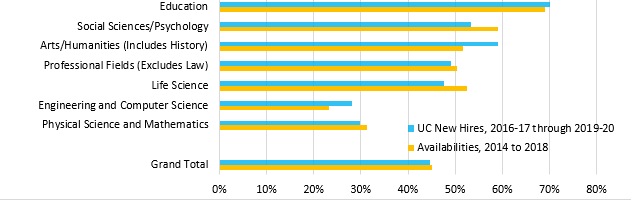
Source: Survey of Earned Doctorates and UC Academic Personnel and Programs
Achieving UC 2030 goals will require sustained state investment
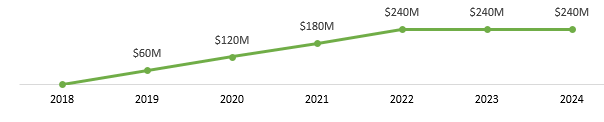
The University of California requested permanent funding of $60 million for each of the first four years of this initiative, starting in 2019, resulting in a $240 million investment. This funding proposal represented what campuses needed to meet UC’s 2030 goals. It was similar to, but lower-cost than, the request CSU made and has received from the State for its Graduation Initiative 2025.
State funding is a critical component to success. UC requested an additional $60 million in permanent annual funding starting in 2019 to support this multi-year plan. As of June 2021, no funding has been received.
UC's funding request from the State:
 In his January 2019 budget introduction, California Gov. Gavin Newsom proposed $49.9 million to improve degree attainment and student success, suggesting a significant down payment on UC’s multi-year plan. However, the State Legislature shifted the UC funds to one-time undergraduate enrollment growth.
While this additional funding has helped increase degree attainment, it hasn’t provided permanent and necessary support for the programs and strategies that would eliminate equity gaps. Without targeted investment, it is likely that UC will improve graduation rates but will be unable to close achievement gaps that disproportionately affect low income, first-generation students. State support for UC 2030 goals would institutionalize these critical efforts to help these students graduate in a timely manner, reducing their cost of education and increasing the likelihood that they would go on to graduate school. These same students were also more likely to face academic challenges related to remote instruction, making this investment in UC’s new and future freshman and transfer entrants more critical than ever.
In addition, the investment in graduate enrollment growth will expand opportunities for students to go onto graduate programs, including doctoral programs. Without this investment, not only will UC be less likely to meet UC 2030 graduate degree attainment goals, California will miss a generational opportunity to diversify professions that require a graduate degree, including the future professoriate for UC, CSU, and CCC.
Finally, UC needs to ramp up research operations to remain competitive with other research universities that remained open during COVID-19. The recent economic impact report demonstrates that funding faculty positions and new graduate enrollment will result in UC being able to attract more dollars and talent into the state. At the same time, this funding will help UC further diversify its faculty population, recognizing that UC hires are more diverse than existing faculty.
To date, UC has not received any State support to advance UC 2030 goals and without it, the University is unlikely to achieve the UC 2030 goals.
This dashboard highlights key goals of the UC 2030 framework.
Dashboard Notes and Data Sources
Degrees awarded include the leading summer and the full academic year. universityofcalifornia.edu/infocenter/degrees-awarded-data
Graduation rates are based on entering cohorts but labeled by the exit academic year, which is a leading year. For example, the six-year graduation rate for 2019 in the graph reflects students who entered in fall 2014 and graduated in the 2019–20 year (including the trailing summer). universityofcalifornia.edu/infocenter/ug-outcomes
Ladder-rank non-recall faculty are October payroll snapshot headcounts. universityofcalifornia.edu/infocenter/uc-employee-headcount
The UC Information Center: universityofcalifornia.edu/infocenter