Chapter 5:
Faculty and Other Academic Employees
The quality and stature of the University of California are due to its distinguished faculty. President Napolitano has said, “We teach for California … [and] we research for the world.” UC faculty serve as a rich source of innovation, discovery and mentorship; they provide top-quality education to students, groundbreaking research and service to California communities. No other public institution can claim as distinguished a faculty: UC faculty have won 62 Nobel Prizes and 67 National Medals of Science. As of 2016, UC academics included over 580 members of the National Academy of Sciences and over 500 members of the American Academy of Arts and Sciences.
Describing the academic workforce
Faculty are dedicated to teaching, research and creative work, to clinical service and to public service functions in a vast array of disciplines, including the health sciences. The outline of the composition of the UC faculty in this chapter only hints at the full scope of faculty specialties and expertise.
The faculty renewal pipeline
Over the last few years, new hires have increased as UC recovered from the severe budget cuts of prior years. Faculty diversity has increased and departure rates have declined.
Competitiveness of faculty salaries — Faculty salaries at UC still trail those at comparison institutions by about 10 percent. UC compares its faculty salaries to the average of salaries at the “Comparison 8,” a group of four public and four private institutions. UC salaries have lagged behind this benchmark for the last 14 years. According to the 2014 update of UC’s Total Remuneration Study for General Campus Ladder-Rank Faculty, UC’s 6 percent above-market positioning for retirement is offset by 7 percent below-market positioning for health and welfare benefits. When combined with UC’s below-market cash compensation, this leads to total remuneration 10 percent below market.
Diversity — The University of California is committed to diversifying its faculty. The Office of the President is working with campuses by tracking recruitment data to identify opportunities to diversify the faculty; by sharing best practices in mentoring and professional development; and by enhancing work-life balance programs. The proportion of women and underrepresented racial/ethnic groups (URMs) in the faculty continues to grow at a modest pace. When diversity figures are displayed in the context of eight peer research institutions that make up UC’s standard comparator group, UC compares favorably. According to 2014 data, UC is ranked second place, at 32 percent, for the percentage of female faculty. UC also places second for the percentage of URM faculty and female URM faculty. However, there is still work to be done. Data comparing U.S. doctoral degree recipients and UC’s new faculty hires show that in many disciplines, the share of faculty from underrepresented groups among new UC assistant professors remains below the share in the national pool of available candidates.
Diversity initiatives
A wide variety of programs to strengthen faculty diversity are in place. Notable programs include the President’s Postdoctoral Fellowship Program Special Presidential Initiative, grant-funded research, a faculty exit survey and ADVANCE programs.
President’s Postdoctoral Fellowship Program Special Presidential Initiative — Established in 1984, the President’s Postdoctoral Fellowship Program (PPFP) recruits top scholars with commitments to underserved and minority communities to pursue faculty careers at UC. To enhance the work of PPFP, the president has added one-time funds to the program, with $2.4M targeted to support startup costs for fellows hired into STEM faculty positions, including the health sciences. The president also added $2.1M in support for the hiring incentive offered to departments that hire fellows. She also committed $475K to training seminars for chairs and deans in which they studied best practices in creating welcoming department climates. The National Institutes of Health (NIH) is using PPFP as a model for postdoctoral recruiting, and PPFP was featured at a recent panel presentation during the National Postdoctoral Association convention.
Grant-funded research — In 2015, UC was awarded a National Science Foundation (NSF) grant to study the faculty hiring process over a three-year period. The study will identify the steps in UC’s hiring process susceptible to bias and characteristics of the process that amplify or mitigate disparities, and will identify targets for policies to promote equity, inclusion, and diversity among faculty. UC was also awarded a five-year grant to establish the Center for Research, Excellence and Diversity in Team Science (CREDITS), a research and training program aimed at enhancing the capacity, effectiveness and excellence of team science efforts at both UC and CSU. CREDITS will research gender and racial/ethnic diversity in team science, particularly barriers to diverse participation, how diversity shapes the formation of science teams and how diversity and team science are implicated in promotion and tenure. A third program, the Mentoring Advisory Group in California (MAGIC), affiliated with the National Research Mentoring Network (NRMN) (https://nrmnet.net), will develop a “train the trainer” event on mentoring a diverse population in the biomedical fields at all levels: undergraduate, graduate, postdoc and faculty. The event will be modelled after the UC ADVANCE PAID Roundtables.
Faculty Exit Survey — In an effort to better understand and improve the experience of faculty members at UC, the University of California has partnered with Harvard's Collaborative on Academic Careers in Higher Education (COACHE) on a research project to survey faculty who leave UC for employment at other universities.
ADVANCE Programs across UC — The National Science Foundation sponsors ADVANCE Programs to develop “Systematic approaches to increase the representation and advancement of women in academic science and engineering careers, thereby contributing to the development of a more diverse science and engineering workforce.” There have been ADVANCE programs at the UC Office of the President, UC Berkeley, UC Davis, UC Irvine, UC Merced, UC Riverside, UC San Diego, UC Santa Barbara and Hastings College of the Law.
To incentivize the hiring of STEM faculty who have committed to doing outreach, mentoring or research in engagement with underserved communities, UC Davis established the Center for Multicultural Perspectives on Science (CAMPOS) in 2013. The provost has provided incentive funding comparable to that for the PPFP. CAMPOS Scholars are new ladder-rank faculty who are selected based on their transformative thinking, unique perspectives, interdisciplinary approaches and leadership potential. The program has hired 13 faculty as CAMPOS Scholars, and is actively recruiting three additional Scholars.
Faculty emeriti
Even in retirement, UC faculty remain active in academia and are frequently recognized for their continued contributions. The Council of University of California Emeriti Associations (CUCEA) recently conducted a survey of over 1,600 UC emeriti to inventory their work and achievements. The survey showed that between 2012 to 2015, this group of UC retirees taught more than 2,000 classes, wrote more than 500 books and over 3,000 articles, and were involved in hundreds of campus and community service efforts. In fact, 77 percent of faculty who retired in the last five years reported having research or publication work in the pipeline. This shows that in early retirement, many faculty still work with graduate students finishing their research, run labs or have grants with time remaining.
More than half of ladder-rank and equivalent faculty are in STEM (science, technology, engineering and mathematics) and health sciences disciplines.
5.1.1 Faculty by discipline, headcount, Universitywide, Fall 2007 and 2016
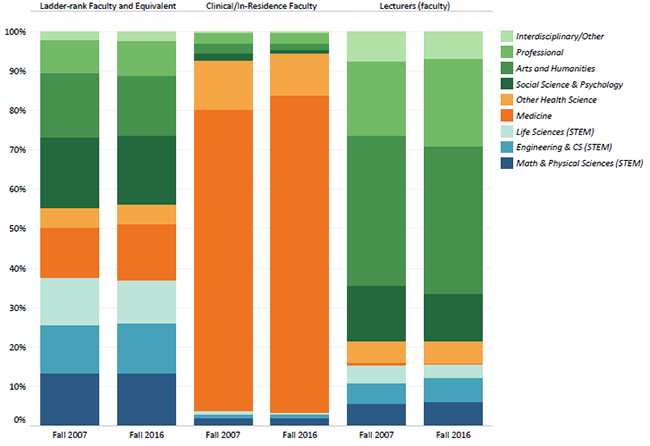
Source: UC Corporate Personnel System1
The proportion of ladder-rank faculty across disciplines has remained similar over the last ten years, with the greatest increase in medicine and health sciences disciplines (17.8% to 19.3%) and the greatest decrease in the arts and humanities (16.6% to 15.2%). In the clinical/in-residence faculty group, medicine and health sciences, which make up the largest proportion by far, increased by 2 percentage points proportionally.
Headcount in clinical/in-residence and lecturer groups has grown by around 2,700 (about a 30 percent increase) since 2007 — a much greater increase than in the headcount of ladder-rank and equivalent faculty (about 1,200 or 12 percent).
1 Data shown are headcount numbers for all faculty. Ladder-rank and equivalent faculty are appointees who are tenured or who are eligible for tenure or security of employment. Clinical/in-residence faculty include clinical faculty and professors in residence who are integral to UC’s health sciences clinical and research activities.
Ladder-rank and equivalent faculty constituted 76 percent of UC general campus faculty FTE in fall 2016 and only 21 percent in the health sciences.
5.1.2 Faculty workforce FTE (full-time equivalent), Universitywide, Fall 2007 and 2016
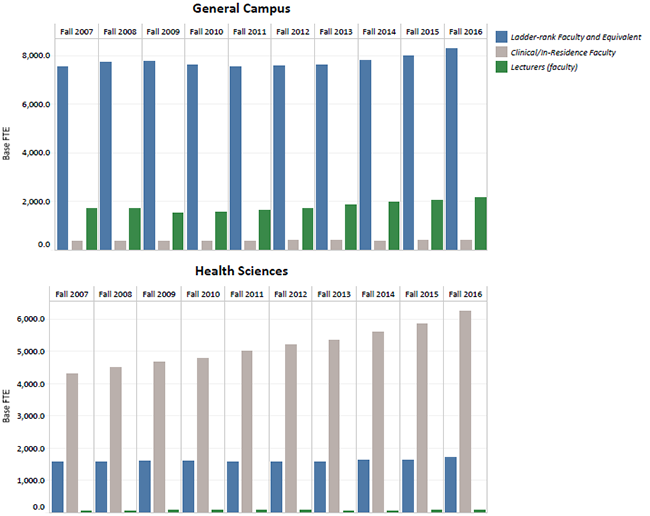
Source: Corporate Personnel System October snapshots and UC Data Warehouse — earned in October, paid through November1
Ladder-rank and equivalent faculty numbers declined starting in 2009 as campuses reduced hiring to address budget shortfalls, but have since rebounded.
Lecturers and instructional assistants2 tend to be more common in general campus departments and represent about 20 percent of the general campus faculty. The “Clinical/In-Residence” category3 has grown substantially. These faculty include clinical faculty and professors in residence who are integral to UC’s health sciences clinical and research activities. They are paid primarily from clinical and research revenues, rather than from state sources.
1 Health Sciences includes FTE in schools of medicine, dentistry, nursing, optometry, pharmacy, public health and veterinary medicine. General campus includes FTE in all other schools and colleges.
2 Includes union-represented non-Senate teaching faculty, including “Unit 18 Lecturers” and non-student instructional assistants.
3 Although ther3e are exceptions, these faculty are generally employed at campuses with health science schools.
FTE of academic researchers has increased, peaking in 2010–11 due to stimulus funds from the American Recovery and Reinvestment Act (ARRA).
5.1.3 Nonfaculty workforce FTE, Universitywide, Fall 1998 to 2016
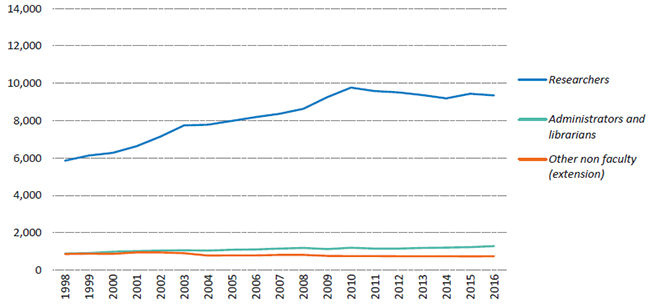
Aside from faculty, most of the nonstudent academic workforce is composed of appointees in professional research titles. The greater majority of researchers in the academic workforce are supported by contracts and grants from external sponsors, with the federal government providing about 60 percent of the funding for research. The number of researchers in the academic workforce peaked in 2010–11, largely due to augmentations to federally sponsored research funding provided through the ARRA.
In the following years, federal agency appropriations for research declined, and other sources of funding did not increase sufficiently to offset the drop in federal research support. This resulted in a four-year decline in the overall research workforce until 2015, when the research FTE grew by almost 3 percent from the previous year. In 2016, there was a small drop of less than 1 percent compared to the previous year.
Chapter 9, Research, provides additional details on the composition of the research workforce.
UC faculty salaries are currently below the benchmark that UC has historically employed to assess competitiveness. This affects the University’s efforts to recruit and retain high-quality faculty.
5.2.1 Average ladder-rank general campus faculty salaries, by rank, UC and comparison institutions, 1997–98 to 2016–17
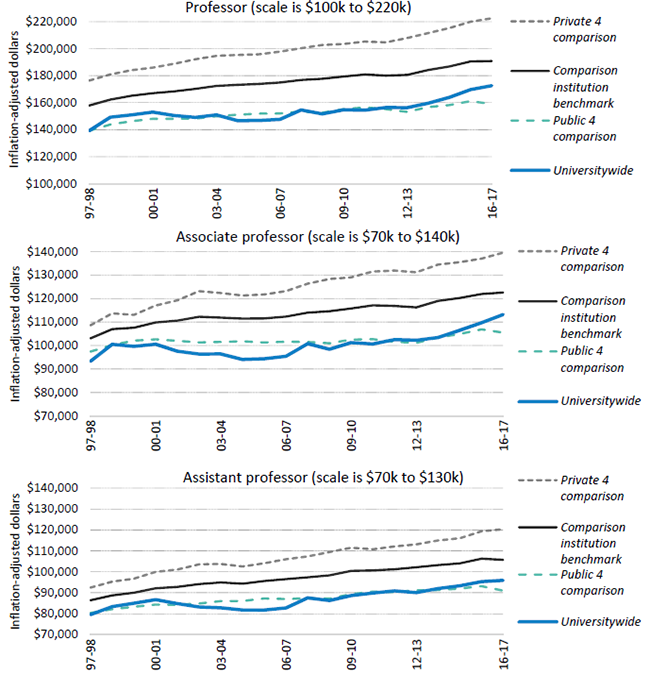
Source: UC Corporate Personnel System, AAUP faculty salary survey
UC historically has used the “Comparison 8” universities against which to benchmark its faculty salaries. The benchmark is the midpoint between the averages of the four public and four private institutions. The four public institutions are Illinois, Michigan, University at Buffalo and Virginia; the four private institutions are Harvard, MIT, Stanford and Yale. UC’s faculty salaries fall significantly below those of the comparison private institutions and are just keeping pace with the four public institutions.
UC’s faculty have grown in racial/ethnic and gender diversity.
5.3.1 Ladder-rank and equivalent faculty by race/ethnicity, headcount, Universitywide, Fall 2007 to fall 2016
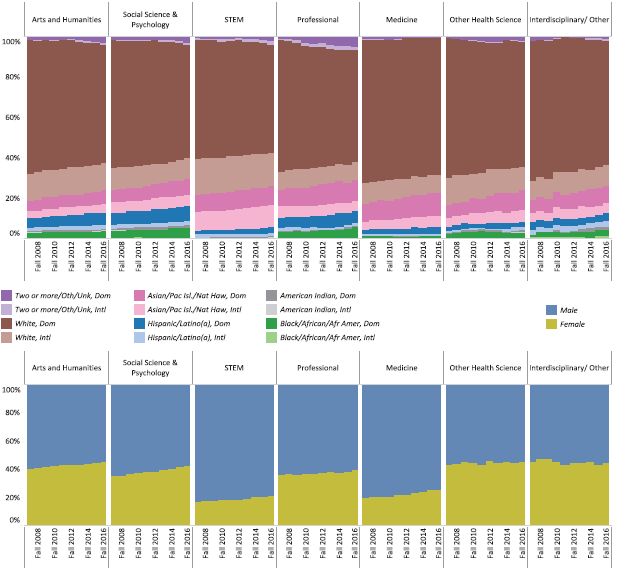
Source: UC Corporate Personnel System1
The increase in the share of ladder-rank and equivalent (LRE) faculty who are underrepresented minorities has largely been due to an increase in the Hispanic/Latino(a) group. Representation by American Indian and African American faculty remains a challenge.
Female LRE faculty have grown in share over time, fueled by increased diversity in hiring. Their proportion differs significantly depending on discipline.
1STEM includes engineering and computer science, life sciences, math, medicine, other health sciences and physical sciences.
UC continues to expand the portion of female and URM faculty, with greater diversity among faculty than many peer institutions.
5.3.2 Percent of tenure and tenure-track faculty who are female and/or from underrepresented racial/ethnic groups, UC and comparison institutions, Fall 2015
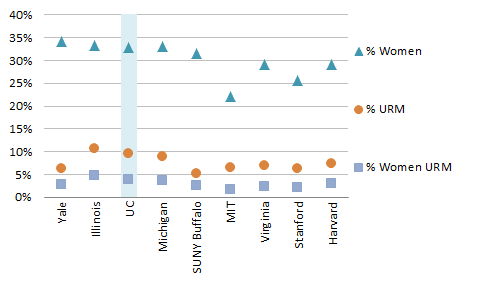
Source: IPEDS1
The proportion of women and underrepresented minorities continues to grow at a modest pace. When these diversity figures are displayed in the context of other peer research institutions in the U.S., namely the “Comparison 8,” UC compares favorably. According to 2015 data, UC is tied for second for the percentage of women faculty, at 33 percent. Additionally, UC places second for the percentage of URM faculty and women URM faculty, at 10 percent and 4 percent respectively.
UC’s hiring of underrepresented and women faculty lags behind the national availability in several broad discipline groups.
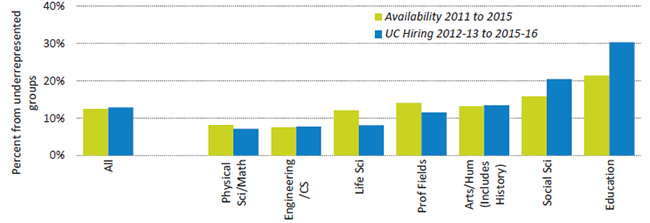
5.3.3 New assistant professors compared with national availability for underrepresented minorities by discipline, Universitywide, 2011–12 to 2014–15
5.3.4 New assistant professors compared with national availability for women by discipline, Universitywide, 2011–12 to 2014–15
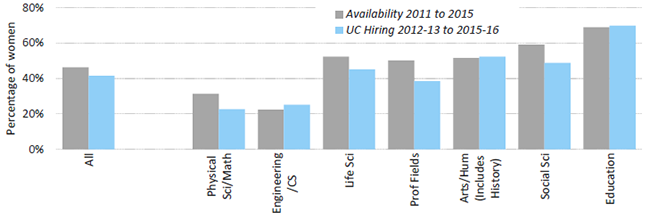
Source: UC Academic Personnel and Program Administration and Survey of Earned Doctorates1
The University of California remains deeply committed to diversifying its faculty and taking full advantage of the available pools of qualified candidates. Between 2011 and 2015, underrepresented minorities (URMs) accounted for 12.5 percent of the pool of nationwide doctoral degree recipients and 13 percent of UC’s new assistant professor hires.
Between 2011 and 2015, women constituted 46% of the nationwide pool of new doctoral degree recipients and 41.5 percent of UC’s new hires. At a time when the nation’s pool of doctoral degree recipients is showing increasing numbers and percentages of women, outreach and recruitment efforts at UC are not generating faculty hire rates that are fully reflective of changes in national availability pools, although the differential varies by field.
1 This analysis follows the campus practice required for federally mandated affirmative action plans; UC is required by Proposition 209 to satisfy federal reporting requirements in this area. See the appendix for additional details.
In the past few years, hiring of new faculty has started to rebound from a drop due to state budget cuts.
5.4.1 New hires and separations of ladder-rank and equivalent faculty, Universitywide, 1984–85 to 2015–16
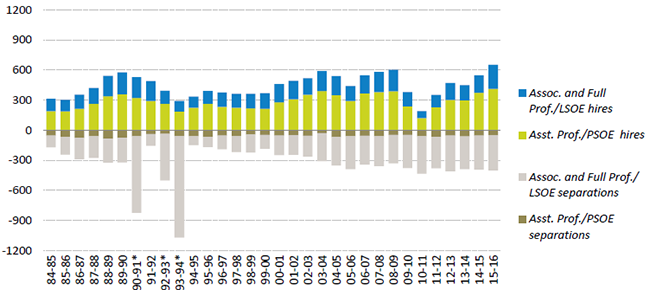
Source: UCOP Office of Academic Personnel and Program Administration1
5.4.2 Net change in ladder-rank and equivalent faculty, Universitywide, 1984–85 to 2015–16
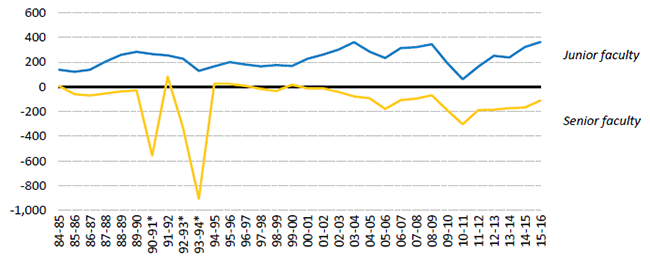
Faculty hiring decreased significantly from 2009 to 2011 in response to fiscal constraints. However, there has been an uptick in new hires since 2011–12.
Since 2003–04, faculty separations have exceeded 300 per year.
1Associate and full professors shown here are tenured faculty; assistant professors are nontenured, tenure-track faculty. A very small number of lecturers with security of employment are included in the assistant category. Ladder-rank associate and full professors are tenured; assistant professors are eligible for tenure.
*Years with Voluntary Early Retirement Incentive Program (VERIP).
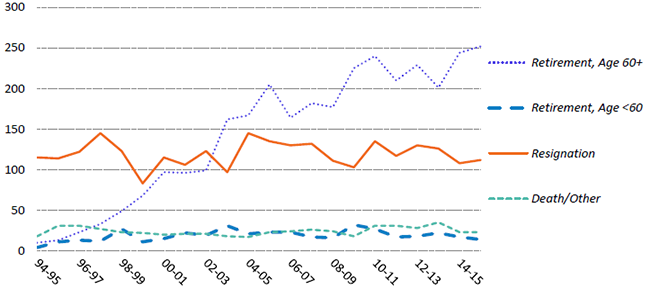
The number of faculty who have retired at age 60 or above has grown in the past 15 years; other types of departures have remained constant.
5.5.1 Departure reasons of faculty, Universitywide, all faculty, 1994–95 to 2015–16
Indicator 5.5.2 Departure reasons of faculty by rank, Moving four-year average, 1997–98 to 2015–16 (SCALES VARY)
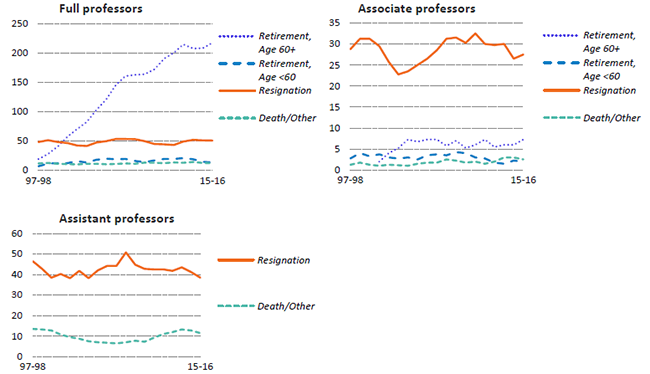
Source: UCOP Office of Academic Personnel and Program dministration1
1 “Other” reasons include faculty whose appointments ended or who were not tenured or not renewed. The data shown are the average of the past four years. For example, the figure for 10–11 is the sum of departures from 07–08 to 10–11 divided by four.