Workforce demographics
Like all universities, UC has both academic and nonacademic employees. The academic employees (faculty, researchers, librarians, academic administrators, etc.) constitute about 30 percent of UC’s workforce; nonacademic employees (staff) constitute the remaining share of the workforce. This chapter describes UC’s nonacademic workforce in size and structure, age distribution and compensation relative to market levels.
As of fall 2016, UC employed 150,9941 nonacademic staff (or 110,254 FTE) across a wide range of occupational categories, including doctors, nurses and other health care staff; research administration and laboratory staff; student services staff; food and auxiliary services staff; maintenance and physical plant staff; and management and clerical staff.
Funding sources and the structure and composition of the staff workforce have changed significantly over the past decade. Hospital and health science funds, for example, support an increasing share of staff, while general funds, which are primarily state funds and student fees and tuition, constitute a shrinking proportion. Growth in staff personnel has been driven primarily by expansion in teaching hospitals, with additional growth due to increases in research activity and auxiliary enterprises such as residence halls and food service. Consistent with an increase in UC’s complexity and the proliferation of technology, the proportion of highly skilled professional staff also has increased — a shift that aligns with national trends.
Workforce strategies related to staff
In 2015, UCOP Human Resources updated the Human Resources Strategic Plan from 2010. Directed at staff, the plan focuses on employee relations, labor relations, compensation and benefits. The University is striving to construct programs that provide value and engage its employees. In the 2015 systemwide staff engagement survey, employees cited performance management as a key concern. Recognizing that quality personnel are essential for maintaining excellence, one of the University’s human resource initiatives is to implement a systemwide classification system for all staff, which would organize positions into functional groupings, assign market-based salary structures for competitive pay opportunities, and provide well-defined job tracks to support employees’ career development efforts.
Looking forward — staff renewal challenges
Inconsistencies in delivering an annual salary program have put pressure on UC’s competitive position in employment markets. While the frequency of annual increase programs has improved, UC is still experiencing the effects of past years when an increase program could not be funded. With more than one-third of UC staff age 50 or older, UC will likely face challenges from increased turnover rates due to an impending retirement bubble and a continuing economic recovery that may provide alternative opportunities for staff.
For more information
1As of the 2017 report headcounts now include employees with any earnings. In previous reports only employees with base pay were counted.
Staff growth has been greatest in UC Health, encompassing the teaching hospitals and health science education programs. Since 2007, UC Health has seen staffing increase by almost 30 percent. In contrast, general campus staff levels (excluding student employees) grew by less than 7 percent. This is less than a third of the 24 percent increase in general campus student enrollment over this same period.
6.1.1 Staff FTE (full-time-equivalent) workforce growth over time, Universitywide, Fall 2007* and 2016
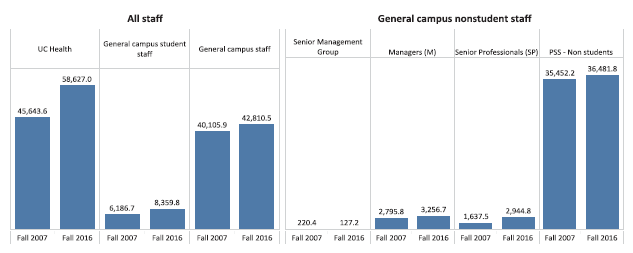
Source: UC Corporate Personnel System
* The fall 2007 General Campus nonstudent staff figure includes eighty-one Senior Management FTE whose positions, in 2010, were moved from the Senior Management category to the Academic category in recognition that their primary role is academic. All staff measures in this chapter exclude Lawrence Berkeley National Laboratory, Hastings School of the Law and Associated Students UCLA.
UC operates five teaching hospitals as well as schools of medicine, dentistry, nursing and other health sciences education and research programs. Together these UC Health hospitals and academic programs have experienced proportionally greater growth in staffing since 2007 than the remaining components of UC (including the Office of the President), which are considered “General Campus.”
Teaching hospitals and other health sciences programs accounted for nearly 75 percent of the nonacademic staff increase between 2007 and 2016 (12,984 FTE); this growth is largely related to increased demand for medical care. General Campus nonstudent staff and student employees each accounted for less than 15 percent of the growth (2,704 and 2,173 FTE, respectively). The growth in student employees is largely related to the additional 48,000 students UC has enrolled on the general campuses over this period. About half of the student employees in staff positions are work-study students who work on campus as part of their financial aid package.
The growth in Senior Professional staff is a reflection of the professionalization of UC’s workforce, similar to changes seen in the wider labor market over the past seven years. This has resulted in an increased number of analytical and technical jobs and a reduction in the clerical workforce. The other area with significant growth is professional support staff, which includes such diverse occupations as nurses, computer analysts and technicians, administrative and financial analysts, groundskeepers, food service workers and many others.
Since 2007, the number of staff supported by general funds has fallen as state funding for the University has decreased. At the same time, the number of staff funded by hospital and health science sources has increased.
6.1.2 Nonstudent staff FTE (full-time-equivalent) workforce, by fund source, General campus and UC Health, Fall 2007 and 2016
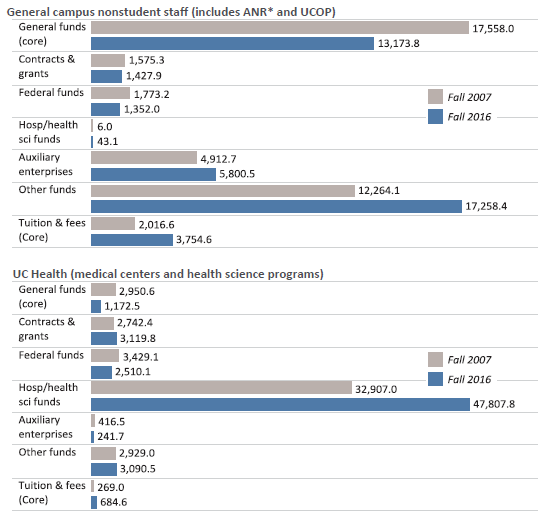
Source: UC Corporate Personnel System. Not shown are general campus staff who are also students (8,359.8 FTE in 2016).
*ANR is the division of Agriculture and Natural Resources
Between October 2007 and 2016, staff growth was concentrated among teaching hospital employees, due to increasing demand for health care, driven largely by growth in Medi-Cal and other government programs. These employees are primarily supported by hospital and health science funds.
Most of the increase in campus employees is attributable to growth in numbers of staff supported by noncore funds, such as health science funds, research funds, federal support, auxiliaries and other sources.
Over the past nine years, changing technology and workforce needs have led to a higher need for staff in computer, health care and analytical occupations, and a reduction in clerical staff.
6.1.3 Nonstudent staff FTE, by occupation group, Universitywide, Fall 2007 and 2016
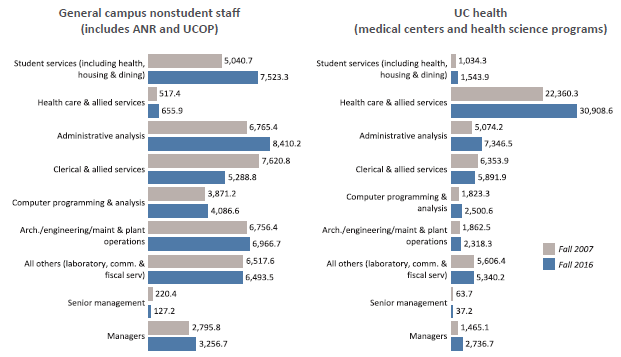
Source: UC Corporate Personnel System1
Technological advances have had a marked effect on staffing needs as computers increasingly perform tasks once requiring significant time and manual effort. Technology has also created a need for more staff with higher-level skills, such as information technology expertise and fiscal management experience. This is reflected above in the decline of clerical staff FTE and the growth of administrative analysis FTE.
In the past nine years, student enrollment has also grown, with a corresponding increase in staff supporting student services.
The number of health care employees has grown faster than any other group. Health care staff in the medical centers are funded from patient services revenues.
1Not shown are general campus staff members who are also students (8,359.8 FTE in 2016). Oct 2007 General Campus and UC Health nonstudent staff figures include eighty-one and nine Senior Management FTE staff, respectively, which were later categorized into academic positions.
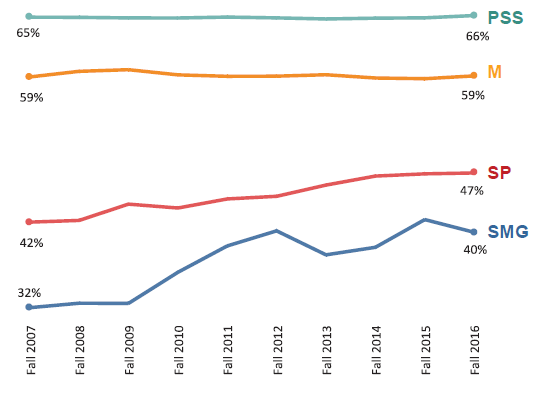
Over the past 15 years, the proportion of nonwhite staff has grown at all staffing levels; however, the proportion of nonwhite staff is lower in more senior positions. Female representation at the PSS and MSP levels has stayed flat, while it has grown at the SMG level.
6.1.4 Racial/ethnic and gender distribution of nonstudent career staff, Universitywide, Fall 2007 to 2016
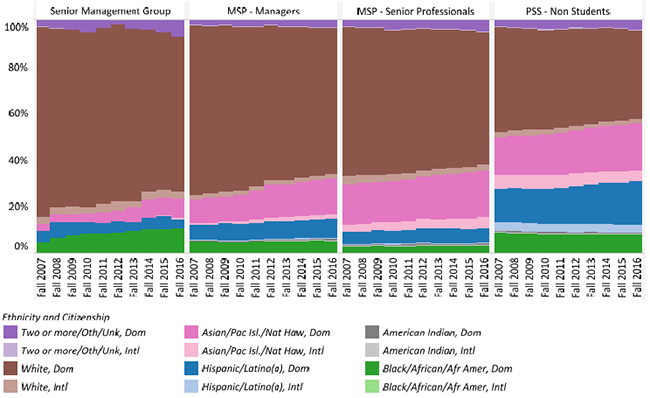
UC has sought to improve representation of domestic racial/ethnic groups that have been historically underrepresented. University employment of underrepresented racial/ethnic groups (African American, American Indian and Hispanic/Latino(a)) has grown over the past 15 years. However, ethnic minorities are still underrepresented, particularly in the Manager (M), Senior Professional (SP) and Senior Management Group (SMG) categories.
Career female staff by personnel program, Universitywide, Fall 2007 to 2016
Source: UC Corporate Personnel System
The percentage of female employees at UC has stayed relatively flat at both the PSS and Manager levels, while it has grown steadily in the SMG and Senior Professional categories.
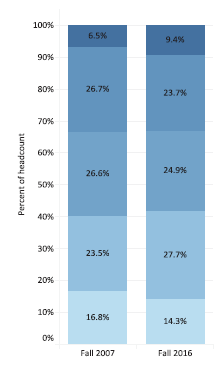
Overall, the average age of the UC staff career workforce was slightly higher in 2016 than in 2007. The largest growth occurred in the over-60 and 30-39 age ranges.
6.2.1 Age distribution of career staff, Headcount, Universitywide, Fall 2007 and 2016
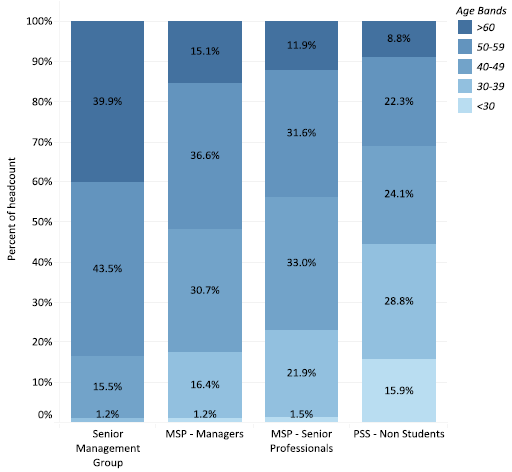
6.2.2 Age distribution of career staff by personnel program, Headcount, Universitywide, Fall 2016
Source: UC Corporate Personnel System
Since 2007, the age distribution of UC’s staff has changed. The groups that have seen the largest percentage point increases are the over-60 and 30–39 age ranges. The groups that have seen the greatest percentage point decreases are the below-30 and 50–59 range. Questions of the preservation and transmittal of institutional memory and of succession planning have become more important in the current environment.
The Senior Management Group (SMG) and the Managers and Senior Professionals (MSP) group have higher average ages because positions in these personnel programs generally require more experience and entail a higher level of responsibility. The Professional and Support Staff (PSS) group contains a lower proportion of older staff personnel.
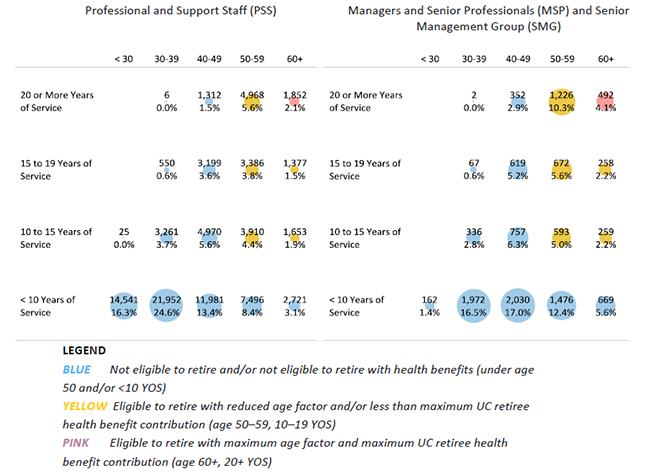
While many staff members are nearing retirement eligibility, less than 5 percent of staff have the combination of age and years of service to qualify for the maximum retirement benefit factors.
6.2.3 UC retirement program active career staff headcount by age and years of service (YOS), Universitywide (Note scale differences) Fall 2016
Source: UC Retirement System
UC Pension Plan benefits are designed so that the highest benefits commence at age 60 for employees hired before July 1, 2013 and at 65 for those hired after. Actual benefits depend on total years of service and highest average compensation. To be eligible for the maximum UC contribution for retiree health benefits, a retiring employee must have 20 years of service.
UC monitors the number and proportion of staff nearing or at retirement age because replacing experienced staff is a critical component of managing staff resources. About 2 percent of PSS staff and almost 5 percent of management staff are age 60 or above with 20 or more years of service. This is somewhat higher than the ratios of ten years ago.
The proportion of staff who are eligible to retire but with less than the maximum age factor and/or eligibility for UC retiree health benefit contribution has grown slightly since 2004.
On average, growth rates for staff salaries over the last 16 years are below market rates in the Western region benchmark.
6.3.1 UC base salary increases compared with market averages, Universitywide, 2000–01 to 2016–17
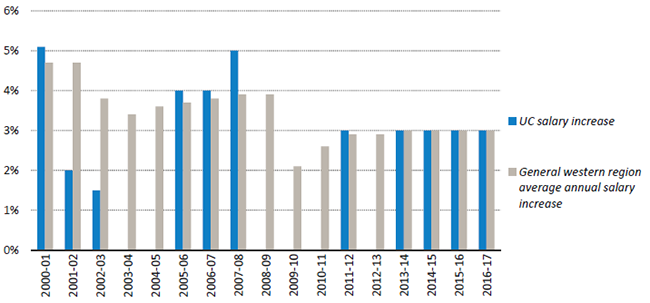
Source: UC Human Resources1
In recent years, UC salary increases have been on par with the “Western U.S. Region” data as reported in the “WorldatWork Salary Budget Survey” conducted by the WorldatWork Human Resources Association. However, due to several years with zero salary increases, UC salaries still lag behind the WorldatWork benchmark. UC salaries have increased an average of 2.2 percent annually over the last sixteen years, while the WorldatWork benchmark has been 3.4 percent.
Going forward, UC employees are now contributing more to health care costs and to the UC retirement system, which could further erode the competitiveness of UC total compensation compared with the regional labor market.
The chart above presents comparative data for base salaries only.
1 Excludes medical centers. Nonrepresented staff only.
UC chancellors place among the lowest-paid when compared to their Association of American Universities (AAU) peers, despite recent UC salary increases.
6.4.1 Base salaries and additional pay for UC and AAU institution leaders
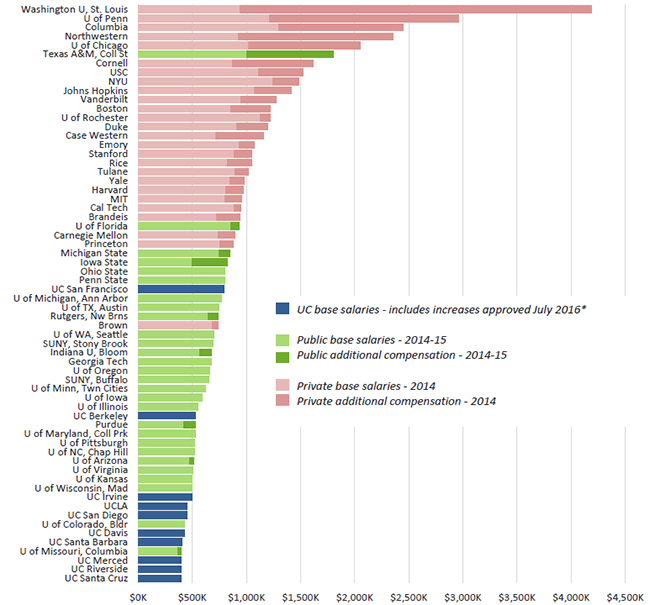
Source: The Chronicle of Higher Education Executive Compensation Report and institutional data sources1
UC Chancellors place among the lowest-paid university leaders when compared with their AAU peers. Despite recent salary increases, the placement of UC chancellors remains unchanged from the previous analysis in June 2016. Nine UC chancellor salaries fall among the lowest third in this comparison group. UC San Francisco, an exclusively graduate health science campus, is the only exception. Eight UC chancellors are among the ten lowest-paid leaders within this comparison group.
1Base salary is the minimum salary an employee receives. Additional compensation includes other pay (e.g., bonus & incentive, severance and deferred paid out). It does not include deferred compensation set aside. UC chancellors do not receive additional compensation. As per Chronicle instructions, auto allowances are not included. Note: Where there was a change of leadership during the course of the year, an annualized base salary was calculated from the salary reported for the partial year.
The UC President’s salary ranks 10th among 16 public university systems.
6.4.2 Annualized base salaries and additional compensation, UC and comparison public institutions
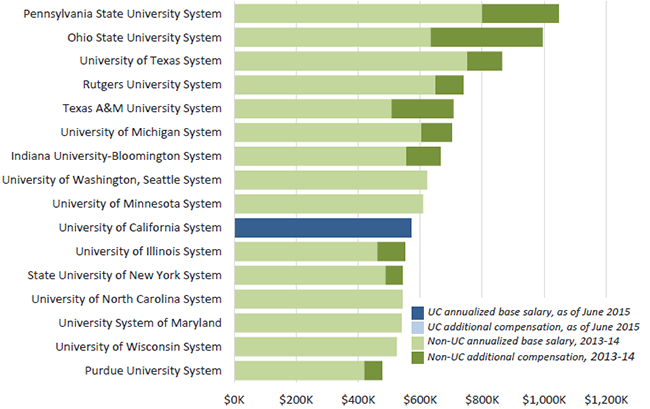
Source: The Chronicle of Higher Education and the Institutional Research & Academic Planning unit of the UC Office of the President1
The salary for the President of the UC system places tenth within 16 selected comparable research university systems with similarity to UC. For the purposes of this report, a system leader is a chancellor or president who administers or coordinates multiple campuses.
Additional compensation includes forms of pay such as lump sum compensation for special assignment, incentive pay and deferred compensation and bonuses are often added to the base salary an employee receives. Deferred compensation (set aside) is not included.
1Base salary is the minimum salary an employee receives. The UC President does not receive additional compensation.
Note: Where there was a change of chancellor/president during the course of the year, an annualized base salary was calculated from the salary reported for the partial year.