Accountability Report 2018

chapter one: undergraduate students: admissions and enrollment

History

On March 23, 1868, California Governor Henry Haight signed the charter that created the University of California, setting in motion the bold idea that college should be available to everyone. In 1869, UC opened its doors in Berkeley with 40 students and 10 faculty members. The University started admitting women equally with men the following year, and eight women registered in fall 1870, more than 20 years before Stanford did the same.

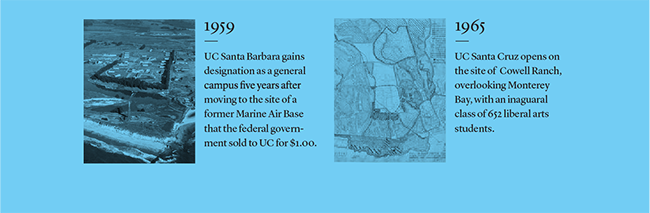
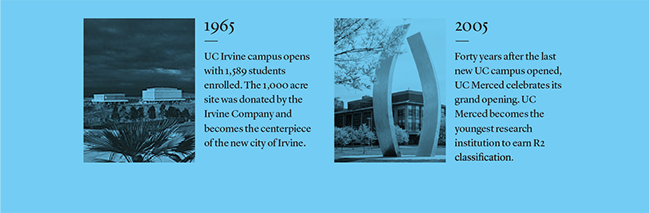
The University has grown both by opening its own new campuses and by merging with existing institutions. Since the first campus opened 150 years ago, UC has established nine campuses across California to fulfill the mission of educating California’s undergraduate students. In 1905, the University Farm Bill called for the establishment of a farm school for the University of California, which would become UC Davis; in 1919 the Los Angeles State Normal School became the Southern Branch of the University of California, now known as UCLA; UC Riverside merged with the Citrus Experiment Station and began teaching classes in 1954; UC San Diego grew out of the Scripps Institution of Oceanography and came into its current incarnation in 1960; UC Santa Barbara also began as a State Normal School and became a UC general campus in 1959; UC Santa Cruz and UC Irvine were designed as UC general campuses and both opened in 1965; UC Merced, located to serve the growing Central Valley, opened in 2005.
Goals

One of the University of California’s highest priorities is to ensure that a UC education remains accessible to all Californians who meet its admissions standards. This goal is articulated in California’s Master Plan for Higher Education, which calls for UC to admit all eligible freshmen and transfers with freshman eligibility, with the intention of capturing the top 12.5 percent of California public high school graduates. It also calls for UC to admit all qualified transfer students from California Community Colleges (CCCs).

Nearly 172,000 students applied as freshmen and over 38,000 as transfers for fall 2017. Campus admission decisions are based on a comprehensive review of qualifications, and campuses establish the incoming California resident class size based on state funding. Increased state support allowed the University to increase enrollment of California residents by nearly 4,000 in fall 2017 compared to fall 2016, following an increase of over 7,000 in fall 2016.

For 2017–18, UC also is estimated to have achieved its goal of enrolling a 2:1 ratio of freshmen to transfer California resident undergraduates, excluding Merced. The UC Transfer Pathways initiative supports this goal by helping community college students prepare for transfer admission to the most popular majors at UC campuses.
Admissions — freshmen

UC relies on a comprehensive review process to make admission decisions, considering not only completion of rigorous college preparatory courses, high school GPA and standardized test scores, but also talents, special projects, accomplishments in light of life experiences and circumstances, extracurricular activities and community service.

UC continues to reach its Master Plan goals by guaranteeing admission to California resident applicants who are either in the top nine percent of high school graduates statewide or the top nine percent of graduates from their own high school. Qualified freshman applicants are offered an opportunity to be admitted to another UC campus if they do not receive an offer of admission from the UC campuses to which they applied.
Admissions — transfers

A key recommendation stemming from the 2013 President’s Transfer Action Team was to streamline the transfer process for prospective UC students. To that end, the UC Transfer Pathways initiative set out to identify a common set of lower-division courses for each of UC’s 21 most popular majors among transfer applicants. These new Transfer Pathways would present a clear roadmap for prospective transfers to prepare for their major and be well positioned to graduate in a timely fashion from any UC campus. In April 2017, UC signed an agreement with the California Community Colleges (CCCs) to guarantee a place within the UC system to students who complete one of the transfer pathways and achieve the requisite grade point average (GPA). Almost all transfer students enter UC as upper-division juniors. Campus enrollment targets are based on state funding as well as capacity in major programs at the upper-division level.
Enrollments
The University enrolled 217,000 undergraduates in fall 2017. The University enrolls freshman and transfer students from every county of California, but students tend to enroll in campuses closer to their residence. UC’s Eligibility in the Local Context (ELC) program is designed to increase the overall geographic diversity of entrants and this goal is also addressed as a recommendation in the Transfer Action Team report.

Undergraduate Enrollment, Fall 2017
New Freshmen: 46,014
New Transfers: 20,151
Continuing Students: 150,582
TOTAL: 216,747
Source: UC Data Warehouse

As academic qualifications have improved over the last decade, UC has maintained access for populations that are historically underserved by higher education. In fall 2017, 38 percent of new undergraduates received Pell Grants—a marker for low-income status—and 42 percent did not have parent(s) who completed a four-year college degree.

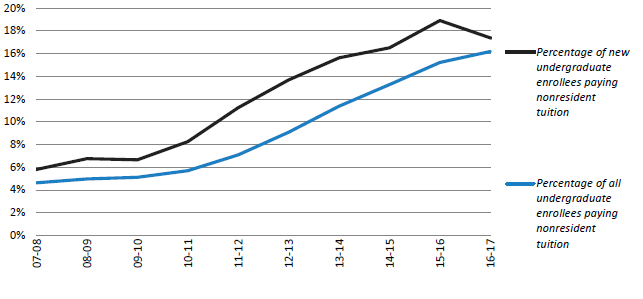
The share of all undergraduates who are nonresident domestic and international students has increased in recent years, though their proportion is still much lower than at comparable public research universities. In 2016–17, the share of new undergraduates paying nonresident tuition went down after increasing in recent years. In May 2017, UC adopted a policy affirming that nonresident undergraduates “will continue to be enrolled in addition to, rather than in place of, funded California undergraduates at each campus.” The policy also caps nonresident enrollment at 18 percent for five UC campuses (Davis, Merced, Riverside, Santa Barbara and Santa Cruz) and capped nonresident enrollment for the remaining four campuses (Berkeley, Irvine, Los Angeles and San Diego) at the proportion each campus enrolls in 2017–18.

Having California students learn and live alongside students from backgrounds and cultures different from their own is part of a world-class educational experience. California students also benefit from the extra tuition paid by nonresident undergraduates, which is about $28,000 more than the amount paid by residents. That tuition helps to fund faculty hires, instructional technology, student advising and other services that directly benefit California students.
Admissions and enrollment trends

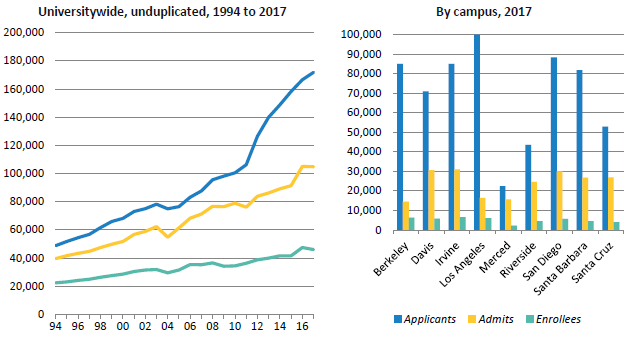
Freshman applicants have more than tripled over the past two decades, averaging six percent growth per year. In fall 2017, the number of applicants increased three percent compared to the previous year while the number of students admitted went down slightly (less than one percent) (1.1.1).

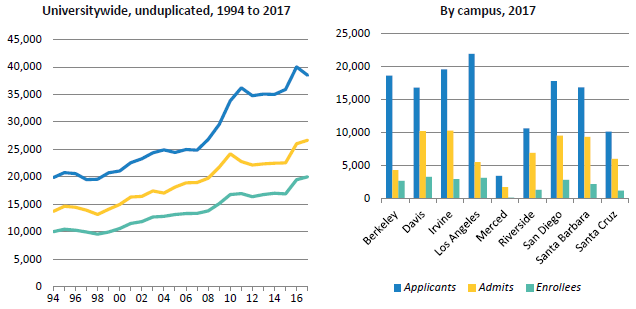
Fall transfer applicants nearly doubled over the last 20 years, with average annual growth of three percent. In fall 2017, transfer applicants went down four percent compared to the previous year, while admits and enrollees both went up three percent (1.1.2).

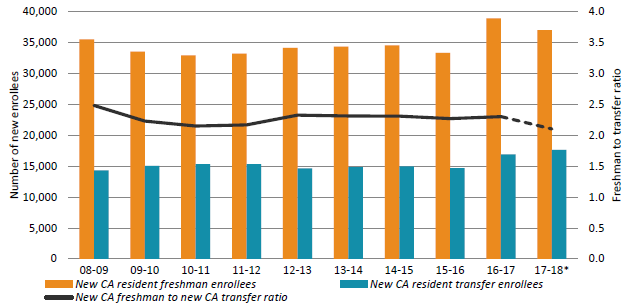
The Master Plan specifies that the University maintain a 60:40 ratio of upper-division to lower-division students, which corresponds to a 2:1 ratio of new California resident freshmen to new California resident transfers. UC has moved closer to that ratio, from 2.3:1 in recent years to an estimated 2.1:1 in 2017–18 (universitywide). The universitywide ratio (excluding Merced) is estimated to be 2.0:1 for 2017-18, achieving the systemwide goal for this metric (1.1.3).

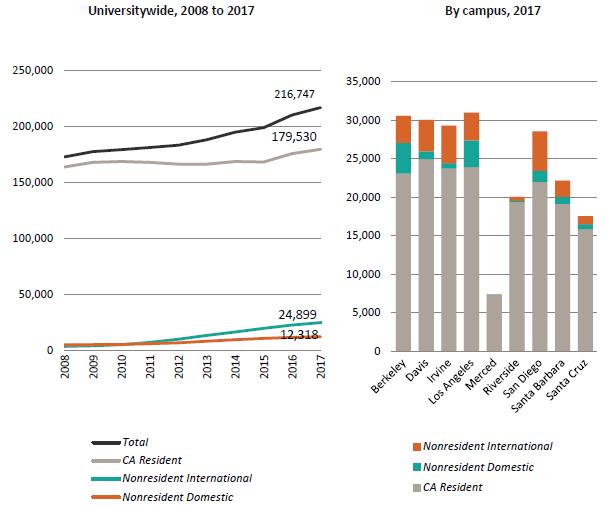
Overall undergraduate enrollment (new and continuing students) continued to grow in fall 2017. Total enrollment was nearly 217,000 in fall 2017, up three percent from the year before. This includes an increase in California residents of nearly 4,000, following an increase of over 7,000 in fall 2016 (1.1.4).

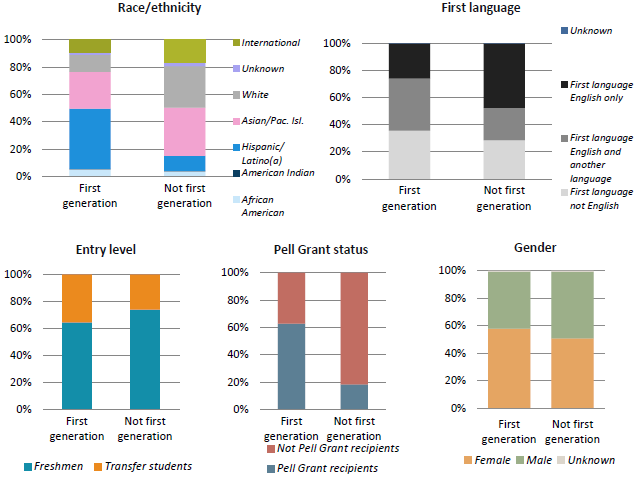
About 42 percent of UC’s entering students are first-generation, meaning neither parent graduated from a four-year college. These students are more likely to be from an underrepresented group, to have a first language other than English, to enter as a transfer student, to be female and/or to have a lower income than students with at least one parent who graduated from a four-year college (1.2.1).
Academic preparation
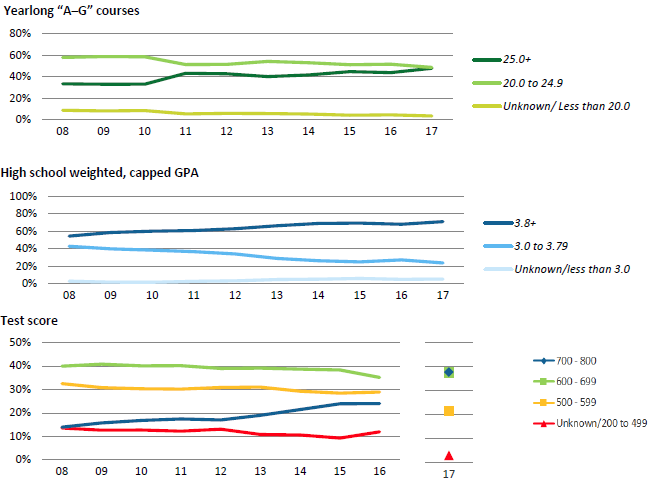
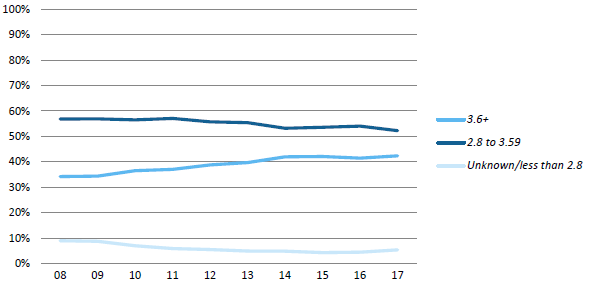
Freshmen entering UC are increasingly well prepared, as shown by changes in the number of college preparatory courses, high school GPA and test scores over time (1.3.1). Transfer students are also increasingly well prepared, as measured by college GPA (1.3.2).

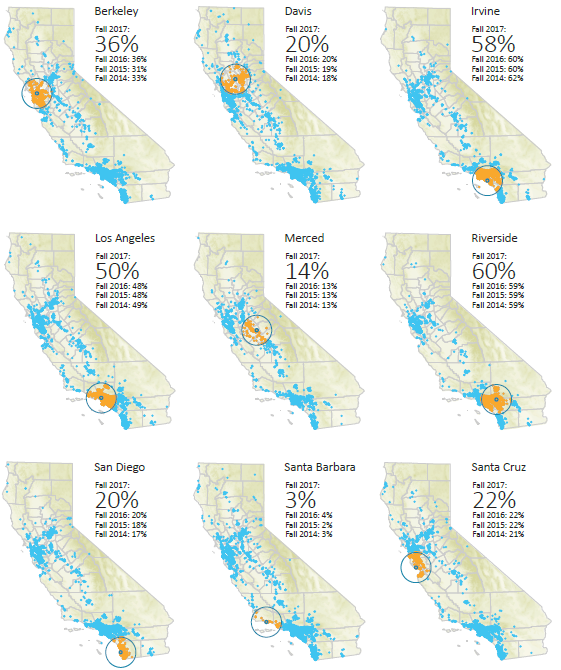
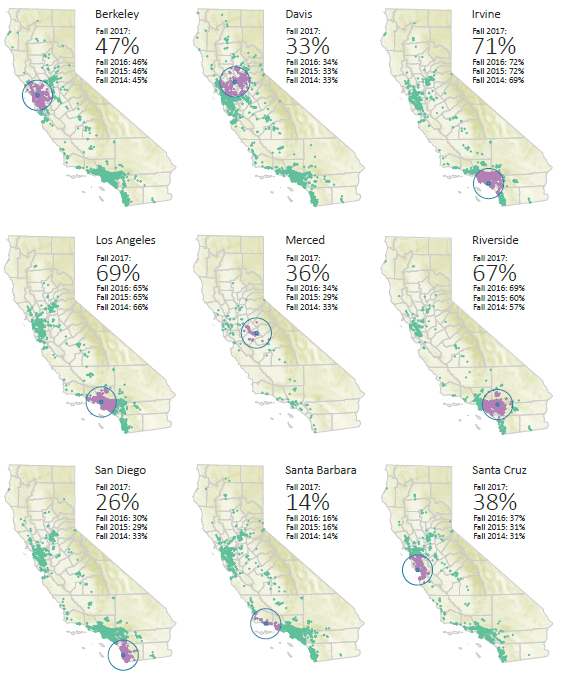
Geographic origins and nonresidents
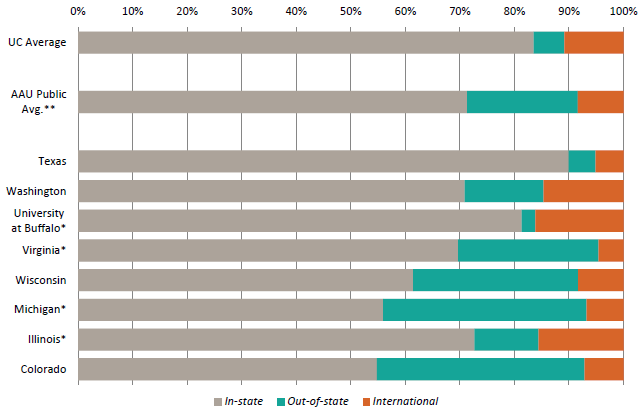
UC has a lower proportion of out-of-state undergraduates than other public Association of American University (AAU) comparators. In fall 2016, only 16.5 percent of UC’s enrollees were out-of-state or international, compared with 28.7 percent for other AAU publics (1.4.1). About 34 percent of freshmen and 46 percent of transfer students entering UC campuses come from within 50 miles of campus. These numbers are quite stable and have actually risen slightly over the past few years (1.4.2, 1.4.3). Although the share of all undergraduates paying nonresident tuition has gone up in recent years, the proportion of new undergraduate students paying nonresident tuition went down in 2016–17 (1.4.4).
Looking ahead

The University is committed to sustaining access and educating as many California residents as it can. UC, in the last two years, has already achieved its three-year plan to increase California undergraduate resident full-time equivalent (FTE) enrollment by 10,000. Next year, it is planning to increase California resident FTE enrollment by at least another 2,000.
For more information

UC admissions data:


Demand for UC continues to grow.

1.1.1 Freshman applicants, admits and enrollees, Universitywide, Fall 1994 to 2017

Freshman applicants, admits and enrollees, Universitywide

Source: UC Data Warehouse1

The rapid growth in freshman applicants to UC over the past two decades demonstrates the increased demand for college education, the growth of California’s population and UC’s continued popularity. UC maintains its obligations under the Master Plan by guaranteeing admission to all qualified students.

From 2011 to 2017, unduplicated freshman applicants grew 62 percent (or about eight percent per year) from about 106,000 to about 172,000, compared to a 42 percent increase in the seven-year period between 2004 and 2011 (or about five percent per year) from about 75,000 to 106,000. The 62 percent growth represents about 66,000 applicants, including about 27,000 California residents.

Qualified applicants who are not offered admission at the campus(es) to which they applied to are offered admission to another campus by a referral process. A change in accounting for referral students is responsible for the apparent drop in 2011 admits. Beginning that year, UC Merced admitted only students who indicated interest in a referral offer, rather than every student who qualified for an offer.

Most campuses admit less than half of applicants. Many applicants apply to more than one UC campus. In fall 2017, each UC applicant applied to an average of 3.7 campuses. Freshman applicants increased on all campuses in fall 2017. For data tables on UC freshman applicants, admits and enrollees by campus over time see: universityofcalifornia.edu/infocenter/admissions-residency-and-ethnicity.

1 Admits and enrollees here include applicants guaranteed admission who are not offered admission at a campus to which they applied but who are referred to and admitted by another campus. Some campuses admit fall applicants for a subsequent term (winter or spring). These “rollover” admits and enrollees are excluded in the graphs. Students who apply to multiple UC campuses are counted only once in the Universitywide indicator.


Transfer admits and enrollees continued to increase in 2017.

1.1.2 Transfer applicants, admits and enrollees, UC campuses, Fall 1994 to 2017

Transfer applicants, admits and enrollees

Source: UC Data Warehouse1

Applications went down, but admits and enrollees increased in 2017 as the University continued to increase California resident enrollment. Over 38,000 transfer students applied, nearly 27,000 were admitted and over 20,000 enrolled in fall 2017. Consistent with UC’s commitment to transfer students from California Community Colleges (CCCs), the fall enrollment of new CCC California resident transfers has nearly doubled since 1994 (from 8,400 to 16,300).

A key recommendation in the 2014 Transfer Action Team Report was to streamline the transfer process for prospective UC students. This led to the creation of the UC Transfer Pathways, which identify a common set of lower-division courses for each of UC’s 21 most popular majors among transfer applicants. These new Transfer Pathways present a clear roadmap for prospective transfers to prepare for their major: 

TRANSFER PATHWAYS MAJORS
Anthropology Economics Philosophy
Biochemistry Electrical engineering Physics
Biology English Political science
Business administration Film and media studies Psychology
Cell biology History Sociology
Chemistry Mathematics  
Communication Mechanical engineering  
Computer science Molecular biology  


For fall 2017, the initial year of the Transfer Pathways, almost 80 percent of those indicating Pathway-based preparation were admitted and enrolled. They represented 46 percent of all CCC admits and 47percent of all CCC enrollees. Many of these students also participated in other preparatory programs such as Transfer Admissions Guarantee (TAG) and Intersegmental General Education Transfer Curriculum (IGETC).

For data tables on UC transfer applicants, admits and enrollees by campus see:
www.universityofcalifornia.edu/infocenter/admissions-residency-and-ethnicity.

1Admits and enrollees here include the referral pool. Some campuses admit fall applicants for a subsequent term (winter or spring). These “rollover” admits and enrollees are excluded in the graphs here, which only show fall data.


UC continues to work toward achieving its goal of a 2:1 ratio of California resident freshmen to transfer students.

1.1.3      New freshmen and transfer students, Universitywide, 2008–09 to 2017–18 

Transfer applicants, admits and enrollees, Universitywide

Source: UC Corporate Student System and UC campuses1

The Master Plan calls for UC to accommodate all qualified resident California Community College (CCC) transfer students. It specifies that the University maintain at least a 60:40 ratio of upper-division (junior- and senior-level) to lower-division (freshman- and sophomore-level) students to ensure adequate upper-division spaces for CCC transfers. To do so, UC aims to enroll one new California resident transfer student for every two new California resident freshmen, or 67 percent new resident freshmen to 33 percent new resident transfer students. UC has moved closer to that ratio, from 2.3:1 in recent years to 2.1:1 in 2017–18 (universitywide). Excluding Merced, the ratio in 2017-18 is estimated to be 2.0:1, meeting the systemwide goal.2 Nearly all (95 percent) of California resident transfer students in fall 2016 came from CCCs.

2017-18* % New CA resident freshmen % New CA resident transfers Ratio of new CA freshmen to new CA transfers
Berkeley 66% 34% 2
Davis 59% 41% 1.5
Irvine 67% 33% 2.1
Los Angeles 63% 37% 1.7
Merced 92% 8% 11.9
Riverside 76% 24% 3.2
San Diego 65% 35% 1.9
Santa Barbara 67% 33% 2
Santa Cruz 73% 27% 2.7
Universitywide, all campuses 68% 32% 2.1
Universitywide, excl. Merced2 67% 33% 2

1 Full year headcount enrollment. * The actual figures for 2017-18 are not yet available and may differ from the estimated figures shown here.

2 Merced is excluded from the 2:1 ratio goal that is part of the Budget Framework agreement with the governor.


UC’s fall undergraduate headcount grew by three percent between fall 2016 and fall 2017, mostly due to increased California resident enrollment.

1.1.4      Undergraduate headcount enrollment, Universitywide, Fall 2008 to 2017

Transfer applicants, admits and enrollees, UC campuses

Source: UC Data Warehouse

The University and the state share the goal of expanding access to a UC education. Increased state support allowed the University to enroll 3,900 additional California residents in fall 2017 compared to fall 2016, following an increase of over 7,000 California residents the previous year. The 3,900 additional California residents represent almost 60 percent of the overall increase of 6,600 for fall 2017.

This continued growth following years of constrained resources has caused several challenges, including limited resources for instruction, increased demand for advising and other student services, and housing shortages. UC is responding with investments in student facilities and services (see indicator 12.2.3).


UC’s entering first-generation students are more likely to be from an underrepresented group (URG), to have a first language other than English, to enter as a transfer student and/or to have a lower income than students with at least one parent who graduated from college.

1.2.1      Entering students by first-generation status, race/ethnicity, first language spoken at home, Pell Grant receipt and entering level, Universitywide, Fall 2017

First-generation undergraduate students, Universitywide and very selective public and private research universities

Source: UC Data Warehouse1

Half (50 percent) of entering first-generation students in fall 2017 are URGs, compared to 15 percent of non-first-generation students. Over one-third (36 percent) of first-generation students’ first language was not English, versus 29 percent for others. Over one-third (35 percent) of first-generation students entered as transfers, versus 26 percent for others. Nearly two-thirds (63 percent) of first-generation students are lower-income Pell Grant recipients, versus 18 percent for others. And nearly three-fifths (58 percent) of first-generation students are female, compared to just over half (51 percent) of others.

1 First-generation students are those whose parent(s) did not complete a four-year college degree. Total of first-generation students is 27,830 (42.1%); non-first-generation students total 36,472 (55.1%); and missing/unknown are 1,863 (2.8%). Those with unknown first-generation status are excluded from charts. Pell Grant receipt is used as a proxy for low-income status. Less than .02% of entering students have an unknown first language.


Freshmen entering UC are increasingly well-prepared.

1.3.1 A–G (college preparatory)1 courses; weighted, capped high school grade point average (GPA)2; and standardized test scores3 of entering freshmen, as share of class, Universitywide, Fall 2000 to fall 2017

A-G courses, weighted capped GPA and standardized test scores of entering freshmen


Source: UC Application Processing data (A–G courses and test score) and UC Data Warehouse (GPA)

The academic qualifications of UC entering freshmen have improved over time, as reflected by an increase in the share of students completing 25 or more college-preparatory courses, having a 3.8 or higher high school GPA and scoring 700 or higher on standardized entrance exams (SAT/ACT). From 2008 to 2017, the first indicator went up from 33 percent to 48 percent, while the second went up from 54 percent to 71 percent. Test scores for 2017 are not directly comparable to prior years, but the share scoring 700 or higher went up from 14 percent in 2008 to 24 percent in 2016.

1 A–G courses refer to those high school courses that UC has reviewed and approved as college preparatory. The minimum number of required A-G courses is 15.

2 Weighted, capped GPA means that students may receive a maximum of eight semesters of honors credit. More information is available at admission.universityofcalifornia.edu/freshman/california-residents/admissions-index/index.html.

3 Test scores are the highest of either SAT or ACT scores. ACT scores are converted to the 800 SAT scale. From 2008 to 2016, SAT scores are the average of SAT math and critical reading scores. The SAT was redesigned for 2017 and scores reflect the average of the math scores and the evidence-based reading and writing score; these scores are not directly comparable to prior years.


Like freshmen, UC transfer students in fall 2017 were better prepared academically than their counterparts a decade ago, as measured by their grades.

1.3.2 College grade point average (GPA)1 of entering transfer students, as share of class, Fall 2008 to 2017

College GPA of entering transfer students

Source: UC Data Warehouse and UC Corporate Student System

The academic qualifications of transfer students entering UC have improved over time, as reflected by an increase in the share of students having a 3.6 or higher college GPA from 34 percent in fall 2008 to 42 percent in fall 2017.

The transfer GPA is based on grades for college-level academic courses from the college(s) where students were previously enrolled. *Merced opened in 2005.


UC has a substantially lower proportion of out-of-state undergraduates than other AAU universities. In fall 2016, only 16.5 percent of UC’s enrollees were out-of-state or international, compared with 28.7 percent for other AAU publics.

1.4.1 Residency of undergraduate students, Universitywide and comparison institutions, Fall 2016

Residency of undergraduate students, Universitywide and comparison institutions

Source: UC Data Warehouse (UC numbers) and Common Data Set (comparator numbers)
* UC’s public four comparison institutions. **AAU public average excludes UC.

UC’s priority is to enroll California residents. Campuses enroll nonresident students based on available physical and instructional capacity and the campus’s ability to attract qualified nonresident students.

Nonresidents provide geographic and cultural diversity to the student body. They also pay the full cost of their education. In 2016–17, tuition and fees at UC campuses for a nonresident undergraduate, including health insurance, ranged from $41,700 to $43,900, compared to $15,000 to $17,200 for California resident students.

Nonresident applicants must meet higher criteria to be considered for admission. The minimum high school GPA for nonresident freshmen is 3.4, compared to 3.0 for California freshmen. The minimum college GPA for nonresident transfer students is 2.8, compared to 2.4 for California residents.


UC campuses attract students from their local regions and the major urban areas of California, with an overall local attendance rate of 34 percent.

1.4.2 Percentage of new CA resident freshman enrollees whose home is within a 50-mile radius of their campus, UC campuses, Fall 2017

Percentage of new CA resident freshmen enrollees living within a 50-mile radius of their campus


Source: UC Information Center Data Warehouse. California residents are defined here as those with permanent addresses in California.


Local enrollment rates for transfers are even higher than for freshmen, with 46 percent enrolling at a UC campus within 50 miles of their home.

1.4.3 Percentage of new CA resident transfer enrollees whose home is within a 50-mile radius of their campus, UC campuses, Fall 2017

Percent of new CA resident transfer enrollees living within a 50-mile radius of their campus


Source: UC Information Center Data Warehouse. California residents are defined here as those with permanent addresses in California.


The proportion of new undergraduate students paying nonresident tuition went down in 2016-17.

1.4.4      Percentage of undergraduate enrollees paying nonresident tuition1, Universitywide, 2007–08 to 2016–17

Percentage of full-time-equivalent undergraduate enrollees paying nonresident tuition


Source: UC Data Warehouse

Systemwide, the share of all undergraduates paying nonresident tuition rose from 5 percent to 16 percent from 2009–10 to 2016–17. From 2009–10 to 2015-16, the share of new undergraduates paying nonresident tuition went up from 7 percent to 19 percent before dropping to 17 percent in 2016-17 as enrollment of new California residents increased. The proportion of nonresident students at individual campuses varies depending on a campus’ capacity as well as its ability to attract nonresident students.

Systemwide tuition and fees for nonresident undergraduates is $40,644 in 2017-18 compared to $12,630 for California residents. UC campuses used to be able to provide need-based grants as a potential source to support low-income nonresident undergraduate students, but the 2015 Budget Act required these funds be used to support the enrollment of California resident undergraduates. Beginning in 2016-17, the University began to phase out funding for need-based grants for nonresident students. Nonresident tuition will increase by 3.5 percent in 2018-19 but in taking that action, the Regents included a provision that the University will advocate to the state that it once again be allowed to offer financial aid to needy nonresident students.

1 This chart uses year average headcount enrollment, the average headcount across all terms in the academic year (three quarters or two semesters). Not all nonresident students pay nonresident tuition. Some have statutory exemptions, such as AB540 students, children of UC employees and others designated by the state. AB540 students are considered California residents for tuition purposes as established by Assembly Bill 540, passed in 2001.