Accountability Report 2018

chapter 3: undergraduate student success

History
From the first twelve diplomas granted by the University of California in 1873 to UC Riverside being recognized as a national leader in African American graduation rates in 2017, the University has a storied history of undergraduate student success in academics, athletics, the arts and the sciences.

Those first twelve, known as the “12 Apostles,” were a testament to the breadth of impact the University would later have; among them came a U.S. congressman and California governor, a mayor, a bank president, two UC regents, a businessman, an attorney, an engineer, a math professor, a clergyman and a rancher.

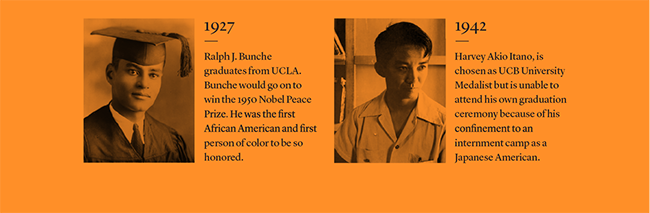
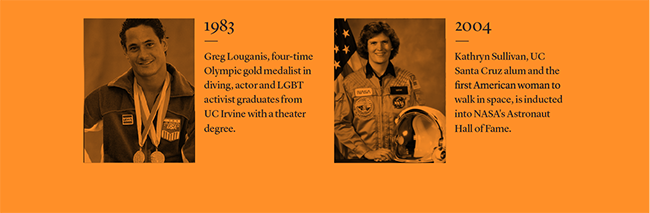
Across the history of UC, there have been many notable undergraduates who have enjoyed great success since earning their UC degrees. Choosing just one from each campus to highlight here is a difficult task. Julia Morgan (UCB 1894), was the first woman architect licensed in California; Ralph Bunche (UCLA 1927), was the first person of color to win the Nobel Peace Prize; Robert Ballard (UCSB 1965), is an oceanographer who discovered the RMS Titanic; Kathryn Sullivan (UCSC 1973), was the first American woman to walk in space; Bruce Beutler (UCSD 1976), won a Nobel Prize in Physiology or Medicine in 2011; Greg Louganis (UCI 1983), is an Olympic gold medal diver and LGBT activist; Tani Cantil-Sakauye (UCD 1984), is the Chief Justice of California; Steve Breen (UCR 1992), is an editorial cartoonist and two-time Pulitzer Prize winner; Daniel Lobato (UCM 2013), is a pilot and first lieutenant in the U.S. Air Force, and benefactor behind the Lobato Endowed Scholarship Fund at UC Merced. Of course, there are many more stories of undergraduates with extraordinary success, but individuals alone do not tell the story of UC student success.
Goals
The University of California seeks to enable all entrants to complete their undergraduate degrees in a timely fashion and to ensure that their education prepares them to be the next generation of leaders for California, the nation and the world. President Napolitano seeks to increase the four-year freshman graduation rate from 66 percent (2013 cohort) to 70 percent by 2030. This would enable an additional 32,000 students to graduate over the next couple of decades.
Improving graduation rates
UC campuses have instituted a wide range of programs to promote the academic success of undergraduates, especially low-income and underrepresented students. These include academic preparation programs, individual student counseling and mentorship opportunities.

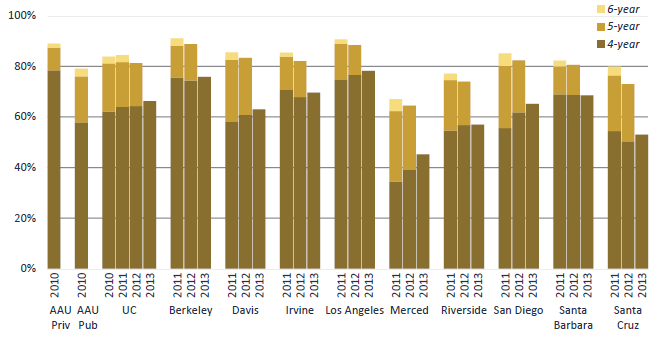
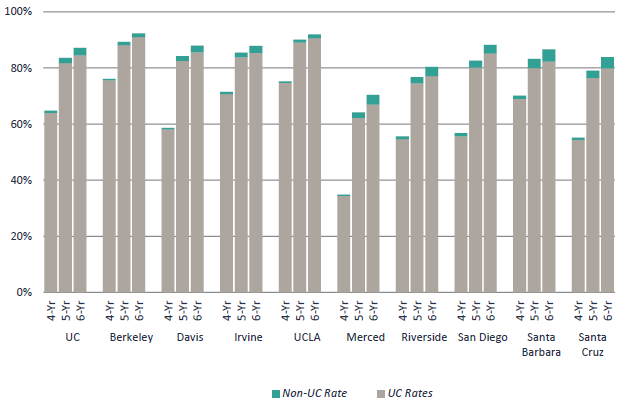
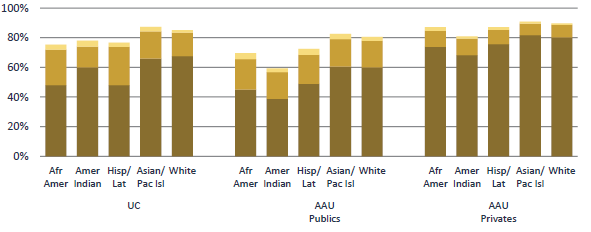
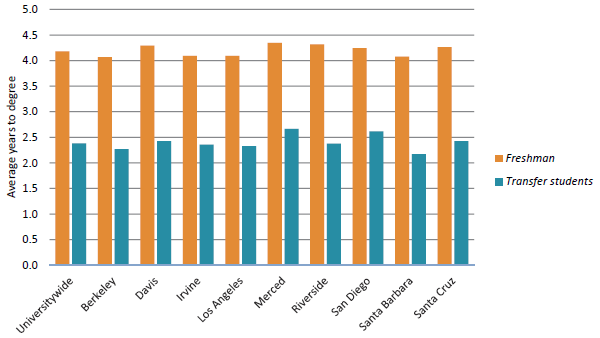
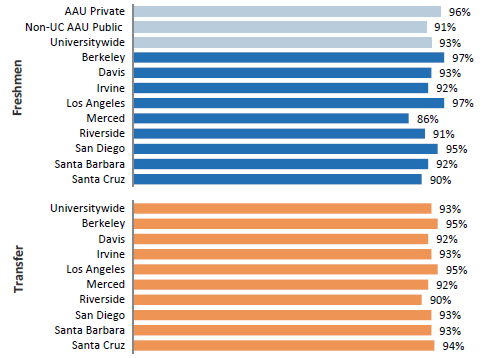
By traditional graduation rate measures, UC’s undergraduates are highly successful. UC’s four-year graduation rates for freshmen have risen significantly over the past 16 years — from 46 percent for the 1997 entering cohort to 66 percent for the 2013 cohort. The most recent six-year graduation rate, for the 2011 entering cohort, is 84 percent (3.1.1), which increases to 87 percent when including students who transfer to non-UC institutions (3.1.2) and still graduate within six years. In addition, time to degree has steadily improved, with freshman entrants now taking 4.2 years (3.1.8), on average, to graduate.

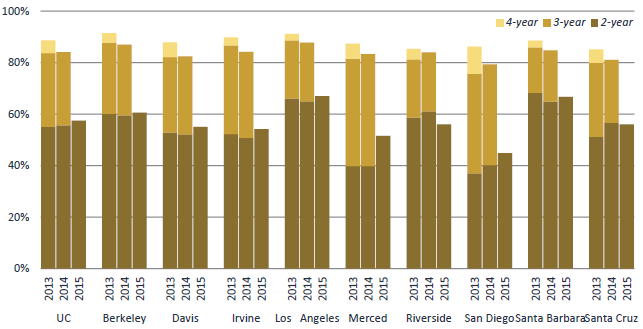
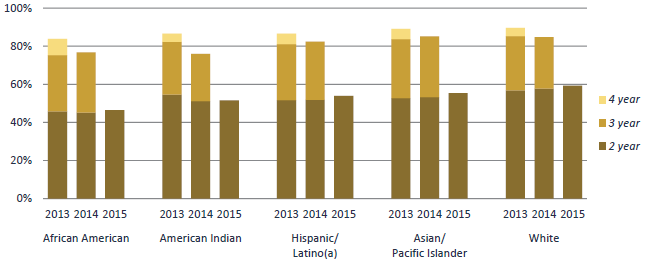
Transfer entrants have made similar gains, with two-year graduation rates increasing from 37 percent for the 1997 entering cohort to 57 percent for the 2015 cohort (3.1.3). The most recent four-year graduation rate for transfers (2013 entering cohort) is 89 percent and the average time to degree is 2.4 years (3.1.8).
Factors that affect graduation rates
As UC seeks to improve graduation rates, it is important to obtain a better understanding of factors that influence these rates. To assess this, logistic regression analyses were conducted to examine the strength of the relationship between key factors (e.g., Pell status) and graduation rates.

The models pooled freshmen from the 2008, 2009 and 2010 entering cohorts. Multiple cohorts were analyzed to limit the possibility that results could be attributed to any one cohort. The models included variables used in higher education research, which have shown to affect graduation rates. Specifically, campus of enrollment, broad disciplinary area (i.e., Social Sciences, Arts & Humanities, STEM (science, technology, engineering and mathematics) and Other), pre-UC academic characteristics (e.g., SAT/ACT scores and high school GPA), UC academic performance (e.g., first-year GPA) along with demographic characteristics (e.g., first generation status, URG status and Pell status) were included.

Because factors such as high school GPA, first-year college GPA and SAT scores are measured on different scales and have different distributions, these variables were standardized in the analysis. The standardized units (one unit equals one standard deviation) represent a student’s performance relative to the population, allowing the comparison of the impact of a hypothetical change in one variable compared to the same relative change in another. After controlling for entry year, campus (e.g., UC Berkeley), and broad disciplinary area, evidence suggested that a one-unit increase in first-year UC GPA was associated with a 48 percent increase in the odds that a student would graduate within four years. A one-unit increase in high school GPA was associated with a 15 percent increase in the odds that a student would graduate within four years.

SAT/ACT test scores have less of a relationship with four-year graduation rates compared to high school GPA and first-year UC GPA. Specifically, a one-unit increase in SAT/ACT scores is associated with an eight percent increase in the odds that a student would graduate within four years.

While not presented in this chapter, results for six-year graduation rates were very similar to four-year graduation rates. Early academic success, specifically as it relates to first-year UC GPA, is a key factor for focus when seeking to improve graduation rates.

Academic preparation is only one factor that influences student success. Research has shown that engagement is also an important component. Engagement is often used to describe behaviors of students who are active learners, such as interacting with faculty members and contributing to class discussions. Research has also demonstrated that student engagement is correlated with the number of credits attempted and the number of credits earned, which are key factors for on-time degree completion.

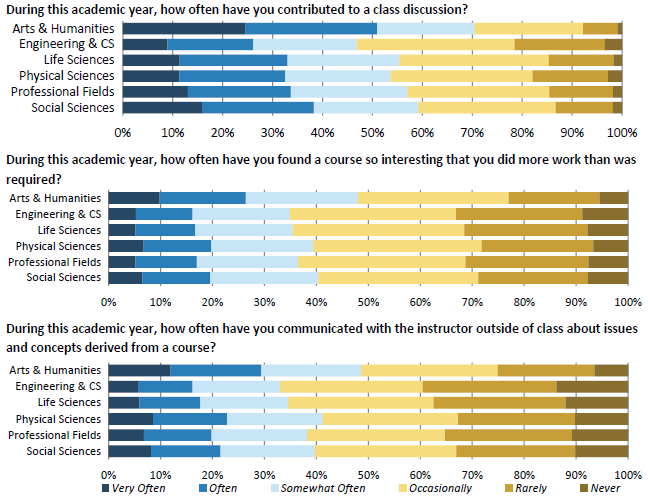
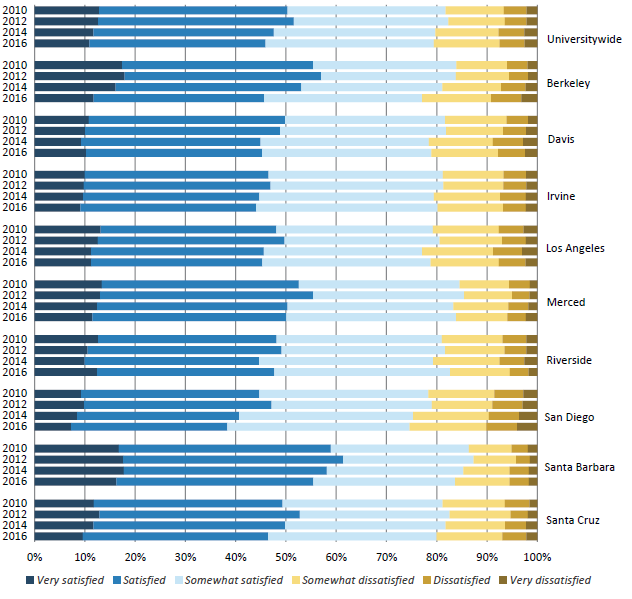
Evidence from the UC Undergraduate Student Experience Survey (UCUES), sent out biannually to all UC undergraduates, suggests that UC students overall are engaged with their education, although there is room for improvement. In 2016, more than half of students reported that they contributed to class discussions at least somewhat often, and more than a third went beyond required coursework somewhat often in a course they found interesting (3.3.2). About one-third of students at least somewhat often communicated with the instructor outside of class about issues and concepts derived from a course.

To determine if student engagement is related to academic performance, data from UCUES were merged with data on student outcomes. While the previous analyses focused on four-year graduation rates, evidence did not suggest that student engagement plays a significant factor in four-year graduation rates. This analysis examined the relationship between student engagement and first-year GPA, a key predictor of four-year graduation rates. Evidence suggested that contributing to a class discussion and doing more work than required in a class that one finds interesting were related to an increase in first-year UC GPA. This effect was found after controlling for entry cohort, survey administration year, campus of enrollment, student discipline, high school GPA, SAT/ACT scores, Pell status, first generation status and URG status. While not a major factor, student engagement was also shown to be related to student success, specifically as it relates to first-year GPA.

This chapter will present data on student success by demographic predictors. While the analyses above found that demographics are generally not strong predictors of success after controlling for academic predictors, it is important to note that the analyses above did not test how different factors interact. For instance, an underrepresented student may be more likely to attend a poorly performing high school. Being both low-income and first-generation will often affect a student more than just having one of these characteristics, even though they are closely correlated.

While the previous analysis mostly focused on pre-UC factors (e.g., high school GPA and SAT/ACT scores), the student experience at UC also plays a significant role in student success. Factors such as advising, financial support, and the availability of classes also contribute to student success. Recognizing the importance of these factors and early student succes for on-time graduation, UC campuses are making efforts to improve first-year student success. Many campuses offer first-year seminars to assist students with the transition from high school to UC. Seminars help students build a sense of community, understand the expectations of UC, engage with faculty and learn how to leverage campus resources. Campuses are also making advising mandatory for first-year students. Early advising helps students choose the right classes and obtain support. To help students understand the role of research in education, many UC campuses offer first-year students the opportunity to work on a research project with a faculty member. Systemwide, UC recently launched the First-Generation Faculty Initiative which connects first generation students to both faculty and staff mentors.

Undergraduate outcomes
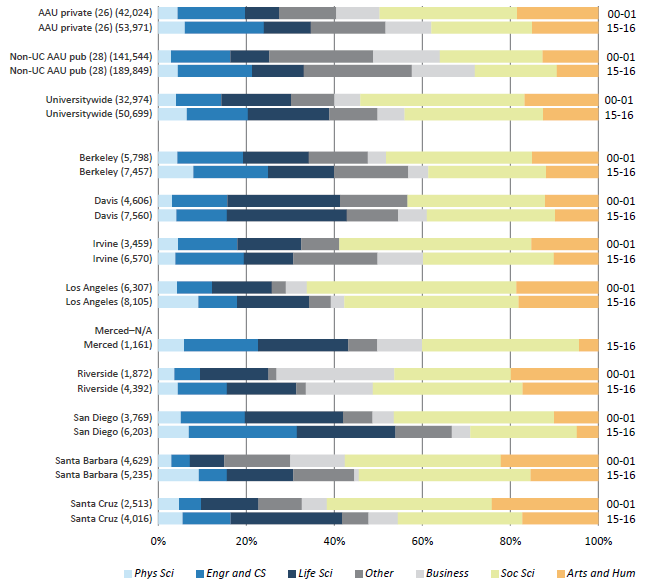
The number of undergraduate degrees awarded by UC over the past 15 years has grown by 55 percent, from about 32,700 degrees in 1999–2000 to about 50,700 degrees in 2015–16 (3.3.1). Increases in the size of the entering freshman class and improving graduation rates have contributed to this growth. More than one-third of the undergraduate degrees awarded by UC in 2015–16 were in STEM disciplines.

Four years after graduation, more than one-quarter of bachelor’s degree recipients have enrolled in graduate or professional programs.

UC alumni working in California surpass the typical earnings of other California bachelor’s degree recipients (aged 25 and over), by six years after graduation. The earnings trajectory of UC alumni increases rapidly — doubling what they were earning at two years after graduation by ten years after graduation, on average. Economic success is prevalent for all socioeconomic groups, including students whose families qualified for federal Pell Grants. Within seven years of graduation, the majority of Pell Grant recipients earn an average income higher than their parents’ combined incomes during the time those students attended UC (approximately $50,000).

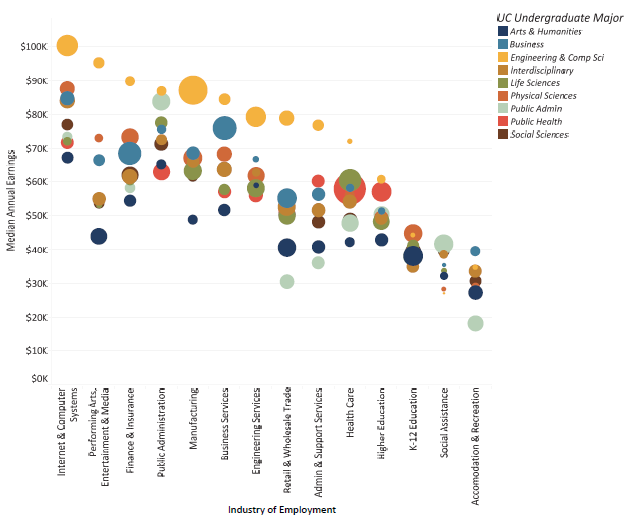
UC alumni are not only earning competitive salaries, more than half are working in key industries such as health care, K-12 education, finance & insurance, public administration, social assistance, higher education, engineering, and internet and computer systems. Many alumni work in industries that closely align with the major they chose. By ten years after graduation, 56 percent of engineering & computer science majors work in engineering, manufacturing, or internet and computer systems; 30 percent of life science majors work in health care and 34 percent of arts & humanities majors are working in K-12, higher education, or performing arts and entertainment.
Looking forward
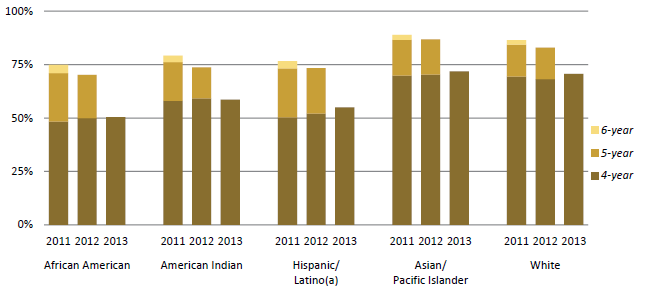
Building on UC’s record of success, there are continued systemwide and campus efforts to improve undergraduate outcomes. Through the application of state funds, UC hopes to make additional progress in closing equity gaps in graduation rates between racial/ethnic groups.
For more information


Over sixty percent of UC freshman graduate within four years, a higher rate than comparable AAU public universities. 

3.1.1 Freshman graduation rates for all students, UC and comparison institutions, Cohorts entering fall 2011, 2012 and 2013; fall 2010 cohort for AAU comparison

Freshman graduation rates for all students and Pell recipients

Source: UC Data Warehouse and IPEDS1

UC’s six-year graduation rate is higher than that of comparable AAU public institutions. UC’s four-year graduation rates for freshmen have risen significantly over the past 15 years, from 46 percent for the 1997 entering cohort to 66 percent for the 2013 cohort. This improvement is due to factors including campus programs supporting four-year completion, improvements in academic preparation of incoming students and the current cost of a UC education, all of which motivate students to complete their degrees.

UC’s freshman six-year graduation rate is 84 percent, which is almost a five percent increase over the past twenty years.

More information on trends in UC freshman graduation rates can be found at: universityofcalifornia.edu/infocenter/ug-outcomes.

1 Comparison IPEDS data are available for more limited years. The AAU comparison institutions are in the data glossary. AAU comparison is for the 2010 cohort, the most recent data available. Graduation rates are weighted by total cohort size. Institutions with missing data are excluded for that year. Freshmen are those students who entered UC directly from high school and who have not matriculated at another postsecondary institution prior to enrollment. UC statistics give credit to the originating campus for inter-UC campus transfers. 


The six-year graduation rate of UC freshmen is close to 90 percent when students who finished their degree at a non-UC institution are included. 

3.1.2 Freshman graduation rates, including those who graduated from a non-UC institution, Universitywide and UC campuses, Cohort entering fall 2011

 Freshman graduation rates, including those who graduated from a non-UC institution, Universitywide and UC campuses

Source: UC Data Warehouse and the National Student Clearinghouse1

The extended graduation rate of students who begin their studies as freshmen at UC includes those who transferred to a non-UC institution and completed their bachelor’s degree within four, five or six years.

By this measure, UC’s overall six-year graduation rate is about 87 percent. The effect of the extended graduation rate varies by UC campus, with Berkeley having fewer students who earn a degree outside of the UC system, while the six-year rates at Merced, Riverside, Santa Barbara and Santa Cruz improve by as much as 4 percentage points when students who complete their degree at a non-UC school are counted.

1 Intercampus transfers within UC are counted as graduates of their originating UC campus. In this graph, non-UC rates only include those who transferred to non-UC institutions and graduated with a bachelor’s degree.


Nearly 60 percent of transfer students graduated within two years.

3.1.3 Transfer graduation rates, Cohorts entering fall 2012, 2013 and 2014 

 Transfer graduation rates

Source: UC Corporate Student System1

The two-year graduation rate for transfer students has been relatively consistent over the past three cohorts. The two-year graduation rate for transfers is currently at 57 percent, the highest since 1995. The four-year rate is 89 percent, compared to 84 percent for the six-year freshman graduation rate. More information on trends in UC transfer graduation rates can be found at: universityofcalifornia.edu/infocenter/ug-outcomes.

1 Comparison data on graduation rates for transfer students are not available. UC statistics give credit to the originating campus for inter-UC campus transfers. Merced opened in 2005.


Underrepresented group (URG) students at UC graduate at higher rates when compared to URG students at other AAU public institutions.

3.1.4 Freshman graduation rates by race/ethnicity, Cohorts entering fall 2009, 2010, 2011 and 2012

Freshman graduation rates by race/ethnicity

More information on trends in UC freshman graduation rates by campuses and demographic detail can be found at: universityofcalifornia.edu/infocenter/ug-outcomes

 UC and comparison institutions, cohort entering fall 2010

Graduation rates for UC and comparison institutions

Source: UC Information Center Data Warehouse and IPEDS.


Regardless of race/ethnicity, transfer students graduate at a high rate and the rate for two-year graduates is rising.

3.1.5 Transfer graduation rates by race/ethnicity, Cohorts entering fall 2013, 2014 and 2015

Transfer graduation rates by race/ethnicity

Source: UC Information Center Data Warehouse.

More information on trends in UC transfer graduation rates by campus and demographic detail can be found at: universityofcalifornia.edu/infocenter/ug-outcomes.


Over 80 percent of Pell students graduate within six years: Freshmen. 

3.1.6 Freshman graduation rates by Pell Grant receipt status, Cohorts entering fall 2011, 2012 and 2013

 Freshman graduation rates by Pell Grant receipt status

Source: UC Data Warehouse. Pell Grant recipients are those who received a Pell Grant at any time during their time at UC. 

Pell Grant recipients graduate at rates comparable to non-Pell recipients: 82 percent and 87 percent, respectively. Although there is a 13 percentage point gap at the four-year mark between Pell recipients (57 percent) and non-Pell recipients (70 percent), this gap is reduced to five percentage points at the six-year mark. 


3.1.7 Transfer graduation rates by Pell Grant receipt status, Cohorts entering fall 2013, 2014 and 2015

Transfer graduation rates by Pell Grant receipt status

Source: UC Data Warehouse. Pell Grant recipients are those who received a Pell Grant at any time during their time at UC.

For the 2013 cohort, Pell and non-Pell Grant recipients graduated at comparable rates of 88 percent and 90 percent, respectively. The two-year graduation rate gap between Pell and Non-Pell Grant recipient transfer students was cut in half between the 2013 and 2015 cohorts, from 14 percentage points to 7 percentage points.

More information on trends in graduation rates can be found at universityofcalifornia.edu/infocenter/ug-outcomes.


As graduation rates rise, undergraduate students at UC are also graduating more quickly.

3.1.8 Average time to degree, Fall 2009 entering freshmen and transfer cohorts

 Average time to degree

Source: UC Corporate Student System1

The average time to earn a bachelor’s degree at UC has decreased fairly steadily since 1994. Students entering as freshmen take an average of 4.2 years, about 7 percent less time than in 1994.

For students entering as transfers, the average time to degree is 2.4 years, about 12 percent less than in 1994. More information on trends in UC time to degree can be found at universityofcalifornia.edu/infocenter/ug-outcomes.

1 Average time to graduation includes only students who graduated from UC within seven years.


Freshman retention rates are high, but there is room for improvement. Transfer retention rates are also high and very close to freshman retention rates.

3.2.1 First-year retention rates, Cohorts entering fall 2016

Freshman first-year retention rates

Source: Freshmen data from IPEDS1; transfer data from UC Data Warehouse. Comparison data on retention rates are not available for transfer students.

Improving first-year retention is key to raising graduation rates. The current universitywide retention rate is 93 percent. This is higher than non-UC AAU institutions (91 percent), but lower than AAU private institutions (96 percent).

Students who leave can be divided into two groups: those who leave UC in good academic standing (i.e., GPA ≥ 2.0) or transfer to another UC campus, and those who leave in poor academic standing (i.e., < 2.0).

For students leaving in good academic standing, some campuses are expanding honors programs or providing opportunities for undergraduate research as early as the freshman year.

For those leaving in poor academic standing, some UC campuses are using Summer Bridge or early orientation programs so that students have a jump-start on a smooth transition to campus life. Campuses are also looking into housing and residential programs and cohort programs to integrate undergraduates into college.

Like entering freshmen, transfer students benefit from a smooth transition to campus in their first year. Several UC campuses have summer programs to support transfer students.

More information on trends in UC retention rates can be found at:
universityofcalifornia.edu/infocenter/ug-outcomes

1 Freshmen are first-time, full-time, degree-seeking students from the fall who enroll again in the next fall term. The most recent available comparison data from IPEDS is for 2015.


Social science, life sciences, and arts and humanities are the largest segments of bachelor’s degree recipients.

 3.3.1 Undergraduate degrees awarded by discipline, UC and comparison institutions, 2000–01 and 2015–16

 Undergraduate degrees awarded by discipline, UC and comparison institutions

Source: IPEDS

About 39 percent of all undergraduate degrees awarded by UC in 2015–16 were in science, technology, engineering and mathematics (STEM) fields. This is higher than the proportion at AAU public and private comparison institutions (33 and 35 percent, respectively). 


The proportion of students engaged in academic activities varied by discipline. Students in Arts & Humanities reported greater engagement in academic activities compared to students in other disciplines.

3.3.2 Student responses to questions about areas of engagement, by discipline, Spring 2016

Student responses to questions about areas of engagement

Source: UCUES

About 70 percent of students in Arts & Humanities reported that they at least somewhat often contributed to class discussion, compared to 47 percent of students in Engineering & Computer Sciences and between 50 to 60 percent of students in other majors. About half of the students in Arts & Humanities reported that they at least somewhat often went beyond required coursework in a class they found interesting, compared to between 30 to 40 percent of students in other majors. About half of the students in Arts & Humanities reported that they at least “somewhat often” communicated with the instructor outside of class about issues and concepts derived from a course, compared to 41 percent of students in Physical Sciences, and between 30 to 40 percent of students in other majors.


About 80 percent of undergraduate students reported satisfaction in their overall academic experience.

3.3.3 Student satisfaction with overall academic experience, Bachelor's degree recipients who entered as freshmen, Universitywide and UC campuses, Spring 2010 to 2016

Student satisfaction with overall academic experience

Source: UCUES. Note that unlike previous Accountability Reports, which were limited to seniors, this data includes all UCUES respondents.

For the UC system overall and for most campuses, the percent of students who were satisfied (somewhat through very satisfied) has remained as high as about 80 percent. However, students’ satisfaction dropped slightly between 2012 and 2016. Specifically, fewer students indicated that they were satisfied or very satisfied with their overall academic experience. 


Across disciplines, undergraduate degree recipients tend to double their earnings between two and ten years after graduation.

3.3.4 Inflation-adjusted average alumni wages by selected majors, two, five and ten years after graduation, UC Universitywide, 2000 to 2014 graduating cohorts, combined

After two years After five years After ten years
Mean Median Mean Median Mean Median
Arts & Humanities Arts $31,650 $28,240 $45,303 $40,369 $63,130 $53,108
English/Literature $35,650 $33,221 $51,265 $45,307 $71,193 $59,663
Foreign Language $35,462 $32,114 $50,643 $44,726 $73,422 $60,389
History $36,344 $32,813 $55,440 $46,460 $77,643 $64,032
Other Humanities $34,766 $32,023 $47,153 $43,120 $59,112 $54,970
Philosophy $36,163 $31,887 $54,772 $46,555 $83,589 $67,312
Professional Nursing $83,772 $84,635 $101,935 $101,714 $125,097 $120,927
Business $54,446 $49,834 $73,516 $65,897 $107,207 $89,375
         Agriculture $52,588 $50,892 $71,251 $66,085 $100,567 $87,159
Architecture $46,360 $44,780 $61,290 $57,129 $76,250 $70,906
STEM Computer Science $79,790 $73,062 $100,764 $89,195 $134,664 $113,076
Engineering $69,537 $66,477 $90,822 $83,710 $125,612 $108,625
Physics $52,213 $49,085 $71,948 $67,911 $104,890 $90,460
Biology $38,632 $37,068 $61,768 $54,604 $102,948 $83,636
Chemistry $44,015 $42,957 $60,443 $55,966 $100,838 $81,764
Communications $42,099 $40,095 $61,909 $55,220 $87,838 $75,008
Legal Studies $46,468 $42,857 $69,825 $60,457 $105,445 $86,483
Mathematics $53,949 $48,846 $72,636 $64,117 $94,872 $82,869
Social Sciences Economics $53,396 $49,085 $73,741 $65,112 $109,122 $88,445
Political Science $41,569 $38,300 $65,114 $55,607 $99,191 $82,699
Geography $41,715 $38,144 $61,026 $55,801 $87,254 $72,795
Psychology $36,222 $33,600 $54,391 $48,520 $77,876 $66,295
Anthropology $34,311 $30,491 $48,968 $43,437 $71,125 $59,649
Sociology $38,281 $35,945 $55,334 $49,679 $75,597 $65,298
All Majors $45,053 $40,488 $64,190 $56,362 $92,889 $77,453

Source: California Employment Development Department and UC Corporate Student System. Amounts are inflation-adjusted to 2016 dollars.

Alumni employment data provide evidence of UC’s contribution to the California economy and its role as an engine of economic mobility. UC enrolls a greater percentage of low-income students (from the bottom 20 percent of the income distribution) than other four-year institutions in California. Recent data made available through a partnership with the Equality for Opportunity Project show that more than one in three UC alumni who come from the bottom 20 percent of income rise to the top 20 percent of income as adults, based on the entering cohorts of 1999 to 2005. Moreover, comparisons using this national data show UC bachelor’s degree recipients working in California tend to earn about 20 percent more than UC graduates who work outside of California. More information on the Equality of Opportunity Project can be found at: ucop.edu/institutional-research-academic-planning/_files/CLIMB-a-mobility-analysis.pdf


Engineering and computer science majors tend to earn more than other UC undergraduate alumni, but how much UC alumni make also depends on the industry.

3.3.5 Median alumni wages by industry of work for selected majors, five years after graduation, Universitywide, 2000 to 2011 graduating cohorts, combined

 Industry of employment of UC bachelor’s graduates by years after graduation, Universitywide

Note: The size of bubble corresponds to percentage of alumni within majors employed in the industry. The largest bubble is 36% and the smallest is <1%.
Source: California Employment Development Department and UC Corporate Student System. Includes alumni employed in the state of California only. Amounts are inflation-adjusted to 2016 dollars.

UC graduates go on to work in a wide range of industries in California. A large share of Engineering and Computer Science majors work in the Internet & Computer Systems and Manufacturing industries with median salaries of about $100K and $87K, respectively. Business majors are likely to work in the business services, finance & insurance industries where median earnings reach $70K to $80K. Arts & Humanities graduates are most likely to work in K-12 education, where median salaries are much lower, at about $40K at five years after graduation.