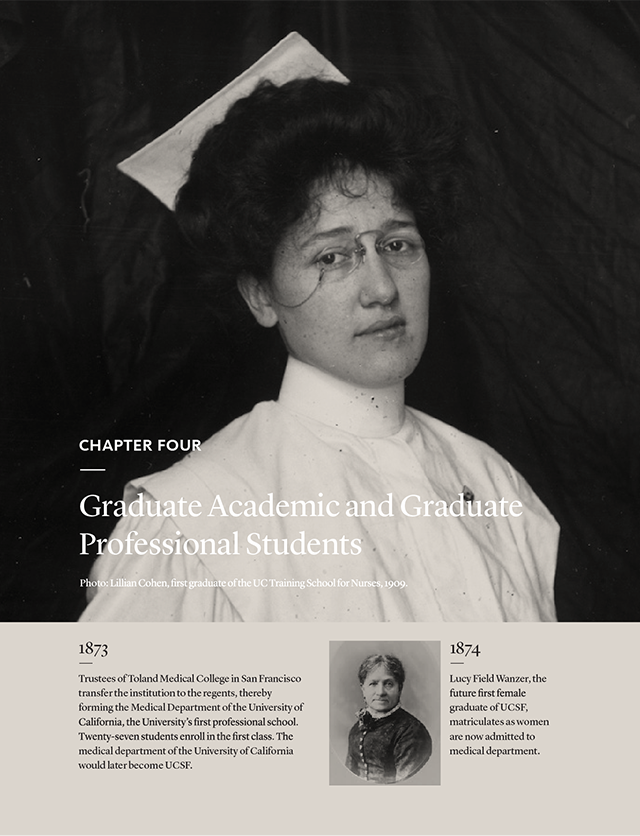
History
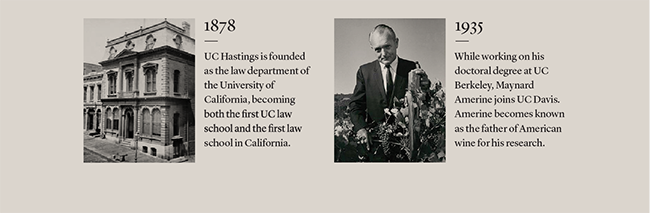
Within five years of the University of California opening its doors, the first professional school began enrolling graduate students; Toland Medical College joined the University in 1873 and would become the University of California, San Francisco. UC Hastings, California’s first law school, would follow soon after in 1878. In 1881, within the first twenty years of the University’s existence, UC established the first dental school west of the Mississippi.
With the charge by the California Legislature in 1880 to establish a program “providing for instruction and research in viticulture and enology,” UC was instrumental in creating California’s wine industry. In 1935, UC graduate student Maynard Amerine joined the faculty at UC Davis and later became known as the father of American wine for his research.
Over the decades, scores of graduate programs in all disciplines would be founded at all UC campuses, some of the newest being the School of Nursing at UC Irvine, Public Health at UC Merced, Science Communication at UC Santa Cruz and Geotechnical Engineering at UC San Diego.
Since 2015, the Grad Slam competition has invited UC graduate students to communicate their research. The winning presentations show the diversity and depth of research that is a hallmark of the University’s graduate programs: “A stormwater solution” (Joseph Charbonnet, UCB, 2018 winner); “Making mental health more engaging and accessible” (Leslie Rith-Najarian, UCLA, 2017 winner); “Renewable nanopower: the new age of earth abundant electronics” (Peter Byrley, UCR, 2016 winner); “Stem Cells: how to mend a broken heart” (Ashley Fong, UCI, 2015 winner).
Goals
California’s Master Plan for Higher Education gives the University of California the responsibility of enrolling and preparing graduate academic and graduate professional students to help meet the needs of California and the nation and to further the UC mission of teaching, research and public service. Thus, reviving adequate support for the University of California is important as its graduate education enterprise fuels California’s role as a national and international leader.
UC’s goals for graduate education are to offer outstanding degree programs, advance research, support undergraduate instruction and prepare students to join a professional workforce. UC produces the leaders of the future—the teachers, artists, thinkers, innovators, scientists, inventors, doctors, lawyers and nurses; it creates an environment of exploration and discovery that stimulates innovation and invention. UC’s internationally renowned graduate education enterprise serves to drive California’s economy, allowing it to grow, create jobs and offer its residents the standard of living for which the state is well known.
Types of graduate degrees
UC awards both graduate academic degrees and graduate professional degrees.
Graduate academic degrees — These include academic doctoral and academic master’s degrees in education, physical sciences, social sciences, arts, humanities and engineering/computer science. Other doctoral degrees are offered in various disciplines (such as EdD in education, DrPH in public health, etc.). The largest proportion of graduate academic degrees awarded at UC is in the STEM fields—science, technology, engineering and mathematics. In 2015–16, more than two-thirds of UC graduate academic degrees were awarded in STEM fields.
Graduate professional degrees — UC’s professional degrees include professional master’s and professional practice degrees in fields such as law, medicine, nursing, business, education, architecture, public policy and the arts. The graduate professional category includes professional master’s degrees (e.g., M.B.A., M.Ed.) and professional practice degrees (e.g., J.D., M.D.). In the field of medicine, UC offers the nation’s largest instructional program in health care and health sciences.
The University maintains multiple funding models for its graduate professional programs. Many state-supported programs (i.e., M.B.A., law, medicine, etc.) assess professional degree supplemental tuition (PDST), which allows the professional schools to ensure their excellence, accessibility, inclusiveness and affordability. Programs assessing PDST commit substantial resources to grants and scholarships, reducing the amount that students pay. Since PDST began in 1994, both the number of professional degree programs that charge PDST and the amount charged have increased.
Other UC graduate professional programs, primarily master’s programs, follow a self-supporting funding model. The largest are business and management programs. These programs receive no state support and are funded entirely by revenues generated by the program and other non-state revenues. Self-supporting programs allow the University to serve additional students beyond those supported through state resources. They also fulfill higher education and workforce needs. Many self-supporting programs serve nontraditional populations such as full-time employees, mid-career professionals, international students with specialized goals and students whose education is supported by their employers. Many programs are offered through an alternative mode of delivery, such as online or hybrid instruction, alternative scheduling or at off-campus locations.
Graduate enrollment share
UC’s graduate education enterprise enrolls over 56,000 students, with doctoral students representing the largest number (27,000), then professional (22,000) and then master’s (7,000). Despite its size, UC’s graduate education enterprise represents a smaller share of its total enrollment than that of its peers. Graduate students comprise 21 percent of total student enrollment at UC, which is lower than the proportion of graduate enrollment among other Association of American Universities public (27 percent) and private (55 percent) peer institutions. In addition, while the graduate share of UC’s total enrollment has remained relatively flat over the last decade at 21 percent, the doctoral enrollment percentage has declined, while the graduate professional percentage has risen steadily.
Supporting diverse career paths and making research accessible
To promote and highlight the work of master’s and doctoral students across UC campuses, UC holds an annual research communication competition called UC Grad Slam. The event challenges its ten participants—the winners of each campus’s own Grad Slam — to distill years of academic research into a three-minute presentation free of technical lingo. The Grad Slam encourages students to communicate their research in a clear and compelling way to non-specialists — a skill that employers need and value. Campuses provide workshops and resources for students to develop this skillset. The contest also demonstrates to the public that UC research benefits their lives in both ordinary and quite extraordinary ways. The winner of Grad Slam 2018 is UCB student Joseph Charbonnet, whose research describes a simple method for using sand to make stormwater runoff safe for drinking.
Career Pathways Survey
In 2017, UC launched the PhD Career Pathways Survey, which is a partnership between the University of California and the Council of Graduate Schools. The survey will be conducted in two phases through 2019, and its purpose is to better understand the career preparation and pathways of PhD students and alumni. While the Council of Graduate Schools is specifically focused on humanities and STEM PhDs, the University of California is collecting data from doctoral students and alumni in all disciplines.
Initial results showed high levels of employment and satisfaction with UC PhD programs. Ninety-six percent of respondents were working in a job for pay, 76 percent indicated they were working in a field closely related to their degree and nearly 60 percent were employed at a higher education institution. Seventy-four percent of respondents stated that their PhD training prepared them well for their current job, 78 percent stated that they would pursue a PhD in the same field and 80 percent indicated that they would choose the same institution for their PhD education.
Equity and inclusion: Expanding academic pathways
A more diverse community of scholars at all levels has been a longstanding goal for UC, but progress at the doctoral, postdoctoral and faculty levels has been slow. UC’s difficulties reflect challenges both in enrolling individuals from underrepresented groups in doctoral programs and in attracting and hiring them as postdoctoral scholars and faculty. Systemwide initiatives aimed at increasing the diversity of UC’s academic community include:
UC LEADS – The University of California Leadership Excellence through Advanced DegreeS program prepares promising UC undergraduate students for advanced education in science, technology, engineering and mathematics (STEM) fields. The program prepares underrepresented UC undergraduate students for doctoral education opportunities at a UC campus. From its inception in 2000–01 through 2014–15, 785 scholars participated in UC LEADS. Given the importance of gender and ethnic equity within STEM-based doctoral programs, it is notable that half of these scholars are female and half are from underrepresented groups. Of the first 12 cohorts, 98 percent earned undergraduate degrees and 70 percent are either currently enrolled in graduate school or have earned graduate degrees. Twelve UC LEADS alumni are tenure-track faculty, including four at UC.
UC-HBCU Initiative – The University of California-Historically Black Colleges and Universities (UC-HBCU) Initiative was established to increase the number of African Americans completing PhDs at UC by investing in relationships between UC faculty and HBCUs. The program has raised UC’s profile within the HBCU community and facilitated faculty research collaborations in addition to enrolling and retaining students. More information about the UC-HBCU Initiative is presented in Chapter 7.
University of California President’s Postdoctoral Fellowship Program (PPFP) – The PPFP program was established to encourage outstanding women and underrepresented PhD recipients to pursue academic careers at UC. The program offers postdoctoral research fellowships, professional development and faculty mentoring to outstanding scholars in all fields whose research, teaching and service will contribute to diversity and equal opportunity at UC. More information about the PPFP program is presented in Chapters 5 and 7.
Looking ahead
The University continues to develop programs to enhance the graduate student experience. UC’s overall excellence rests on the strength and scope of its graduate programs. Unlike undergraduate enrollment planning, based on California’s Master Plan, graduate enrollment planning includes the assessment of state and national needs, faculty expertise, program quality (which includes international competitiveness) and financial support. Over the last 50 years, as the University accommodated California’s burgeoning high school graduates, undergraduate enrollment growth has far outpaced graduate enrollment growth. As a result, the proportion of graduate students to undergraduates on the general campuses has decreased from about 30 percent in the 1960s to 21 percent today. Given the critical contributions of graduate students to the University’s teaching and research mission and their role as innovation drivers, this change is notable and it places UC well below its peer institutions.
For more information
Universitywide graduate academic applications have increased substantially over the last eight years, while admits and new enrollments have remained relatively flat.
4.1.1 Graduate academic applications, admits and new enrollees by degree program and citizenship, Universitywide, Fall 2010 to fall 2017
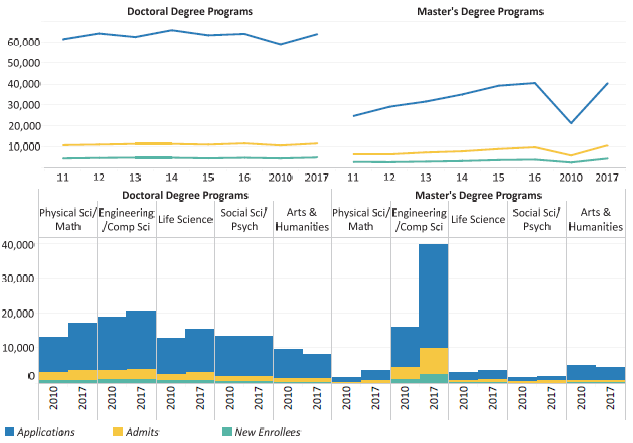
Source: UC Corporate Student System. A small number of professional doctoral programs are also included in these data. Universitywide applications and admits are duplicated in this report since students often apply to more than one campus.
The demand for UC academic masters and doctoral programs has increased steadily over the past eight years. Applications for admission grew from 80,000 in 2010 to 104,000 in 2017. Nearly all of this increased demand has come from prospective international students, with international applications growing from 34,400 to 60,800 – a rate of 10 percent per year. Engineering and computer science programs have significantly higher demand from international students than do other disciplines.
Recent survey data compiled by the Council of Graduate Schools show a similar nationwide trend of growth in applications from international students, with the similar pattern of engineering as the most popular field for international applicants.
1 Despite more robust demand, new admits and enrollments to UC academic master’s and doctoral programs have remained relatively flat since 2010, with admits increasing from 16,500 in 2010 to 21,800 in 2017 and new enrollments increasing from 7,200 to 9,300. Though applications are now predominantly (58 percent) from international students, both admits and new enrollments of domestic students exceed those of international students.
1Council of Graduate Schools International Admissions Survey
Over the past eight years, the number and share of graduate academic admissions have modestly increased for underrepresented groups while growing more significantly for international students.
4.1.2 Graduate academic applications, admits and new enrollees by race/ethnicity and citizenship, Universitywide, Fall 2010 and 2017
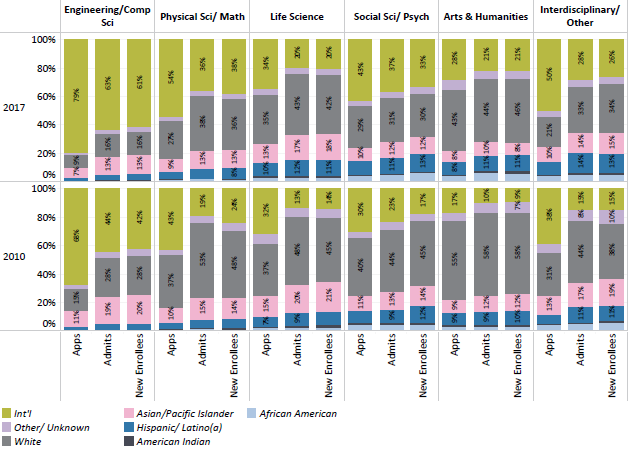
Source: UC Data Warehouse
Graduate academic applications, admits and new enrollees by race/ethnicity and citizenship, UniverInternational students represent the majority of applicants, admits, and new enrollees in engineering and computer science graduate programs. The share of international students in all other disciplines also increased between 2010 and 2017. Social science and humanities programs have the highest shares of enrollment among underrepresented groups students, and those shares increased between 2010 and 2017.itywide, Fall 2010 and 2017
Graduate enrollment, as a share of UC’s total undergraduate and graduate enrollment, has remained relatively steady over the past 18 years.
4.2.1 Graduate enrollment share of total, Universitywide, Fall 2000 to fall 2017
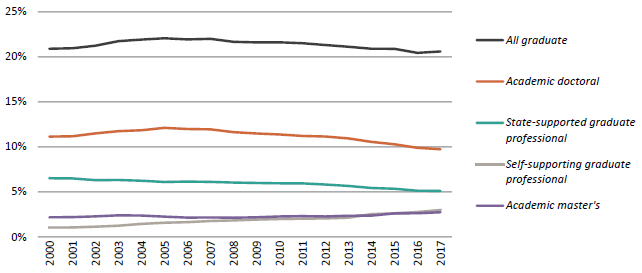
Source: UC Corporate Student System. Academic master’s students include post-baccalaureate teaching credential students. Graduate professional includes professional master’s (e.g., M.B.A., M.Ed.) and professional practice (e.g., J.D., M.D.) degrees.
With 21 percent graduate enrollment in 2017, including health science students, UC was lower than the average for non-UC AAU1 public institutions, at 27 percent, and the average for AAU private institutions, at 55 percent.
In fall 2017, the proportion of academic doctoral students varied across UC’s general campuses, from 7 percent at Merced to 13 percent at Berkeley. At San Francisco, an exclusively graduate health sciences campus, academic doctoral students made up 27 percent of fall 2017 enrollments. Since 2007, the share of academic doctoral students has declined at most campuses due to more rapid growth in the undergraduate, master’s and professional populations.
As shown in indicator 10.3.1, UC awards 20 percent of California’s graduate academic master’s degrees, 63 percent of its academic doctoral degrees and 23 percent of its graduate professional practice degrees.
| Percent of students who are academic doctoral |
|
Fall 2007 |
Fall 2017 |
| San Francisco |
32% |
27% |
| Berkeley |
17% |
13% |
| Los Angeles |
13% |
11% |
| Davis |
11% |
9% |
| Santa Barbara |
11% |
9% |
| San Diego |
11% |
9% |
| Riverside |
9% |
9% |
| Irvine |
10% |
8% |
| Santa Cruz |
7% |
7% |
| Merced |
6% |
7% |
|
|
|
| Universitywide |
12% |
10% |
|
(25,824) |
(26,725) |
Source: UC Data Warehouse
1A list of the institutions in the AAU comparison groups can be found in the appendix.
UC net stipends remain below competitive offers, but the gap decreased substantially between 2010 and 2017.
4.2.2 Average net stipend offered to graduate academic doctoral students admitted to UC compared with their first-choice non-UC schools, Universitywide, 2010, 2013, and 2017
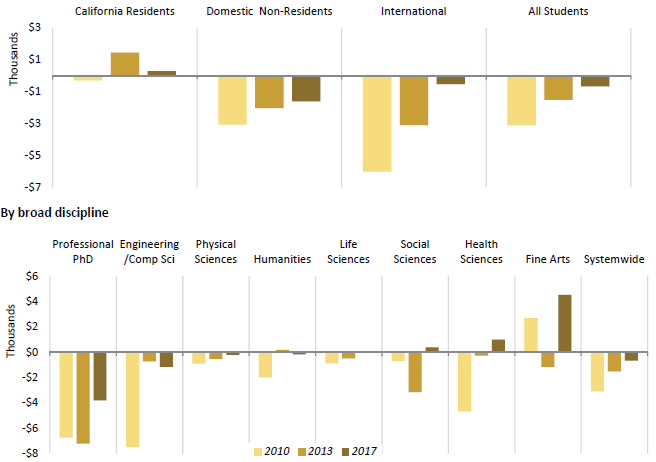
Source: UC Graduate Student Support Survey. Graduate academic professional doctoral programs include EdD, D.Env., DrPH., D.P.T. and D.N.S.
Doctoral students are crucial to a university’s research enterprise and instructional programs. To attract the most highly qualified applicants, universities offer an aid package that includes the cost of tuition and stipends. Net stipend is the amount of aid that students have for living expenses after tuition and fees are paid. It is calculated by subtracting total tuition and fees from a student’s support package (which includes gift aid and teaching or research assistantships). It does not include loans that the student may be offered. The “stipend gap” varies by discipline as shown in the chart above. Since 2010, UC has made considerable progress in closing the net stipend gap with competing institutions, reducing it from $3,000 to about $700 in 2017.
More than half of UC doctoral students graduate without debt. Doctoral students in the physical and life sciences have seen smaller increases in debt over the past 15 years, and graduate with less average loan debt than those in the social sciences and arts and humanities.
4.2.3 Academic doctoral students’ graduate debt at graduation, by discipline, domestic students, Universitywide, Graduating classes of 2002-03 to 2016-17 (every two years)
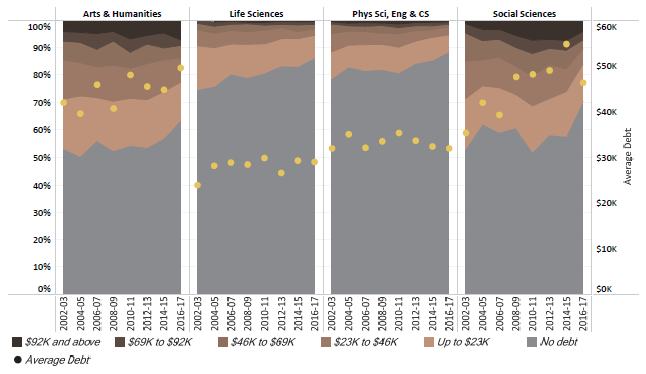
Source: Corporate Student System1
Depending on the field of study, between 60 percent (social sciences) and 85 percent (life sciences) of UC doctoral students take on no additional debt during graduate school.
Several factors account for the difference in debt burden between doctoral students in the physical and life sciences and those in other disciplines. Physical and life science students are more likely to be supported by research grants. Their programs take less time on average to complete than do programs in the social sciences or arts and humanities.
1Debt categories are inflation-adjusted in 2016 dollars using CA CPI-W. “Other” includes interdisciplinary and professional fields. Life sciences include health sciences.
Graduates with the highest debt levels come from professional schools that charge higher supplemental tuition.
4.2.4 Graduate professional degree student debt at graduation, by discipline, domestic students, Universitywide, 2002–03 to 2016–17 (every two years)
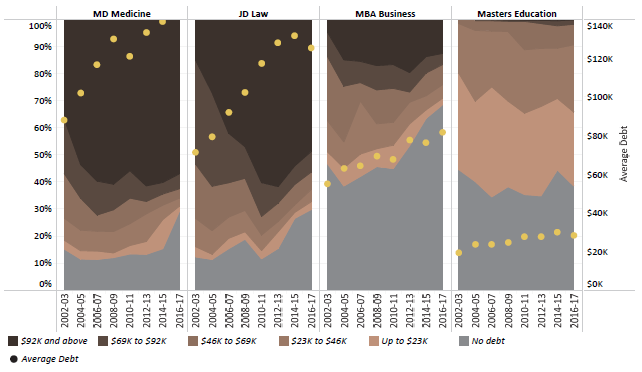
Source: UC Corporate Student System1
On average, about 61 percent of the aid awarded to graduate professional degree students comes in the form of loans rather than fellowships or grants. By comparison, loans constitute only 10 percent of the aid awarded to graduate academic students. Graduate funding models require greater reliance on loans for professional degree students as their programs are of shorter duration and many fields potentially offer higher incomes after graduation.
Most graduate professional degree students finance part of their education by borrowing. The increases since 2002–03 in average inflation-adjusted debt levels of graduating professional degree students vary considerably. Increases in graduate debt result from a combination of factors, including steady growth in tuition, cost of living increases and greater student reliance on federal student loan programs.
1 Average debt is among graduates with debt. Debt categories are inflation-adjusted in 2016 dollars using CA CPI-W.
Like other major research universities, UC awards a high proportion of graduate academic degrees in science, technology, engineering and mathematics (STEM) fields.
4.3.1 Graduate academic degrees awarded by discipline, UC and AAU private and public comparison institutions, Number of degrees grouped in 3-year intervals: 2004-05 to 2006-07; 2007-08 to 2009-10; 2010-11 to 2012-13; 2013-14 to 2015-16
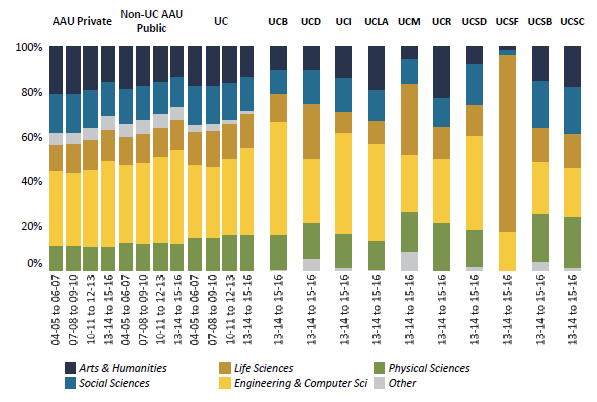
Source: IPEDS1
UC graduates have had major impacts on the nation and the world — creating much of California’s biotechnology and computer industries, developing research breakthroughs that have led to major medical advances, shaping ideas about our world and culture, creating the economic and social infrastructure of our communities, and assuming political leadership in California and the nation.
UC’s graduate STEM programs reflect the predominant industries in California’s economy. In addition to leading all California institutions in the production of engineering and computer science degrees, UC far outpaces them in the production of degrees in the biological sciences — key to driving the growth of California’s biotechnology sector.
More than 25 UC Ph.D. recipients have been awarded Nobel Prizes.
Over the past 12 years, the number of graduate academic degrees awarded at UC grew by 25 percent, compared to 41 percent at the group of AAU private institutions and 25 percent for the group of non-UC AAU public institutions.
1"Other" includes interdisciplinary and academic degrees in otherwise professional fields, such as architecture, communications and public administration.
UC’s doctoral completion rate increased in every field over the two most recent cohorts studied.
4.3.2 Doctoral completion rates after ten years, by broad field, Universitywide, Fall 2000-2001, 2002-2004, and 2005-2007 entry cohorts
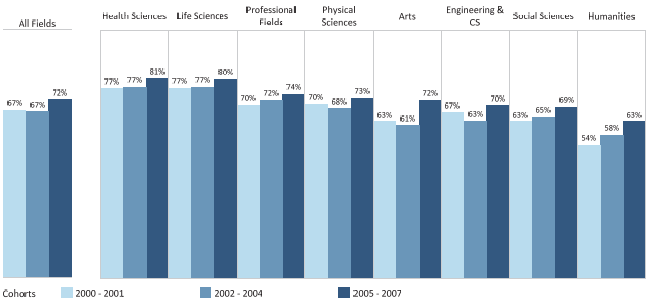
Source: UC Corporate Student System
The universitywide ten-year doctoral completion rate across all fields for the fall 2005–07 entering cohorts was 72 percent. This is an increase from the 67 percent completion rate reported for the 2002–04 cohort. Among broad disciplines, life sciences and health sciences continue to have the highest completion rates. Social sciences and humanities showed the lowest rates, owing to the longer normative time in those fields and different financial support models, although both experienced an increase compared to previous cohorts.
The overall improvement in ten-year completion rates may be attributed to at least two factors. First, student demographics have shifted to include a larger percentage of international students, who, as a group, have a higher ten-year completion rate than the overall cohort’s rate (a variety of factors influence this difference, including different tuition rates for international students). Second, shifts in enrollment toward disciplines with higher completion rates (STEM fields) over time affect the overall ten-year completion rate.
The Doctoral Completion Rates dashboard is available
here.
UC median ten-year time-to-doctorate by ethnicity and gender compares well with AAU institutions.
4.3.3 Median ten-year time-to-doctorate, by ethnicity and gender, Universitywide, AAU public and AAU private comparison institutions, 2012 to 2014 exit cohort
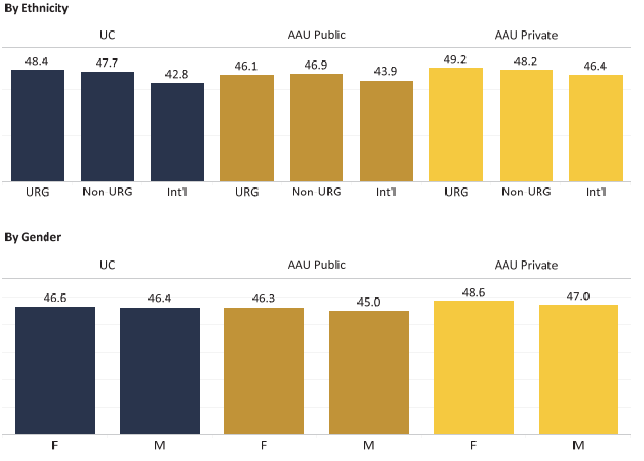
Source: Survey of Earned Doctorates, National Opinion Research Center
The median number of years required to complete a doctoral degree at UC (elapsed time-to-doctorate) is comparable to that at other major research universities. Men and women complete the doctorate in about the same amount of time at UC, compared to AAU public institutions where women’s time-to-doctorate is nearly half a year longer than men’s. Underrepresentd groups (URG) students have slightly longer time-to-doctorate at UC and comparison institutions, whereas international students required substantially less time to complete the doctorate.
The Time to Doctorate dashboard is available
here.
UC median ten-year time-to-doctorate ethnicity and gender by discipline.
4.3.4 Median ten-year time-to-doctorate, by discipline and ethnicity and gender, Universitywide, 2014 through 2016 exit cohort
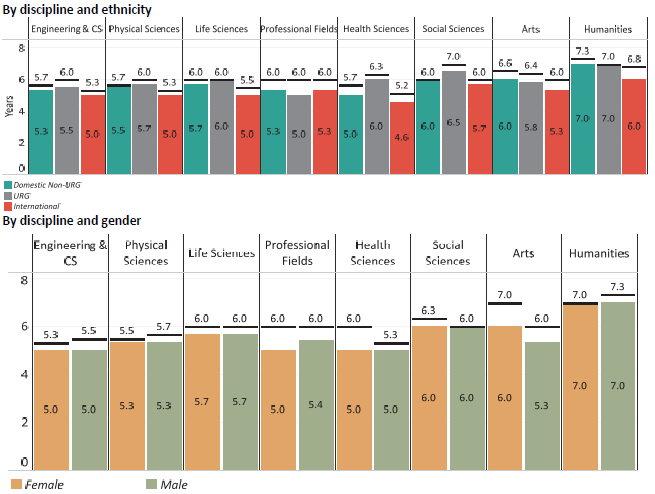
Note: Blue bars indicate median years enrolled, while orange horizontal bars indicate median time elapsed.
In five of eight disciplines, underrepresented groups (URGs) have higher registered time-to-doctorate (RTD) than non-URGs and international students. URG students have slightly lower RTD than non-URGs in the professional fields and arts. The elapsed time-to-doctorate (ETD) for URGs are higher than or equal to non-URGs except for being slightly lower in arts and humanities. International students generally have lower ETD and RTD in all disciplines. Men and women generally have comparable time-to-doctorate, with exceptions in engineering and computer science where women have a slightly lower ETD and the arts where women have a longer ETD and RTD.
The Time to Doctorate dashboard can be found
here.
More than half of UC’s academic doctoral degree recipients plan to stay in California, a greater share than those who attended high school or college in California.
4.3.5 Origin and planned destination of UC academic doctoral degree recipients, Universitywide, 2010–11 to 2015–16
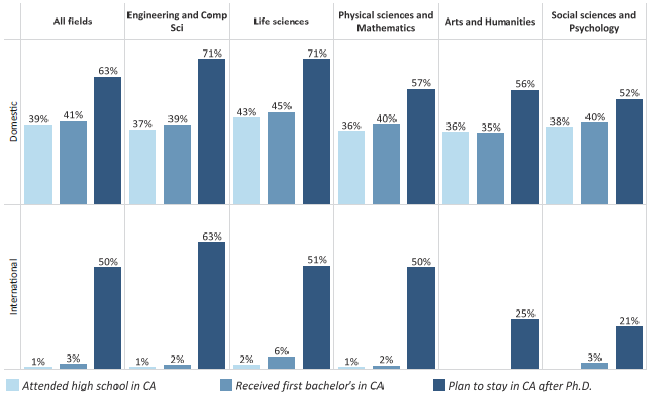
Source: Survey of Earned Doctorates. Excludes UC Merced.
The most recent data for UC’s doctoral degree recipients, based on those graduating between 2010–11 and 2015–16, show that over half plan to stay in California. Sixty-three percent of domestic doctoral degree recipients intend to stay, though only 41 percent of this cohort received their bachelor’s degrees in California, and only 39 percent attended high school in California. This proportion is higher in science, technology, engineering and mathematics (STEM) fields, indicating that UC graduates are contributing to California’s robust economy in these areas.
Though a negligible share of UC’s international (not a U.S. citizen nor permanent resident) doctoral recipients attended high school or college in California, half intend to stay after graduation.
The Survey of Earned Doctorates (SED) is conducted of all individuals receiving a research doctoral degree. It is sponsored by the National Science Foundation, National Institutes of Health, U.S. Department of Education, U.S. Department of Agriculture, National Endowment for the Humanities and NASA.
Half of UC academic doctoral and master’s graduates who stay in California work in higher education.
4.3.6 Industry of employment of UC graduate academic students in CA, by year after graduation, Universitywide, 2000 to 2014 graduating cohorts
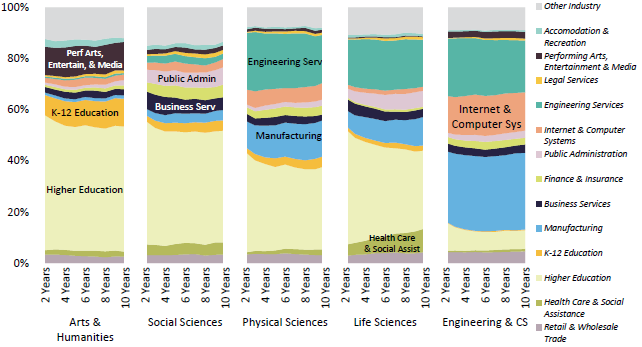
Source: California Employment Development Department and UC Corporate Student System
Note: Includes very small numbers of graduate professional students, who do not affect the overall picture.
The job market for doctoral and master’s degree recipients is nationwide, and those who leave California are not tracked in this data source.
More than 30,000 graduates of UC academic doctoral and master’s degree programs in fields other than engineering/computer science have entered the California workforce since 2000. Over half of them (51 percent) have gone on to work in the state’s higher education workforce, which includes all of the two-year and four-year colleges, both public and private. This highlights the critical role of UC’s graduate academic programs in producing the cadre of faculty who teach California’s future college-educated workforce and conduct research that advances the state and national economies.
The contributions of UC academic doctoral and master’s graduates to the state workforce go beyond higher education. About 12 percent of the employed graduates of UC physical sciences and life sciences programs work in the state’s manufacturing sector, while another 24 percent work in the engineering industry. This shows that the skills gained in UC academic doctoral and master’s programs are both applicable and relevant to key high-tech industries.
UC graduate academic programs in engineering and computer science supply workers to the state’s high-skilled and high-tech industries. Since 2000, over 18,000 graduates of these programs have entered the California workforce, with 35 percent working in the manufacturing sector and 30 percent working in engineering services. Another 22 percent go on to work in the state’s fast-growing internet and computer services industry. About 14 percent of engineering and computer science graduates go on to teaching and research positions in the state’s college and university systems.
Like other major research universities, UC awards a high proportion of professional degrees in business.
4.4.1 Graduate professional degrees awarded by discipline, UC and AAU private and public comparison institutions, Number of degrees grouped in 3-year intervals: 2004-05 to 2006-07, 2007-08 to 2009-10, 2010-11 to 2012-13, 2013-14 to 2015-16
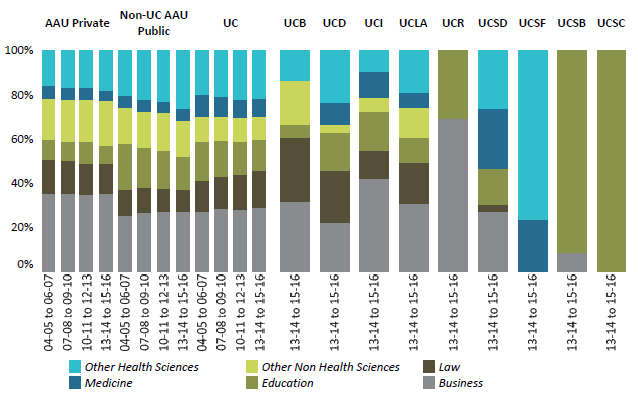
Source: IPEDS1
Graduate professional degrees awarded by discThe proportion of professional degrees awarded by UC is comparable to AAU private and public institutions, with the greatest proportion of degrees awarded in business. The number and size of graduate professional degree programs varies by campus, with UCLA awarding the greatest number of professional degrees.
Over the past decade and a half, UC has opened new professional schools in several areas, including the Rady School of Management at UC San Diego in 2003, the School of Law at UC Irvine in 2006 and the School of Medicine at UC Riverside in 2013.pline, UC and AAU private and public comparison institutions, Number of degrees grouped in 3-year intervals: 2004-05 to 2006-07, 2007-08 to 2009-10, 2010-11 to 2012-13, 2013-14 to 2015-16
1 UC Merced has no professional degree students. “Other” includes disciplines such as public administration, architecture, communications and library science.
UC professional programs prepare graduates for careers related to their field of study.
4.4.2 Industry of employment of UC graduate professional students in California, by year after graduation, Universitywide, 2000 to 2014 graduating cohorts
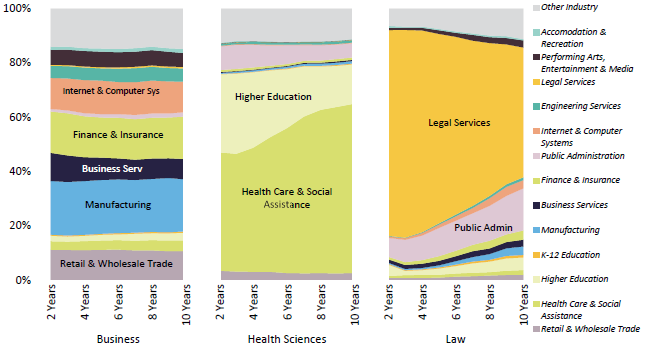
Source: California Employment Development Department and UC Corporate Student System1
Industry of employment of UC graduate professional students in California, by year after Graduates of UC Master of Business Administration (MBA) programs contribute significantly to the state’s high-skilled and high-tech industries. The 18,000 UC MBA graduates who have entered the California workforce since 2000 have worked in a wide array of industries, including manufacturing (26 percent), finance and insurance (20 percent), retail and wholesale trade (18 percent), and internet and computer systems (20 percent).
Over 10,000 graduates of UC health science professional practice programs (e.g., M.D., D.D.S., Pharm.D.) have gone on to work in California since 2000. The majority of these graduates (61 percent) go on to work in the state’s health care and social assistance sector. This highlights UC’s role, per the Master Plan, as the state’s sole public provider of many health science professional practice degrees and validates UC’s success in fulfilling that role. UC health science graduates also play key roles in other areas of public service in the state, including 35 percent who go on to work in the state’s higher education system and 13 percent who work in state government.
UC law school graduates go on to work in two main areas — legal services and government. Of the 9,300 UC law school graduates who have worked in California since 2000, about 79 percent eventually find positions in the legal services industry. Another 14 percent go on to work in the public sector as government prosecutors and public defenders, and in other public agency roles. A large percentage of law school graduates start off in legal services initially after receiving their degree (76 percent), but by ten years after graduation this percentage has fallen to about 48 percent. The percent of UC law school graduates in government rises from 7 percent to 15 percent over the same period.raduation, Universitywide, 2000 to 2014 graduating cohorts
1 Includes very small numbers of graduate academic students (e.g., Ph.D. business), which do not affect the overall picture.