Accountability Report 2018

chapter 6: staff
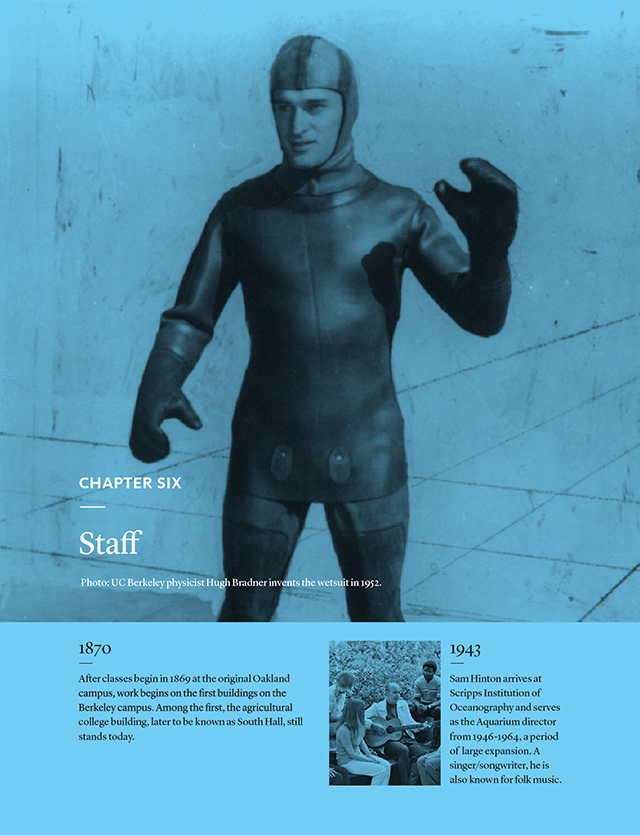
History
The three-pronged mission of the University of California includes undergraduate, graduate and professional education, research, and public service, none of which is accomplished without the support of staff who organize and facilitate all that is required to do the work of the University.

Many arms of the University are wholly run by staff, including UC Press, founded in 1893. Staff are vital in the creation and running of UC’s rich collection of art, history, cultural and wildlife museums and botanical gardens. Anchored by the establishment of The Bancroft Library in 1905, the University of California libraries comprise the largest university research library in the world and is largely managed and run solely by staff.
Overview
Non-academic staff employees constitute about 71 percent of UC’s workforce and are responsible for health services, student services, instruction and research support, compliance and general administration. In October 2017, this group included 154,904 individuals, about a third of who are part-time, particularly student workers. Overall, this workforce represented 113,765.8 full-time equivalent (FTE) employees in that month.
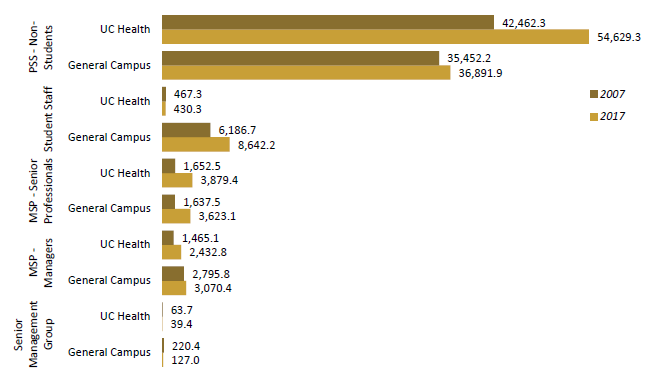
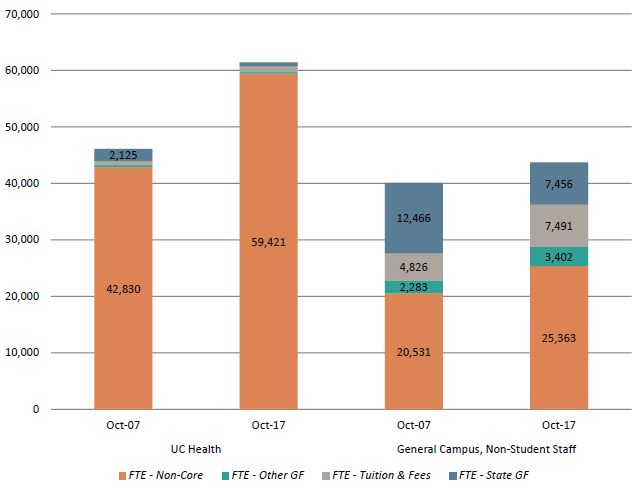
Staff groups and workforce diversity
•    UC Health employs over half of staff FTE as doctors, nurses, administrators, technicians and allied health professionals. About 97 percent of these employees are supported by non-core funds, typically the revenues generated by hospital services.
•    Student workers for the general campus (non-health) are predominately part-time. While their headcount is 34,798, they comprise 8,642.2 FTE. Students often work on campus as part of their financial aid packages or for research experience.
•    General campus, non-student staff are the remainder, at 43,712.4 FTE. This includes student services employees, librarians, IT specialists, research administration, laboratory staff, food and auxiliary service workers, accountants, maintenance and janitorial staff, safety workers and analysts.

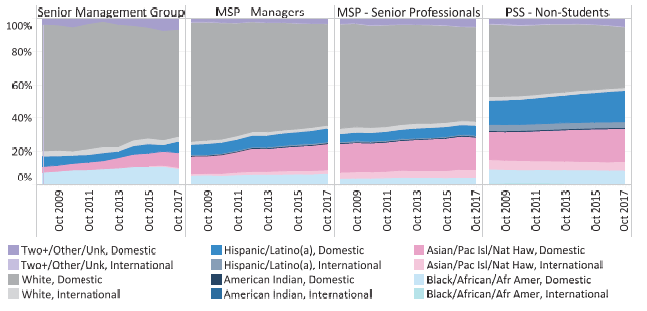
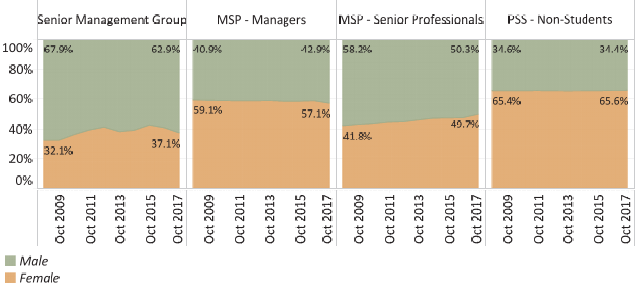
UC is dedicated to building a more diverse workforce, particularly including those from under-represented racial and ethnic populations in the U.S. Staff at UC are majority female and increasingly ethnically diverse across all employee groups. However, there are variations among the different employee groups, as more senior positions tend to be less female and more white. A more diverse academic and staff population is an increasingly important measure of a great university.
Staff compensatioN
Over the past decade, UC has relied less on core funds (state funds, tuition and fees, and other general funds) to cover staff. While UC has over 21,000 more staff than ten years ago, over 2,000 fewer overall FTE are paid on core funds. Even as tuition has increased to cover losses in state funding, less than 20 percent of staff are paid using core funds of any type.

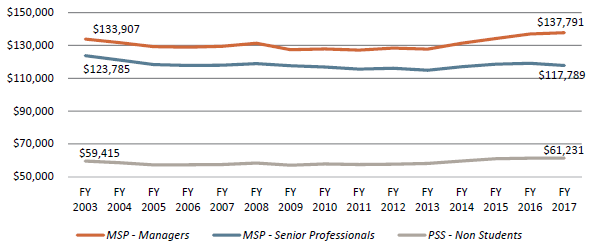
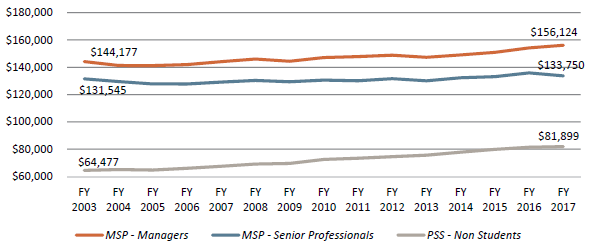
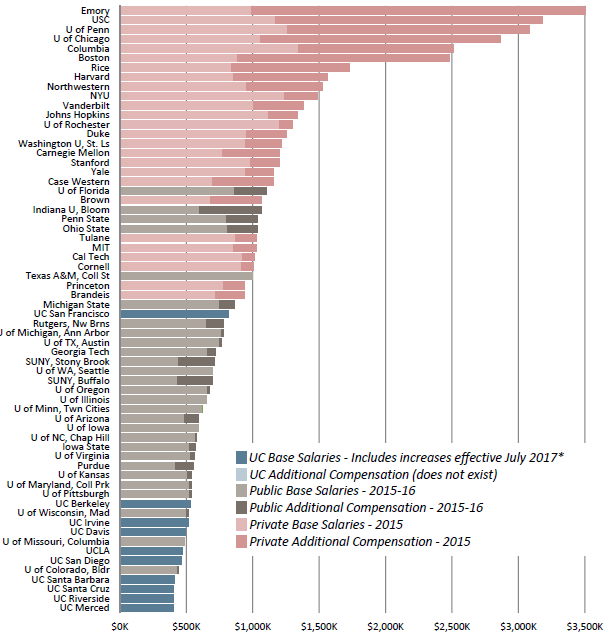
General campus career staff salaries have stayed relatively flat compared to inflation for the past 15 years and have increased modestly for some UC Health professionals. Staff salaries tend to lag comparable market positions, and the lack of increases beyond inflation could affect staff satisfaction and turnover. Chancellor and system leader compensation falls on the lower end when compared to peer institutions.
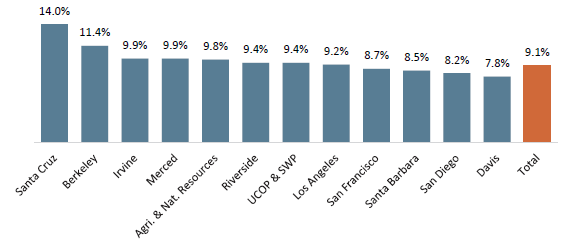
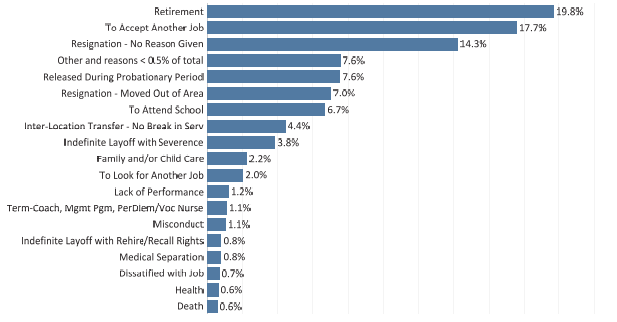
Staff separations and satisfaction
UC’s separation rate among career staff is about 9.1 percent, which has been relatively steady for the past decade. About 20 percent of staff separations are due to retirement and reflect the baby boomer generation exiting the workforce. Still, a large portion of separations is due to resignation for various reasons. The 2017 UC Overall Employee Engagement Survey shows some improvement in engagement, communication and performance management from 2015 but that UC is still below the national norm in eight out of nine employee satisfaction categories.
For more informatioN


UC Health staff have grown significantly as health services have expanded, while general campus non-student support staff (PSS) grew modestly even as enrollment increased significantly over the past decade.

6.1.1      Staff FTE (full-time-equivalent) workforce growth over time, Universitywide, Fall 2007* and 2017

6-1-1

Source: UC Corporate Personnel System

* The Oct 2007 Senior Management FTE includes 81 positions (mostly Deans) that in 2010 were moved under academic employees. Excludes Lawrence Berkeley National Laboratory, Hastings School of the Law and Associated Students UCLA.

UC operates five teaching hospitals as well as schools of medicine, dentistry, nursing and other health sciences education and research programs. Altogether, UC Health accounts for 71.6 percent of non-academic staff growth over the past ten years. The growth has been driven by service expansions such as increases in patient days as well as outpatient/emergency visits.  General Campus student employees grew by 2,455.5 FTE, largely related to the additional 58,000 students UC enrolled over this period. Increased enrollment translates to more student employees working on campus as part of their financial aid packages.

General campus non-student staff has seen the greatest growth amongst Senior Professionals due to both the implementation of Career Tracks and the professionalization of UC’s workforce towards higher-skilled analysis and technical capabilities. Career Tracks is a function-specific, market-aligned job classification system that applies consistent interpretations of which positions are Management and Senior Professional (MSP) and which are Professional and Support Staff (PSS). Within PSS, there has been a significant shift away from clerical roles into student services positions and administrative analysis to manage growing campuses and student bodies.


Over the past 10 years, the proportion of nonwhite staff has grown modestly at all levels. Female representation has grown at the Senior Management Group and Senior Professional levels, and has stayed high at the Manager and Support Staff levels. Even with growth in both of these populations, UC has more progress to make.

6.1.2      Racial/ethnic diversity of non-student staff by personnel program, Universitywide, October 2007 to 2017

6-1-2

6.1.3      Gender diversity of non-student staff by personnel program, Universitywide, October 2007 to 2017

Gender diversity of non-student staff by personnel program, Universitywide, October 2007 to 2017

Source: UC Corporate Personnel System
UC has sought to improve representation of historically underrepresented domestic racial/ethnic groups. Diversity has increased over the past 10 years at all staffing levels; however, management and more senior positions are notably less diverse.
UC is overall majority female, with Manager and PSS positions at well over 50 percent female. The percentage of female employees has grown steadily among SMG and has reached near parity for Senior Professionals.


Since 2007, the number of staff supported by core funds has fallen as state funding for the University has decreased. Non-core funds supported all of the UC Health and non-student General Campus increases over the past decade.

6.2.1      Non-student staff FTE by fund source, October 2007 and 2017

6-2-1

Source: UC Corporate Personnel System

UC Health almost exclusively relies on non-core funds, particularly from hospital revenues, to support its staff. Despite adding more than 15,000 FTE, even fewer FTE today are paid on core funds than ten years ago.

General campus employees are increasingly paid on non-core funds such as research funds, auxiliary revenues and other sources. Though overall general campus staff increased modestly, overall core-funded staff have decreased. This is due to a drop of over 5,000 FTE in state-funded staff, which more than offsets the increases in staff funded by tuition and fees as well as other general funds.


6.2 STAFF Compensation

In the past 15 years, inflation-adjusted salaries have been relatively flat for general campus staff, with moderate increases for some UC Health staff.

6.2.2      General campus career staff average inflation-adjusted base salaries by personnel program, FY 02-03 to 16-17

General campus career staff average inflation-adjusted base salaries by personnel program, FY 02-03 to 16-17

6.2.3      UC Health career staff average inflation-adjusted base salaries by personnel program, FY 02-03 to 16-17

UC Health career staff average inflation-adjusted base salaries by personnel program, FY 02-03 to 16-17

Source: UC Corporate Personnel System; California CPI used for inflation adjustment

Salaries in real dollars have been relatively flat for general campus career staff over the past fifteen years. At the same time, UC employees are contributing more to health care costs and to the UC retirement system, putting downward pressure on the competitiveness of UC’s total compensation compared with the regional labor markets where university centers are located.

Salaries among UC Health career staff have been increasing notably in real dollars for Professional and Support Services (PSS) staff. This reflects market trends in wages for hospital staff and growing demand for healthcare professionals. These UC employees are also contributing more to health care costs and to the UC retirement system.


6.2 STAFF Compensation

UC chancellors are among the lowest-paid when compared to their Association of American Universities (AAU) peers. The UC president’s salary also remains modest compared to public peers.

6.2.4      Base salaries and additional pay for UC and AAU institution leaders

Base salaries and additional pay for UC and AAU institution leaders

Source: The Chronicle of Higher Education Executive Compensation Report and institutional data sources

UC chancellors continue to place among the lowest-paid university leaders compared with their AAU peers. Nine UC chancellor salaries fall among the lowest quarter in this group. UC San Francisco, an exclusively graduate health science campus, is the only exception.

Among public system leaders (a chancellor or president who administers or coordinates multiple campuses), the compensation for UC’s president ranked 68th even with a budget twice as large as the next comparators. The UC president’s compensation has not increased since September 2013.


Separation among staff is about 9.1 percent, with significant campus variation. High retirement reflects an aging staff population; however, significant resignations could point to issues with employee satisfaction.

6.3.1       Separation Rates for Career Staff by Campus and Overall, FY 2016-17

6-3-1

6.3.2       Separation Reasons for Career Staff, FY 2016-17

Separation Reasons for Career Staff, FY 2016-17

Campuses experience a wide range of separation rates among their career staff, which may reflect different mixes of employees and different work environments. High turnover is often costly in terms of lost productivity, lost institutional knowledge and replacement costs.

Nearly 20 percent of separations are due to retirement, a result of the aging baby boomer population. However, resignations to accept another job or with no reason given are collectively rather high, suggesting potential dissatisfaction among career employees.