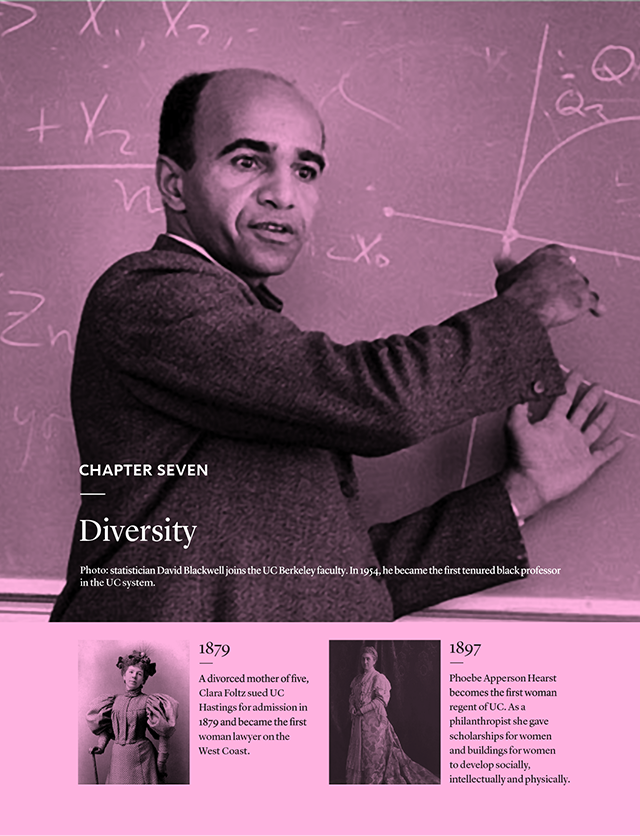
History
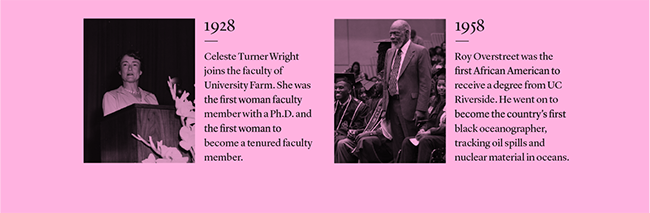
The University of California has a rich history of diversity and inclusion. Since women were admitted to UC equally with men within a year of the University’s opening in 1869, it is not surprising that UC would produce California’s first licensed female architect, the West Coast’s first female lawyer and a first female UC regent before the turn of the twentieth century. In the twentieth and twenty-first centuries, UC produced the first mom in orbital space and the first American woman to walk in space. The first female president of the NCAA was UC San Diego athletic director, Judith Sweet.
UC alum also broke several important color barriers. Jackie Robinson became the first African American in Major League Baseball in 1947 and Ralph Bunche became the first person of color to win a Nobel Prize in 1950—the Nobel Peace Prize.
The policies of the University have created a welcoming environment for students from around the world. In 1930, nearly 10 percent of all international students in the United States attended UC. In 2012, UC Berkeley announced a $1 million scholarship fund for undocumented students.
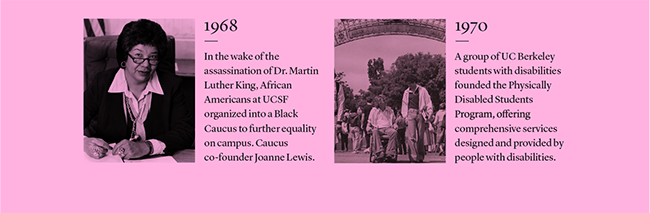
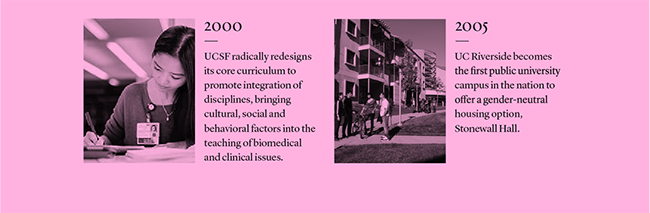
UC also places high value on the contributions of students of different abilities, orientations and cultural backgrounds. The Physically Disabled Students program began in 1970 at UC Berkeley and has been a catalyst for other similar programs systemwide. In 2005, UC Riverside was the first public university campus in the nation to offer a gender-neutral housing option. By 2017 and with the inclusion of UC Irvine, UC counts five campuses named as Hispanic-Serving Institutions.
Goals
The University of California strives to foster a diverse and inclusive community for students, faculty and staff. The University has a long history of supporting initiatives that foster an inclusive living, learning and working environment.
The University’s diversity goals are established in Regents Policy 4440: University of California Diversity Statement, which states, in part:
Because the core mission of the University of California is to serve the interests of the State of California, it must seek to achieve diversity among its student bodies and among its employees.
The State of California has a compelling interest in making sure that people from all backgrounds perceive that access to the University is possible for talented students, staff and faculty from all groups.
Therefore, the University of California renews its commitment to the full realization of its historic promise to recognize and nurture merit, talent and achievement by supporting diversity and equal opportunity in its education, services, and administration, as well as research and creative activity.
The University particularly acknowledges the acute need to remove barriers to the recruitment, retention, and advancement of talented students, faculty, and staff from historically excluded populations who are currently underrepresented.
Findings
UC is making progress in several key areas related to diversity and inclusion. These include:
- A growing number of Hispanic/Latino(a) undergraduates
- Increasing undergraduate graduation rates across all racial/ethnic groups
- Increasing proportions of female ladder-rank faculty across all discipline groups and a slight increase in the percentage of Hispanic/Latino(a) faculty
- Slow but steady progress in the percentage of underrepresented graduate academic students
- An increasingly diverse workforce of career staff
At the same time, challenges include:
- Low enrollment of African American and American Indian undergraduate students
- Low proportion of female and underrepresented faculty, compared to availability pools in most disciplines (presented in Chapter 5)
- Undergraduates of historically underrepresented groups reporting not feeling respected on campus
- Employee satisfaction issues from the staff engagement survey (presented in Chapter 6 of this report)
- The graduation gap between underrepresented undergraduates and White and Asian undergraduates (presented in Chapter 3 of this report)
Evaluating diversity
UC evaluates its diversity in a variety of ways: current demographic characteristics and trends of its students, faculty and staff; analysis of the academic pipeline from entry to exit; and survey data that reveal perceptions of campus climate and respect.
Chapters 1, 2, 3 and 4, present an overview of trends for undergraduate, graduate academic and graduate professional students, faculty and staff. This feeds into an overview of the University by race/ethnicity and gender.
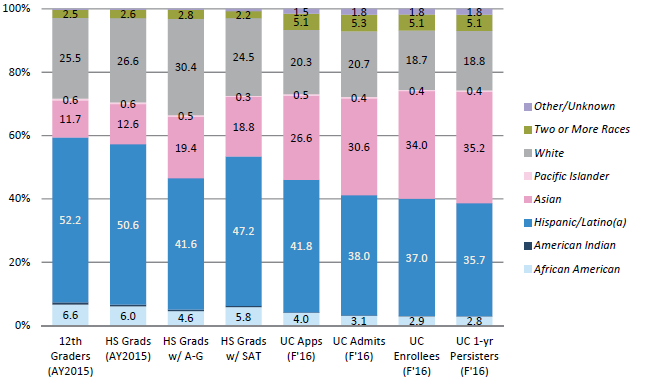
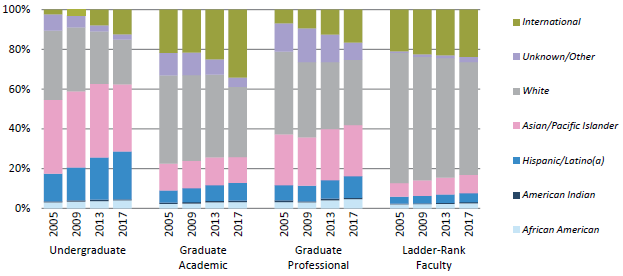
As shown in indicator 7.3.1, trend data illustrate growing proportions of underrepresented and international students in the undergraduate population. Over the last 15 years, the proportion of Hispanic/Latino(a) undergraduates has grown tremendously, reflecting the growing number of Hispanic/Latino(a) students in California and improved high school graduation rates. Five UC campuses (Irvine, Merced, Riverside, Santa Cruz and Santa Barbara) are designated by the federal government as Hispanic-Serving Institutions (HSIs). A sixth institution, UC Davis, recently applied for HSI status, and UCLA and UC San Diego have seen significant growth in their Hispanic student populations as well.
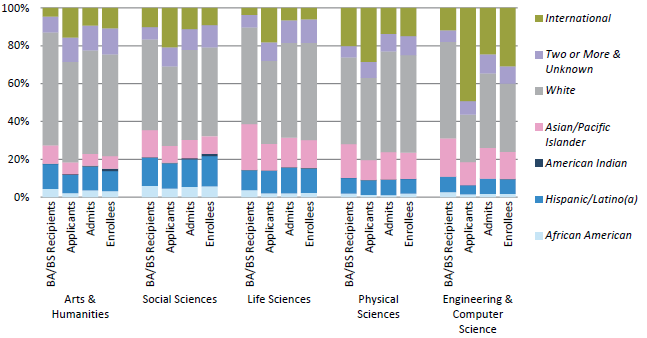
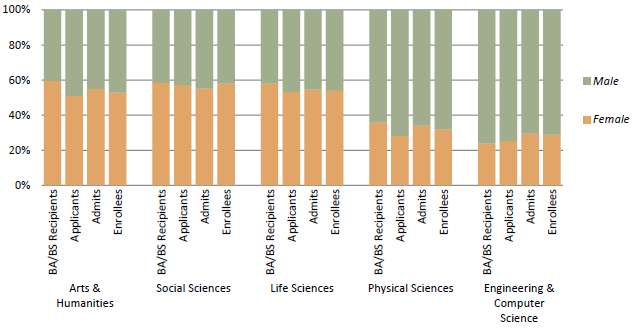
Chapter 4, indicator 4.1.2, shows that among graduate academic students, underrepresented populations show steady increases across disciplines, with growth in international students, primarily in physical science and engineering. Female students are the majority in all disciplines except for physical science and engineering. Graduate professional degree programs show similar patterns for underrepresented and international students, with variation by discipline. Education programs have a larger proportion of underrepresented students, and business and other professional degree programs have growing international populations. The proportion of female students in graduate professional degree programs is trending slightly downward but remains around 50 percent or higher for all disciplines except business.
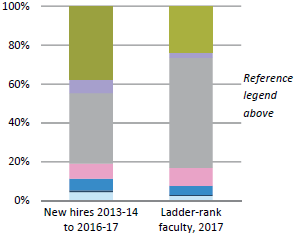
The proportion of women and underrepresented groups in the faculty continues to grow at a modest pace. Younger faculty cohorts are noticeably more diverse than older cohorts. Compared to ladder-rank faculty, many other academic positions are more ethnically diverse and gender balanced because they experience more rapid turnover. Still, comparing UC’s faculty diversity to peer research institutions, UC places 3rd in terms of female faculty and 2nd in terms of underrepresented faculty.
For staff, the proportions of nonwhite and female Managers and Senior Professional (MSP) and Senior Management Group (SMG) positions are smaller than their proportions in Professional and Support Staff (PSS) positions. The proportion of females among ladder-rank faculty is lower than proportions among other academic employees, as shown in Chapter 5.
Pipeline analysis
UC diversity is also assessed by examining the various steps along the academic pipeline to determine gaps in access or attainment.
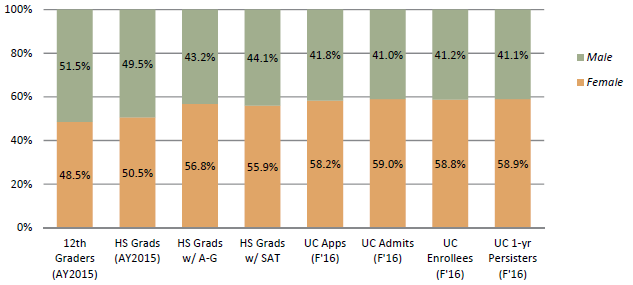
In the undergraduate pipeline from high school graduation to the end of the first year at UC, about 6 in 10 California public high school 12th-graders come from historically underrepresented groups. However, only about 4 in 10 of these 12th-graders who enrolled in UC and persisted past their first year came from underrepresented ethnic groups. This is a strong indication UC is not keeping pace with the diversity of California high school graduates.
Surveying students about diversity on campus
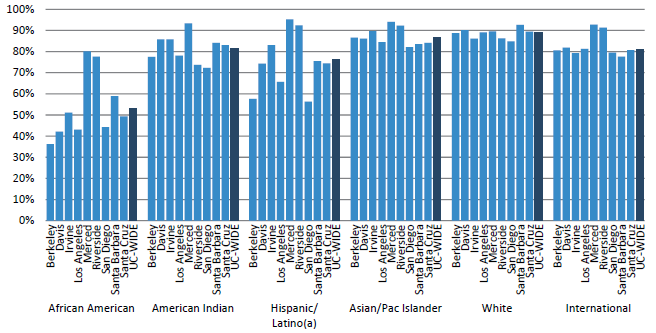
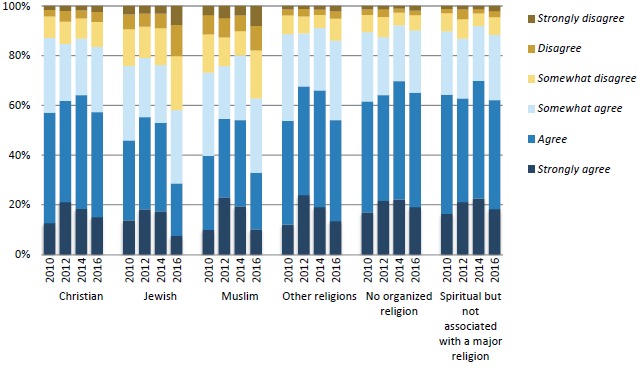
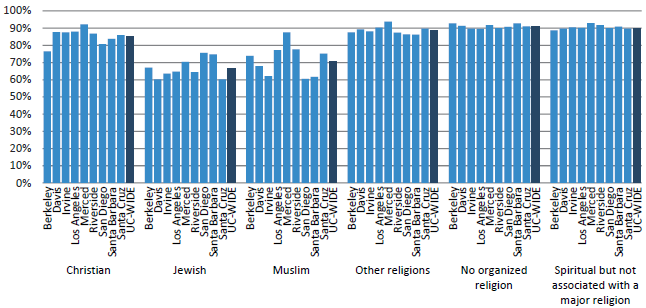
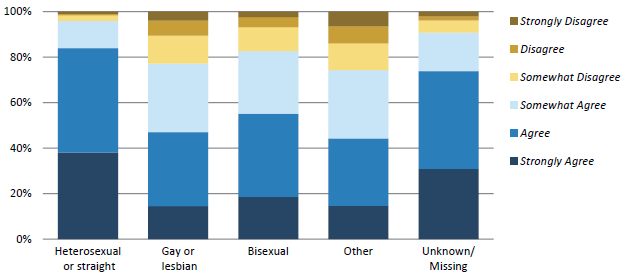
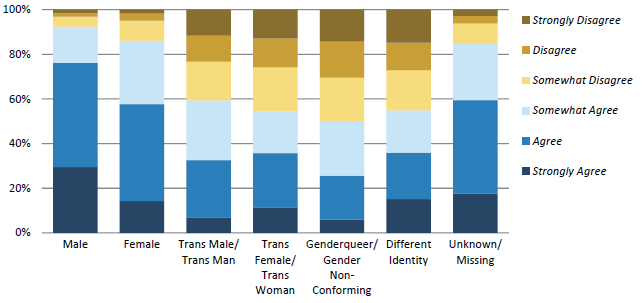
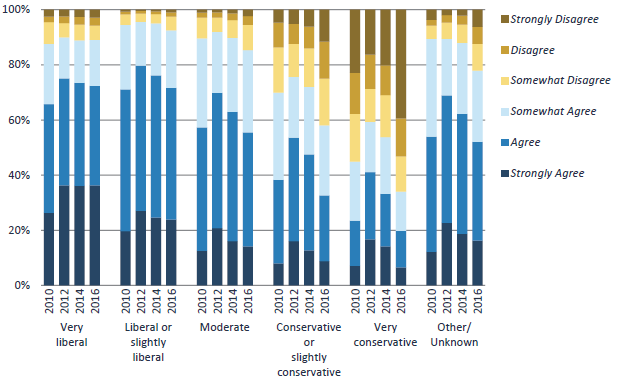
This chapter presents responses to the UC Undergraduate Experience Survey (UCUES), given every two years to all undergraduates. The University’s goal is to ensure that all students are respected on campus, regardless of race/ethnicity, religious affiliation, gender, sexual orientation or political beliefs.
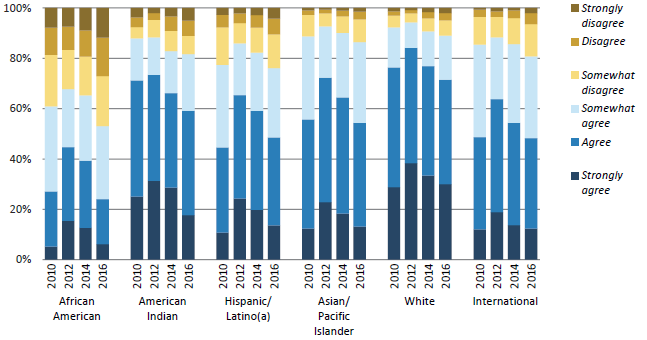
University of California Undergraduate Experience Survey (UCUES) data show most undergraduates feel students of their race/ethnicity are respected on campus, but the proportion of African American respondents sharing this perspective is lower than other groups. Among religious identifications, Muslim and Jewish students are less likely to feel respected. LGBQ students are also less likely to feel respected, as are students identifying as conservative politically.
Looking forward — diversity initiatives
Through its college preparation outreach programs, UC devotes considerable resources to college preparation support for more than 100,000 K–12 and community college students each year. This effort results in a greater number of students who are qualified for UC. Of the high schools served by UC, roughly 70 percent are consistently among the lowest-performing schools in the state. Participants in these programs have higher rates of enrollment in California public college segments, and those who are accepted to UC enroll at higher rates than their peers.
UC’s college preparation programs help remove obstacles to attending UC, encouraging participants to apply and enroll at UC at higher rates than those for California public high school graduates overall. The most recent data for fall 2017 show the enrollee yield — the ratio of students admitted to UC who enroll — for participants in UC academic preparation programs is higher (60.9 percent) than for all California public high school graduates (54.3 percent.)
African American participants in a UC college preparation program were also more likely to enroll at a UC campus than were their peers who did not participate (62.2 percent compared to 54.3 percent).
In addition to funding UC’s college preparation programs, the 2016–17 state budget for UC included $20 million in one-time funding for support services for “low-income students and students from underrepresented minority groups.” This included students enrolled in high schools eligible for supplemental funding under the Local Control Funding Formula (LCFF) due to their large populations of low-income or educationally disadvantaged students. UC campuses used this funding primarily to increase the application, admission and enrollment of students from these schools, and to provide academic support services to educationally disadvantaged students who enrolled. Outcomes from this initiative were reported to the legislature in fall 2017.
In October 2015, the Office of the President launched the President’s Diversity Pipeline Initiative (DPI) to expand the academic pipeline to the University of California for undergraduate students, graduate students and faculty who remain persistently underrepresented at UC. This Initiative builds on existing University resources, including admissions policies and practices, academic preparation (outreach) programs and community partnerships. Outcomes from the DPI include:
- Admissions of African American freshmen in fall 2017 were up by 30.6 percent from fall 2015
- 43.8 percent of fall 2018 California freshman applicants were from underrepresented group (URG) backgrounds
- 38.4 percent of new freshmen from California public high schools in fall 2017 were from URG backgrounds
- UC college-prep programs saw a 17.4 percent increase in African American student enrollment from 2012–13 to 2016–17
The UC-HBCU Initiative improves diversity and strengthens graduate programs by strengthening relationships between UC campuses and Historically Black Colleges and Universities (HBCUs). Since its inaugural year (2012), more than 315 HBCU scholars have participated in the program, which offers faculty-led summer research opportunities and year-round mentoring. Twenty-seven Ph.D. students and two M.A. students from HBCUs are currently enrolled at UC, and three M.A. students have already graduated from UC as a direct result of the program.
The President’s Postdoctoral Fellowship Program (PPFP) is a keystone program at the University of California supporting diversity within UC’s faculty. The PPFP includes financial support and career development training for postdoctoral scholars with the potential to become successful faculty within the UC system. Fellows must have a demonstrated record of commitment to diversity in their research, teaching and/or outreach. The application process is highly competitive, with more than 500 applicants annually for 20 fellowships. Over 850 postdocs applied in 2017-18. The President’s Postdoctoral Fellowship Program and related Chancellors’ Fellowship Programs at individual campuses have accounted for 11.5 percent of new underrepresented faculty hired at UC in the last ten years, with 165 PPFP fellows alone hired into UC tenure-track positions since 2004.
For more information