History
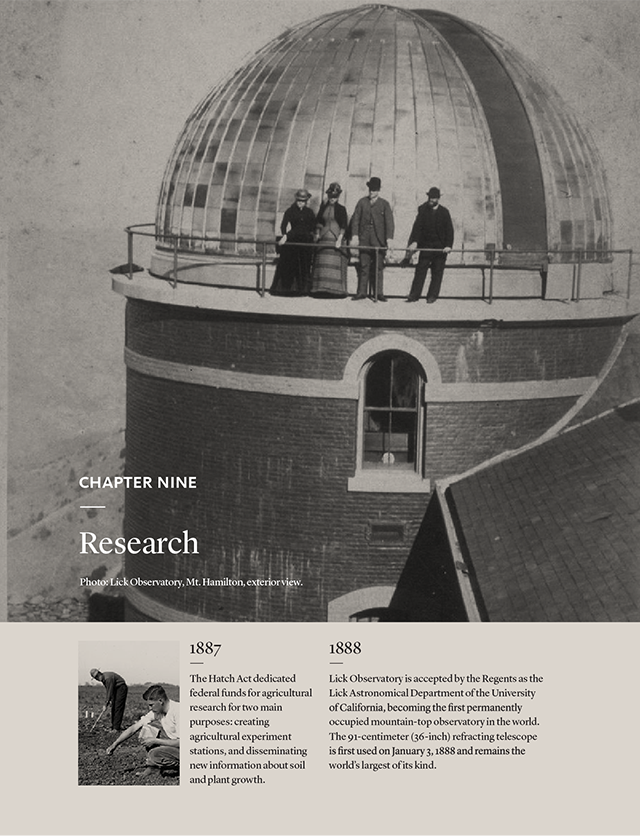
Nineteen years after the University of California was chartered in 1868 as California’s land-grant institution under the Morrill Act, the Hatch Act of 1887 linked research and public service to instruction as inseparable elements of the University’s mission. It allocated federal funds to land-grant colleges for research at agricultural experiment stations and making the latest agricultural methods publically available. The Hatch Act, after many reauthorizations and expansions, still provides UC funding for agricultural research and cooperative extension.
Federal research funding in the early part of the 20th century focused on agriculture and later, aeronautics, with other fields supported by industrialists, philanthropists and the University’s own funds. This changed in the lead-up to World War II, when President Roosevelt recognized the military importance of science and technology research, funding initiatives such as the Manhattan Project. This wartime effort drew upon the talents and research findings of UC scientists and engineers, including teams from UC Berkeley’s Radiation Laboratory, founded in 1931 by physicist Ernest O. Lawrence, a UC Nobel Prize Laureate.
The early post-war years saw the creation of the grants program at the National Institutes of Health and the formation of the National Science Foundation. These federal agencies are UC’s two largest single sources of sponsored project funding, providing about 44 percent of the roughly $5 billion in research support UC received from external sources in 2016-17. Thanks in major part to the long history of federal funding, the University of California system has grown into the world’s largest and most prominent university research system, with more than 800 research centers, institutes, laboratories and programs that span ten campuses, five medical centers, three national energy laboratories and numerous research facilities.
Evaluating the research enterprise
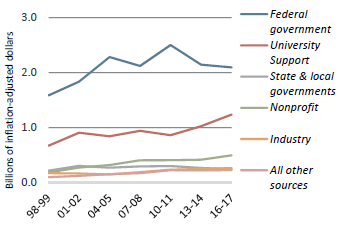
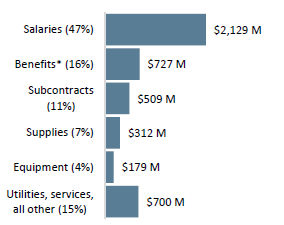
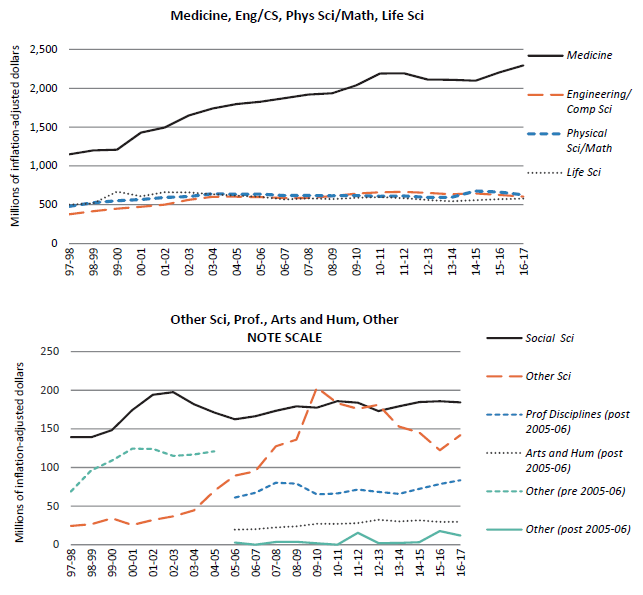
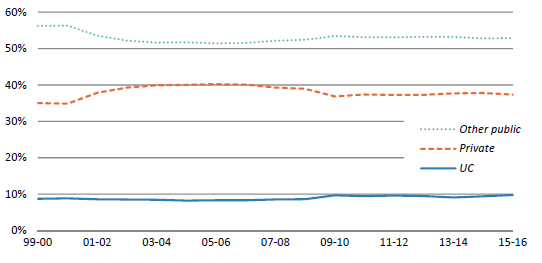
This chapter presents a largely quantitative description of UC’s research activities. The sources of research funding influence the nature of the research. Federal support initiated UC’s research mission and currently provides more than half of all research funding (9.1.1). Most research funds pay the salaries and benefits of UC’s research community, of which faculty are only a small proportion (9.1.2). While UC’s research spans many disciplines, medical research is the largest expenditure component, and its share has grown over the last two decades (9.1.3).
UC performs nearly one-tenth of the nation’s academic research (9.1.4). Compared to other research universities, UC has a higher rate of research expenditures per ladder-rank faculty (9.1.5), especially at UC campuses with medical schools (9.1.6). Three National Energy Laboratories are affiliated with the University of California, conducting research that is vital to the nation’s security and energy future.
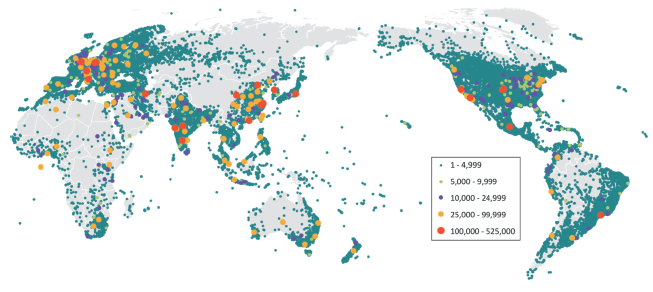
This chapter considers the impact of this research on society. One of the goals of research is the dissemination of its findings; the global distribution of downloads from UC’s eScholarship Repository (9.2.1) indicates how eagerly this knowledge is sought. The frequency at which UC research is cited is another indicator of its quality and importance (9.2.2). UC research advances the economy and technology through licenses and startups resulting from UC’s patents (9.2.4, 9.2.5).
These measures, however, do not capture the wide range of curiosity-driven research at UC. Quantitative measures emphasize fields that receive sizable funding and produce large numbers of publications, such as medicine, physical and material sciences, and engineering. These measures underrepresent research achievements in the arts, humanities, social sciences and theoretical sciences, where work leaves less of a financial footprint, and where results are disseminated in books or performances rather than journal articles.
Quantitative measures cannot capture how UC research contributes indirectly and over time to the state and to the nation through discoveries that improve health, technology and the quality of life; how involvement in research, and hearing about discoveries from the world’s foremost researchers enhances the learning experiences of UC’s graduate and undergraduate students; or how thoughtful work in the arts and humanities furthers our understanding of ourselves as one species among many on this planet.
The size and scope of UC’s research programs
Over the course of a century and a half, breadth of vision has been a virtue of UC’s research. All forms of intellectual inquiry are represented in the research enterprise: the architecture of atoms and the structure of the universe; the study of human cognition and the development of machine learning; the study of human pathogens and the creation of disease-resistant crops. The diversity of this vision contributes to society in ways often hard to predict at the outset. Research represents the creation of new knowledge that can be communicated and curated to benefit society.
While research expenditures track only some of this activity, they can indicate how research changes in scope and focus over time, and can provide some relative sense of how research institutions compare to one another. During 2016-17, direct expenditures for research at UC totaled over $4.5 billion, with federal funds providing about half. Private sources account for about 17 percent — 11 percent from nonprofit organizations and 6 percent from corporate sponsors. About one-quarter represented the University’s own funds derived from gifts, endowments, general funds and other sources. Nearly two-thirds of research expenditures in 2016–17 went to salaries and benefits. Of this, about one-quarter went to faculty; the majority supported staff researchers, and about one-fifth went to students and postdoctoral scholars.
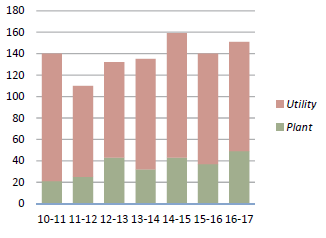
Budgets for externally funded research include both a direct cost component — the actual amount spent on salaries, benefits, equipment and materials directly linked to the project — plus a percentage to cover the facilities and administration required to support the research project, including debt service, maintenance and libraries. These facilities and administration costs are called “indirect costs.”
In 2016–17, UC’s indirect cost recovery was just over $1 billion, with the great majority from research activities. (Other forms of sponsored projects, such as service and training grants, also include indirect cost components.) The true indirect costs of research, however, are typically higher than the rate that research sponsors are willing to pay. Rates negotiated with federal agencies range from 53 to 57 percent across UC campuses, but this is still 18 to 20 percentage points below the true indirect costs. Non-federal research sponsors, including corporations, nonprofits and the state of California, have policies that limit indirect cost rates to well below federal rates. The true costs of UC research exceed recovered amounts by hundreds of millions of dollars annually, which must be made up from other sources.
The research community
Research funds principally pay for people’s time. Of the roughly 155,000 full-time equivalent (FTE) employees at the University, nearly 27,500, or about 18 percent, were paid with research funds.
UC’s Research Workforce, 2016-2017, FTE
| Students |
4,310.6 |
16% |
| Postdoctoral researchers |
4,337.6 |
16% |
| Other staff |
11,203.0 |
41% |
| Other academics |
4,546.6 |
17% |
| Faculty |
3,068.4 |
11% |
| Grand total |
27,466.2 |
100% |
While faculty serve as Principal Investigators for research projects, submitting proposals and managing the research, they make up only 11 percent of the research community, as measured in terms of compensated time. However, this figure, principally representing projects with research grants, underrepresents the time faculty spend on research. Virtually every faculty member at UC engages in research, often involving no expenditures other than the faculty member’s time. As in all research universities, career advancement at UC (including tenure), requires a significant body of scholarly or creative work. The research community includes over 4,300 FTE postdoctoral researchers, representing about 6,400 individuals (many post-docs either teach or are less than full-time). As shown in Indicator 5.1.4 of this report, postdoctoral scholars are most prominent in medical research and life science fields.
Research results — enhancing instruction
UC’s research enhances the student experience. Faculty incorporate their research into their courses, providing students with access to insights and discoveries, sometimes before they are published. Postdoctoral scholars, representing one-sixth of the research workforce, contribute to instruction by working with graduate students while on their own instructional journey towards becoming the next generation of faculty and researchers. Students make up another one-sixth of the research workforce, mostly graduate students. In 2015–16, of UC’s 56,000 graduate students, about 15,000 were employed as paid research assistants. UC undergraduate students also participate in the research community; the 2016 UC Undergraduate Experience Survey found over 40 percent of UC students had been involved in faculty-directed activity other than coursework, such as research or creative projects.
Research results — spurring the economy
Many businesses in California are based on technology developed at UC or rely on the skills of UC graduates. Over the past two decades, UC has secured more licensable patents than any other U.S. research university. Since 1976, over 1,000 startup companies have been founded around UC inventions, with about 85 percent based in California. UC researchers submit nearly five new inventions a day in areas spanning from agriculture, technology, biotech and clean energy. The discoveries made through research become public knowledge through publications and the patent process. These innovations enhance industries, stimulate economies and improve health and well-being.
Research results — communicating and curating knowledge
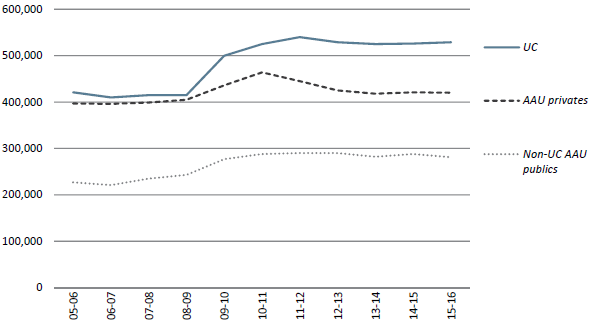
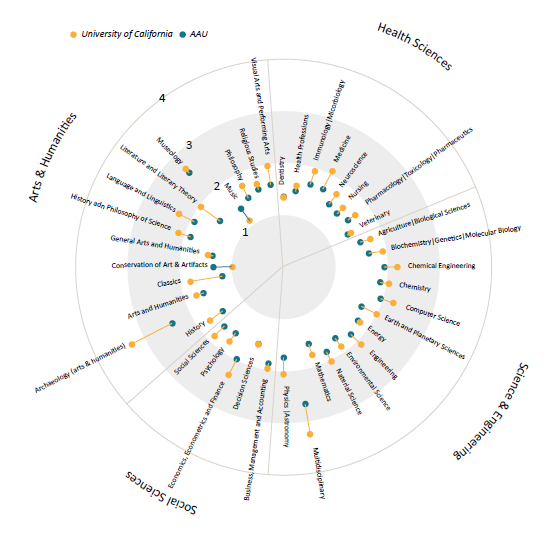
Publications are perhaps the most visible results of research. Between 2012 and 2017, UC campuses produced about one-twelfth of the nation’s research publications. This chapter compares the volume and impact of UC research publications to nationwide averages and to the output of peer AAU institutions.
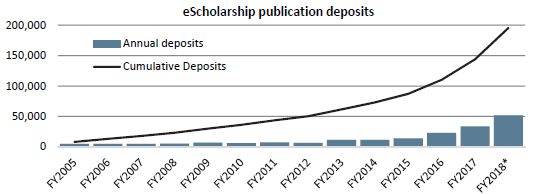
The books, periodicals and journals in which research findings are published are costly and beyond the reach of many researchers, students and journalists, especially in developing regions. To ensure that research findings become public, UC has adopted Open Access (OA) policies that are the most comprehensive of any academic institution in the United States. All UC employees must now deposit their research papers, upon publication, in the eScholarship repository operated by UC’s California Digital Library (CDL) and grant a non-exclusive license to UC to make those materials openly available.
The UC academic community leads the country in advocating for an open scholarly communication environment that emphasizes immediacy, sustainability and expansive access to research. Their advocacy sends the message that the academic community wants to own/control its own work, resist the skyrocketing costs of journal subscriptions, and ensure global access to research findings. These policies sit within a broader effort at UC to reconceive the scholarly publishing environment and restructure its economics to better support open dissemination. CDL is further advancing this effort systemwide by negotiating agreements that reduce or eliminate the costs of publishing OA with publishers, developing models to transition subscription journals to open access, and supporting tools and services to disseminate research.
UC also disseminates its research directly. In 2018, UC is celebrating the 125th anniversary of the founding of the UC Press. In 1893, the University’s governing board funded a non-profit publishing program, establishing the UC Press. Today, the UC Press is among the six largest university publishers in the United States, and publishes approximately 200 books and 40 multi-issue journals annually. Of the nation’s top university presses, UC press is the only one associated with a public university.
Research results — improving health
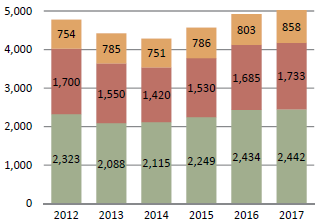
Clinical research projects are another example of cultivating new knowledge to benefit society. During 2016–17, UC began more than 1,000 new clinical trial research projects in addition to the 2,500 already underway. These projects represent a crucial stage in the journey from a scientific discovery to an effective treatment. Of the research dollars that came to UC from businesses during 2016-17, 57 percent was directed toward clinical trials.
Research results — assessing climate change and charting the energy future
UC is a national and global leader in research on climate science, including monitoring atmospheric changes and global temperature rise, as well as assessing the impacts of climate change on marine and land-based ecosystems and the built environment. UC scholars and students carry out some of these studies at UC’s 39 Natural Reserve System (NRS) sites around California. Most of UC’s climate science work is funded by federal agencies. Each year, the University, together with the UC-affiliated Lawrence Berkeley and Lawrence Livermore National Laboratories, receives an average of $218 million in federal funding to pursue climate research.
UC National Laboratories – science in the national interest
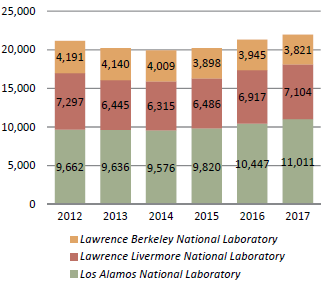
The three University of California-affiliated National Laboratories — Lawrence Berkeley (LBNL), Lawrence Livermore (LLNL) and Los Alamos (LANL) — are among the nation’s premiere multi-disciplinary research and development (R&D) laboratories for energy and national security. The University has played a public service role as a manager of these three Department of Energy (DOE) national laboratories, with annual budgets of over $5 billion and a combined workforce of more than 22,000. The Laboratories also support UC’s educational mission. At LBNL, 23 percent of employees are student assistants, graduate research assistants or postdoctoral scholars. At LLNL, three percent of the workforce are postdocs and, at LANL, almost 16 percent are postdocs or student assistants.
Looking forward –uncertainties in federal research funding
With federal funding supporting more than half of UC’s research, the vitality of UC’s research enterprise is dependent on agencies whose funding is reviewed annually. The current federal budget, passed in March 2018, calls for increased support for academic research through the current fiscal year. This boost to federal funding contrasts with the President’s Budget Proposal, which would have drastically reduced all agency appropriations for research, including a cut of over 21 percent at the National Institutes of Health, UC’s largest single source of research funding. Given this difference, the long-term prospects for federal sponsorship, particularly for climate and environmental science, but including fundamental medical research, are uncertain.
Whatever changes in priorities are embodied in the federal budget, one certainty is that the competition for federal funding is becoming increasingly competitive. At the National Institutes of Health, only one proposal is funded for every five received, compared to about 32 percent fifteen years ago, even though total appropriations for research have increased. UC is competitive in garnering these awards, but this comes at a cost. The administrative effort of drafting, reviewing, submitting and tracking proposals is one of the less-visible costs of conducting research — costs that are not fully recovered from federal sponsors.
For more information