Executive Summary
The University of California produces the UC Accountability Report to provide greater transparency and awareness of University operations. This report, along with the online UC Information Center, allows the public to learn more about the University, and for UC leadership to identify areas of strength and opportunities for improvement for the system and UC campuses.
2020 will forever be known as the year that the COVID-19 pandemic upended virtually every facet of American life. UC has moved quickly to bring the full power of its research and healthcare enterprises to address the crisis. This summary begins with a high-level overview of those efforts, and highlights UC’s research role more generally.
2020 marks the centennial of women’s suffrage in the United States, as well as the 150th anniversary of women’s admission to the UC. Those important milestones are reflected here with a look at the contributions made by UC women since then, and a snapshot of continuing gaps academic positions.
This year will also be remembered for tragic events that sparked a long-overdue national conversation about institutional racism, which continues to plague our country and endanger the lives of Black Americans. The summary next highlights the current efforts across UC, particularly as part of UC’s multi-year UC 2030 plan, to better reflect the full diversity of the state and to end long-standing racial disparities in enrollment, graduation rates, attainment of advanced degrees, and faculty representation. The UC 2030 plan is a collective effort of UC leadership — the President, Chancellors, and Board of Regents — to address inequities and strengthen California’s future by investing in the next generation of UC graduates, faculty, and research.
Responding to the COVID-19 Pandemic
The World Health Organization (WHO) declared a Public Health Emergency of International Concern to the coronavirus disease of 2019 (COVID-19) on January 30, 2020; Governor Gavin Newsom declared a state of emergency on March 4th. The WHO declared COVID-19 a pandemic on March 11th.
UC has a history of supporting Californians and the world during medical crises. In the 1980s, a mysterious ailment — eventually named human immunodeficiency virus or HIV — was affecting large numbers of gay men. At that time, an HIV diagnosis was treated as the equivalent of a death sentence. But UC physicians and scientists helped pioneer new antiretroviral medications and enhanced patient care to make it a survivable condition. Today, most HIV-positive people who receive care live normal lives, and UC doctors and researchers speak optimistically about finding a cure.
When the current crisis hit, UC medical centers were among the first in California to ramp up operations to care for COVID-19 patients, adding surge beds to increase capacity and strengthen the state’s response to the pandemic. UC medical centers and UC research labs began in-house testing, along with producing masks, swabs, and hand sanitizer, even converting sleep apnea machines into ventilators, to address the shortage of Personal Protective Equipment (PPE) and other supplies. UC has also sent health professionals to locations badly hit by COVID-19, including New York and the Navajo Nation. Now, UC is partnering with the state to train 20,000 people to do contact tracing, an essential role for containing new outbreaks.
- UC also responded with accelerated research initiatives. By early April, more than 300 research projects, proposals, and clinical trials for COVID-19 were active, including but not limited to:
- Testing the safety and efficacy of a range of drugs approved for other conditions, which may be effective for COVID-19, including developing a vaccine with patch delivery technology
- Using machine learning at UC’s national lab supercomputers to answer questions about the virus in hours or days, rather than weeks or months
- Mapping a key protein that may aid in the development of a COVID-19 vaccine, along with studying everything from coronavirus mutations, infection prevention and community mobilization to the regulatory, policy and economic implications of the virus.
The University of California houses the largest and one of the most comprehensive health sciences training programs in the nation, with nearly 15,000 students (11.1.1). Based on historical averages, more than 70 percent of graduates from these programs will remain in California after graduation or residency (11.1.2). This makes UC Health one of the principal sources for the training of health professionals for California.
UC-trained health sciences professionals remain in California in high numbers.
11.1.2 Location of doctors, nurses, dentists, optometrists, and veterinarians trained by UC since 1999 and currently licensed in California.
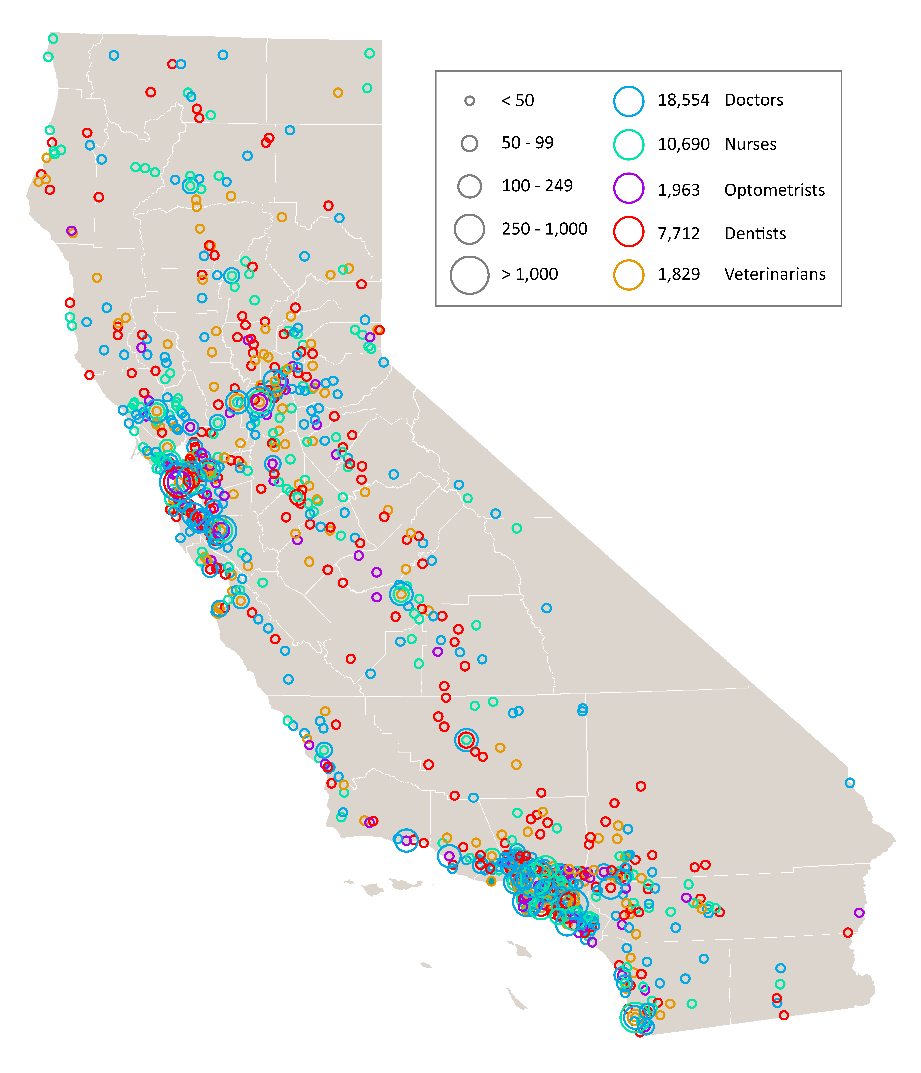
Source: CA Department of Consumer Affairs
Serving as California’s Research Powerhouse
The California Master Plan for Higher Education designates the University of California as the primary state-supported academic agency for research, with the state investing in top-tier research faculty to advance that goal. California’s investment in UC faculty and their research benefits both the state and nation. For example, more than half of UC’s $4.9 billion in direct research expenditures either came directly from the federal government or as federal flow-through funds from other entities (9.1.1), most of these funds originating from outside California.
Many businesses in California are based on technology developed at UC or rely on the skills of UC graduates. Over the past quarter century, UC has secured more licensable patents than any other U.S. research university. Since 1976, over 1,000 startup companies have been founded around UC inventions, with about 85 percent based in California. UC researchers submit nearly five new inventions per day in such diverse areas as agriculture, technology, biotech, and clean energy. UC research has helped California become the fifth-largest economy in the world.
UC researchers also create and disseminate new knowledge through publications frequently cited by others, particularly in arts and humanities, economics, computer science, engineering, and medicine. As shown below, the impact of UC’s research publications is greater than both the global average of 1.00 and the average of its comparison Association of American Universities (AAU) peers in nearly every field.
The University of California is a major research presence at both the state and national levels, its research having greater impact than its peers and overall averages in nearly every field.
9.2.2 UC research publication performance, by Field-Weighted Citation Impact (FWCI) and discipline group, Universitywide, 2014 to 2019
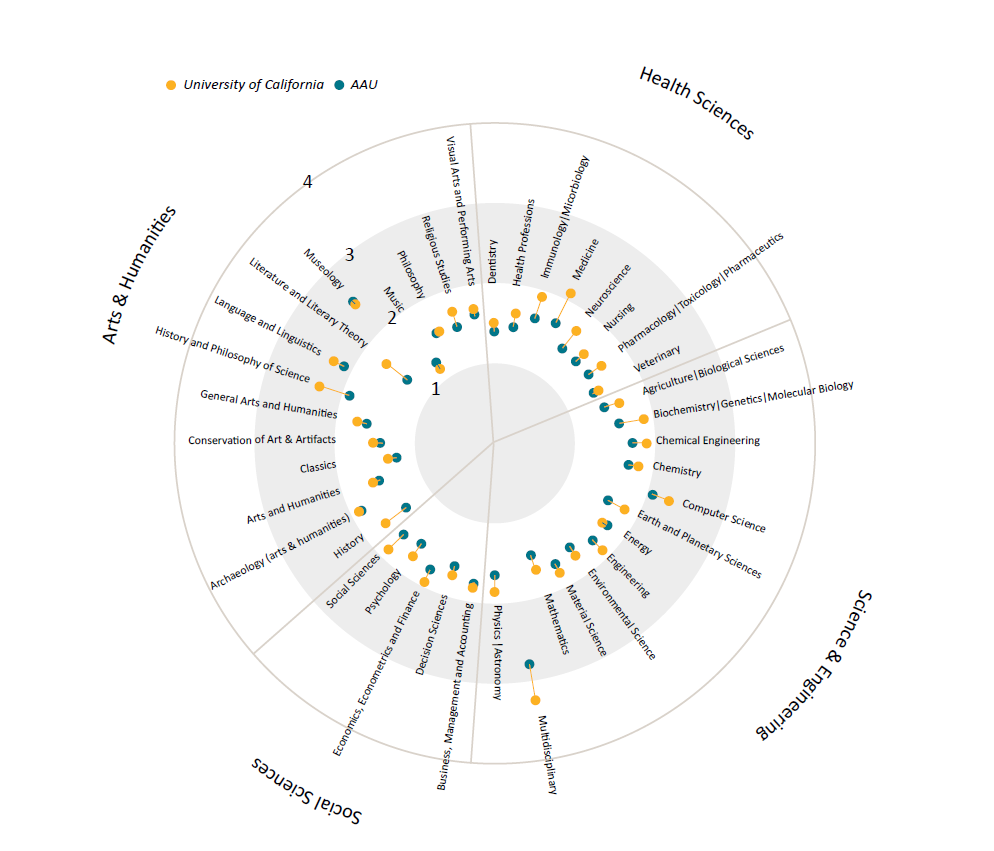
Source: SciVal® database, Elsevier B.V., scival.com (downloaded March 18, 2020)
The COVID-19 pandemic has impacts far beyond health care delivery across economic, social, and cultural issues. UC serves as California’s research powerhouse and think tank, providing multidisciplinary perspectives to inform these intersecting areas, such as expertise provided by:
- Business, economic, and public policy researchers on economic impact and recovery/reopening plans
- Public health and social welfare researchers on efficacy, usage, and impacts of telemedicine
- Data science and public health researchers on tracking cases to understand trends and differential impacts by race/ethnicity and other factors
- Arts and humanities, social science, and journalism researchers on how music and the arts create community during stay-at-home orders
- Education and psychology researchers on impacts of remote instruction on educational outcomes and student mental health
Charting a Course towards Normal Operations
The COVID-19 pandemic has had a significant impact on the state’s economy and businesses, including the University of California.
UC Health's medical centers are incurring substantial costs for surge expansion, surge staffing, development of testing capabilities, and other expenses. At the same time, revenues are down due to the cancellation of thousands of non-emergency procedures to prepare for a potential COVID-19 patient surge.
The extent of COVID-19 cost on UC operations is not known at this time. Between March and May 2020 alone these costs exceeded $1.54 billion for the University. The federal government has implemented a series of stimulus bills that by June 15, 2020 had provided UC with over $750 million towards COVID-19 related costs. However, since pandemic created expenditures continue to rise the full cost to the University will not be known for some time. Disruption to normal operations will place great financial strain on many aspects of the University’s operations. In addition, clinical operations have supported health professional schools in the past, but that revenue source is now constrained. In 2018-19, the health centers provided $606 million to support the health professional schools.
UC campuses are also looking to continue research operations, which can bring federal funding back into California, and to continue instruction in the fall for undergraduate and graduate students, though the University may need to continue to offer remote instruction.
As UC works to repopulate its campuses and continue critical research projects this fall, it is clear that University activities can accelerate California’s recovery from the fallout of the COVID-19 pandemic. Federal and state investments in UC are a key part of the equation. Together, UC and its governmental partners can address challenges resulting from the COVID-19 pandemic, support economic recovery efforts, and increase degree attainment to support California’s workforce needs.
Lifting up Women
The University of California was established on March 23, 1868, when California Gov. Henry Haight signed the Organic Act, setting in motion the audacious idea that California should have a great public university. In keeping with its egalitarian ideals, UC Regents in 1870 unanimously approved a resolution that “young ladies be admitted into the University on equal terms in all respects with young men” — a step many Ivy League colleges did not take for nearly another century.
The first women were admitted to the University in 1872, and the first woman, Rosa Scrivner, graduated with a Bachelor’s degree in Agriculture in 1874. Since then, hundreds of thousands of women have graduated from the University of California and thousands of female faculty, staff, and leaders have contributed to UC, California, and beyond.
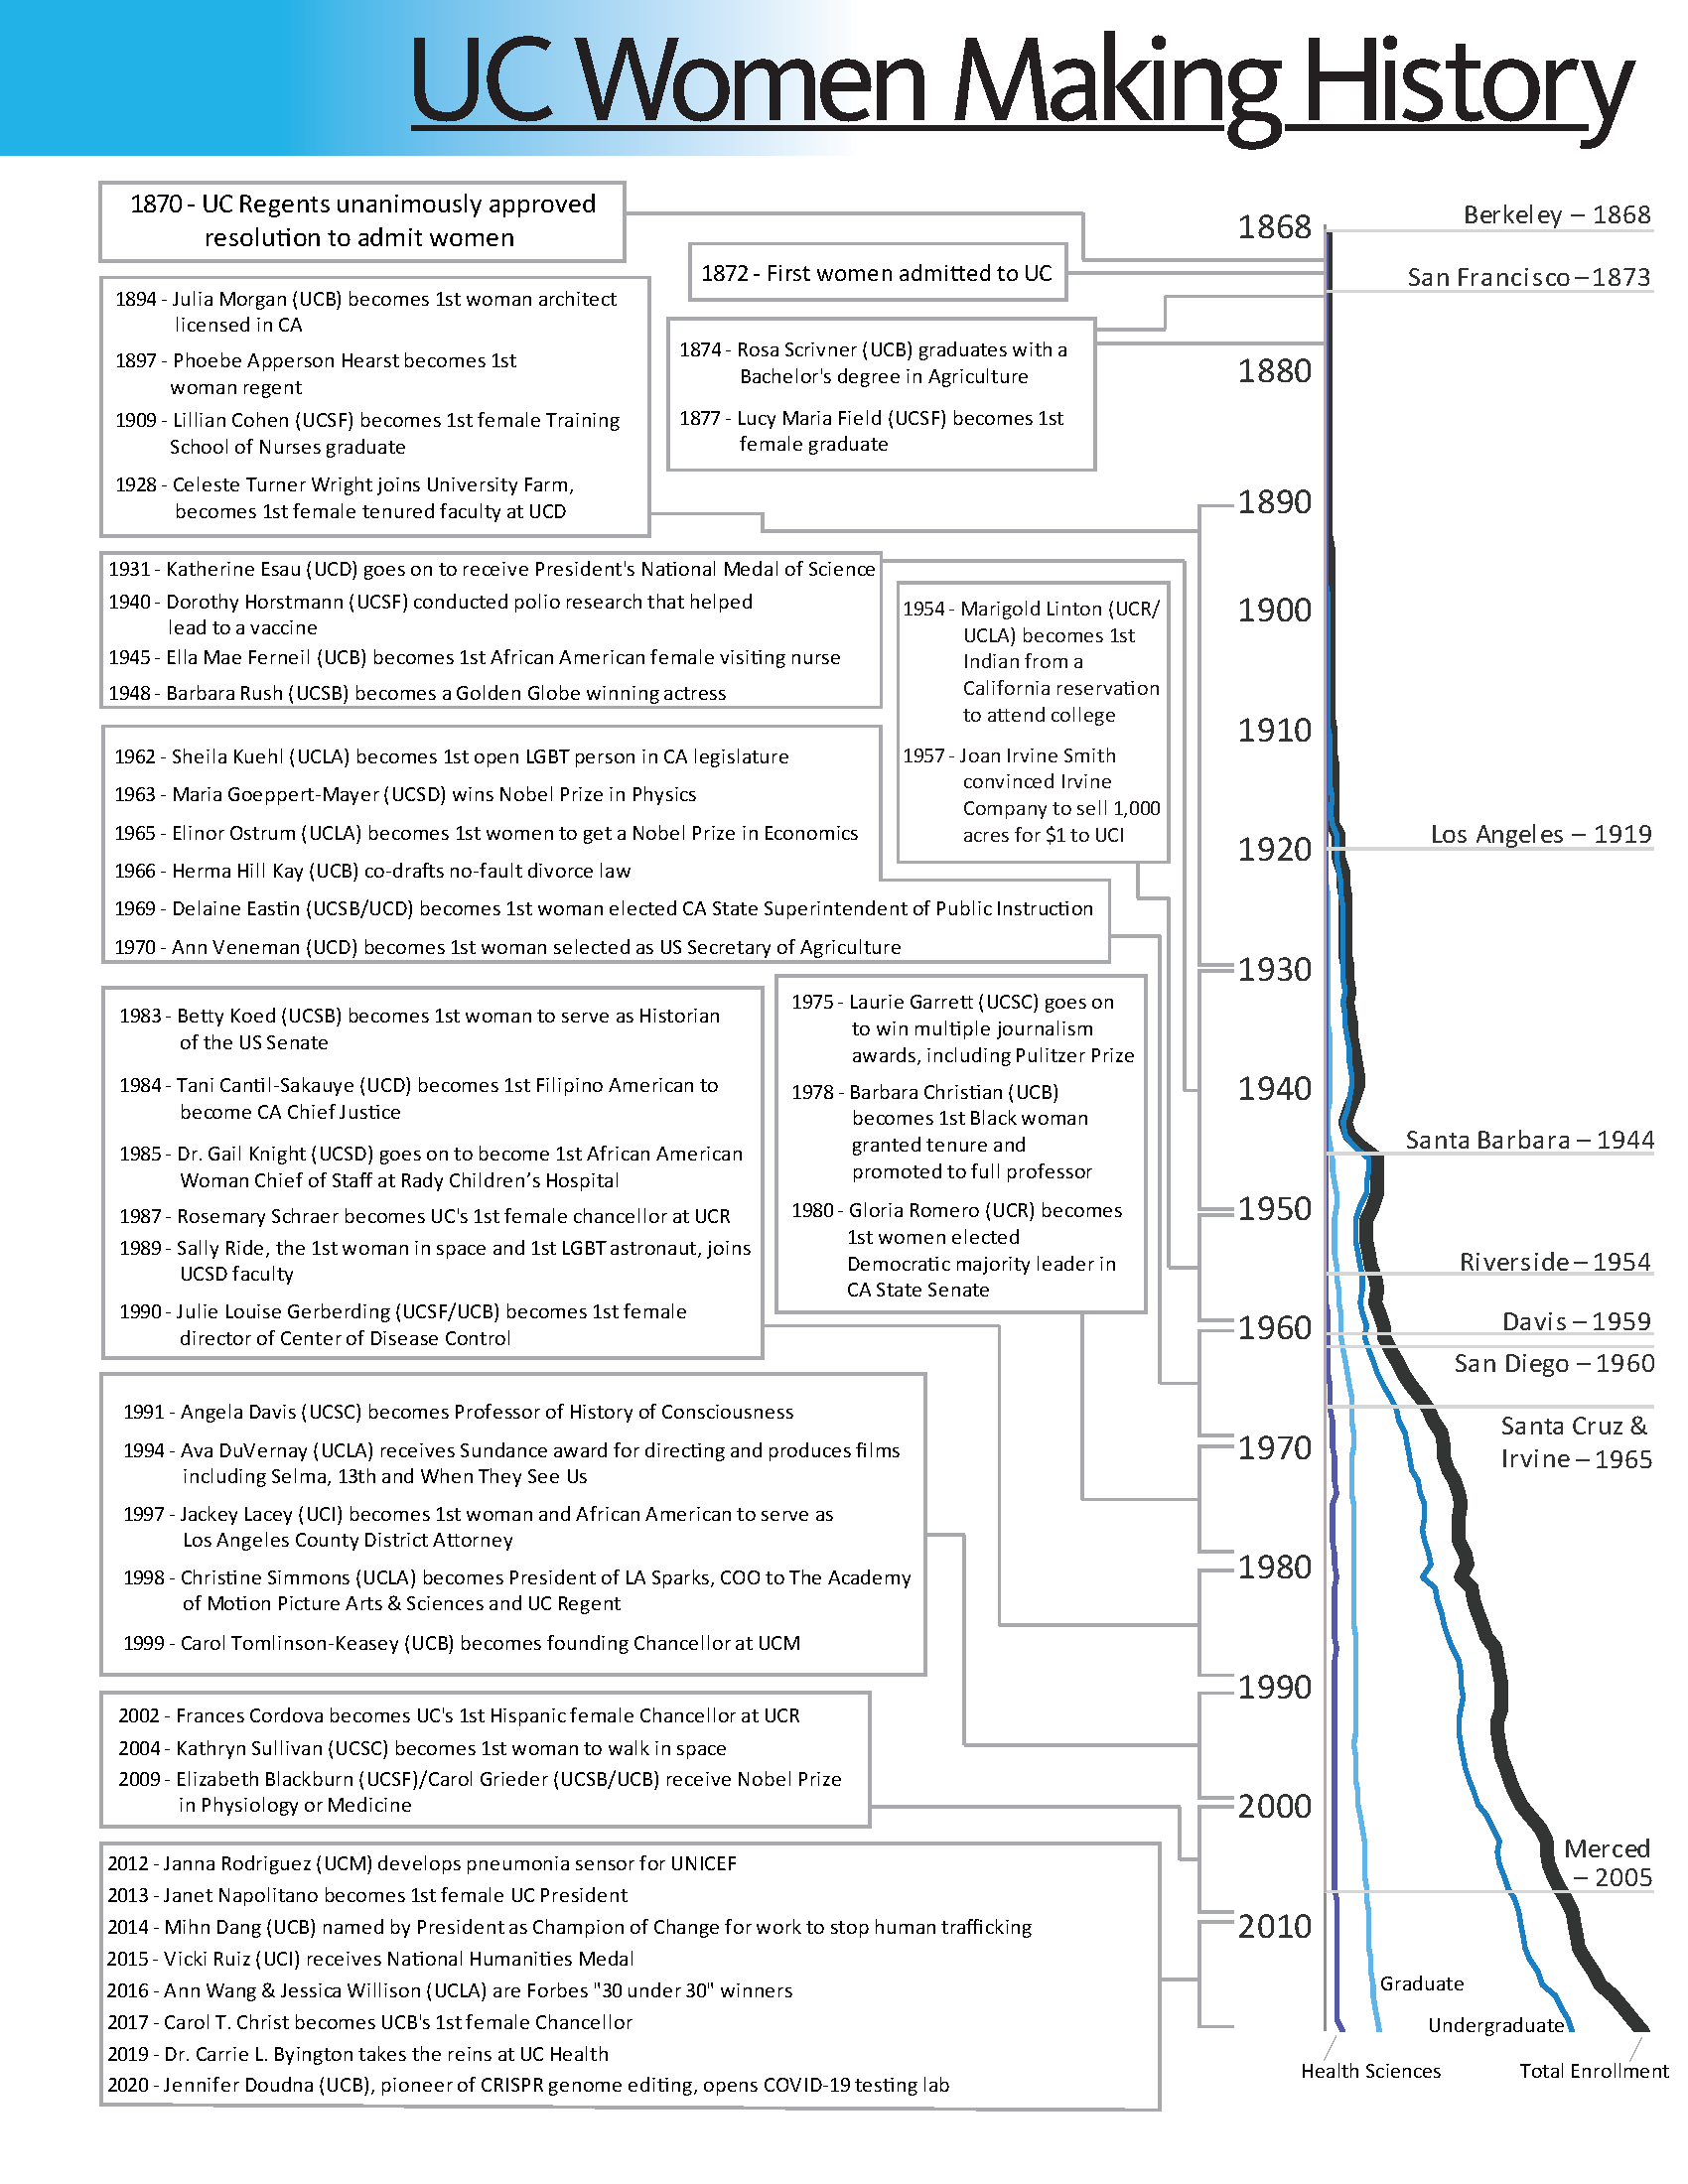
Women have served as UC Regents, Chancellors, Deans, and as a UC President. They span disciplinary fields and occupations, often the first to break the glass ceiling. They have received numerous honors, including the Nobel Prize, National Humanities Medal, Pulitzer Prizes, and Presidential Medal of Science. They have been elected to office, performed in the arts, and walked in space. UC women are playing influential roles in response to the pandemic, including leading UC Health and driving the research behind CRISPR gene-editing technology that holds promise for a COVID-19 vaccine. They teach, mentor, and inspire the next generation of women who will promote opportunities and discoveries to create a better tomorrow.
The following graphic highlights a handful of these contributions over time.
UC must continue to evaluate its own metrics in this area. Half of California’s population are women, with a higher proportion of women receiving bachelor’s degrees in Arts & Humanities, Life Sciences, and Social Sciences, and lower representation in Physical Sciences and Engineering & Computer Science. Across fields, the proportion of female Ph.D. graduates declines, or in the case of Engineering & Computer Science, remains low, though female representation in professional fields is higher. UC faculty — particularly ladder-rank equivalent (LRE) faculty — do not reflect the gender diversity of UC student populations, though the female share of new hires is above current LRE percentages.
Public high schools and UC student and faculty, percent female
|
UC Undergraduates |
UC Graduate Students |
UC Faculty |
|||||||||
|
12th graders |
Freshmen |
Transfers |
Bachelors |
Ph.D. Entrants |
Ph.D. Grads |
Prof Grads |
New Hires |
Ladder Rank |
Clinical/ Adjunct |
Lecturers |
|
| Arts & Humanities | 60% | 57% | 48% | 60% | 48% | 40% | 60% | ||||
| Engin & Comp Sci | 24% | 25% | 26% | 27% | 19% | 12% | 25% | ||||
| Life Sciences | 62% | 55% | 51% | 44% | 33% | 34% | 50% | ||||
| Physical Sciences | 41% | 31% | 30% | 26% | 23% | 36% | 43% | ||||
| Social Sciences | 63% | 54% | 52% | 53% | 45% | 31% | 53% | ||||
| Law | 54% | 40% | 49% | 52% | |||||||
| Medicine | 52% | 50% | 27% | 48% | |||||||
| Oth Health Sci | 71% | 50% | 61% | 55% | |||||||
| TOTAL | 50% | 60% | 51% | 54% | 44% | 41% | 58% | 44% | 35% | 48% | 51% |
Source: UC Accountability Report (7.1.2, 7.2.2, and 5.3.2), UC Information Center (Graduate Admissions, Degrees Awarded, and Workforce Diversity dashboard)
Gender diversity has increased steadily at all staffing levels; however, management and more senior positions remain less diverse. More than half of the managers and professional support staff employees are women. The percentage of women employees has grown steadily within the Senior Management Group (SMG), while Senior Professionals have nearly equal gender representation.
6.1.3 Gender diversity of non-student staff by personnel program, Universitywide, October 2009 to 2019
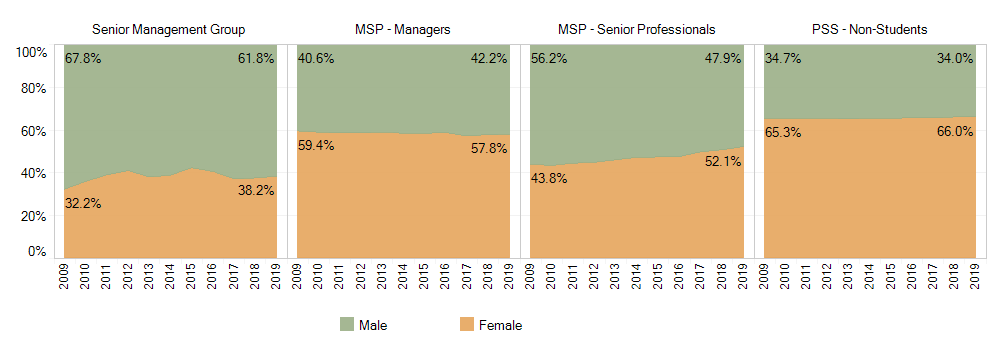
Source: UC Corporate Personnel System
UC 2030: Advancing the California Dream
The University of California established its multi-year framework — UC 2030 — with a three-point plan on how the University would strengthen California by:
- Producing over 200,000 additional degrees, on top of the one million undergraduate and graduate degrees currently projected
- Achieving 90 percent overall graduation rate and eliminating gaps for timely graduation and graduate degree attainment for Pell, first-generation, and underrepresented groups
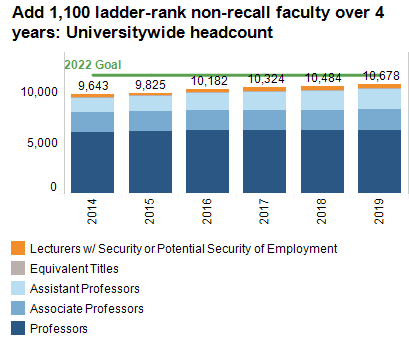
- Investing in the next generation of faculty and research by adding 1,100 ladder-rank faculty over the next four years
The University has not received state support to help achieve these ambitious goals and with expected budget shortfalls associated with COVID-19, it is unlikely UC will receive funding for this work in the near future. Nevertheless, it remains important for UC to track these outcomes because the goals are so essential to UC’s efforts to expand educational equity, to help California achieve its workforce goals, and to address some of the inequities and institutional racism exposed by COVID-19 and recent deaths of African Americans.
California is a majority-minority state with the largest segment of the public high school population being new generation students — that is low-income, first-generation, and from underrepresented groups. While underrepresented students comprise almost 60 percent of 12th graders and over three-quarters graduate, only 44 percent of Hispanic/Latinx and 40 percent of African Americans complete A–G. The May 2020 UC Board of Regents’ unanimous decision to phase out use of standardized tests and develop a new assessment more closely aligned to A–G eliminates existing barriers for underrepresented students and focuses on advancing college preparation within the classroom.
But even when underrepresented students enter the University of California, they take longer to graduate and are less likely to go on to graduate school. UC faculty do not reflect the racial/ethnic diversity of UC student populations, though the underrepresented share of new hires is above existing UC faculty percentages. UC 2030 goals are focused on ensuring UC students and the next generation of UC faculty better reflect the diversity of California, thereby broadening perspectives, approaches, and outcomes in teaching and research, and strengthening UC’s ability to address the challenges of tomorrow.
Public high schools and UC student and faculty, percent underrepresented
|
UC Undergraduates |
UC Graduate Students |
UC Faculty |
|||||||||
|
12th graders |
Freshmen |
Transfers |
Bachelors |
Ph.D. Entrants |
Ph.D. Grads |
Prof Grads |
New Hires |
Ladder Rank |
Clinical/ Adjunct |
Lecturers |
|
| Arts & Humanities | 36% | 13% | 14% | 21% | 16% | 14% | 12% | ||||
| Engin & Comp Sci | 15% | 8% | 6% | 14% | 7% | 3% | 6% | ||||
| Life Sciences | 23% | 16% | 12% | 15% | 8% | 10% | |||||
| Physical Sciences | 17% | 9% | 9% | 11% | 6% | 6% | 6% | ||||
| Social Sciences | 36% | 20% | 18% | 22% | 17% | 11% | 16% | ||||
| Law | 19% | 15% | 8% | 11% | |||||||
| Medicine | 21% | 17% | 7% | 8% | |||||||
| Oth Health Sci | 11% | 10% | 10% | 12% | |||||||
| TOTAL | 59% | 29% | 31% | 26% | 15% | 12% | 17% | 17% | 11% | 8% | 12% |
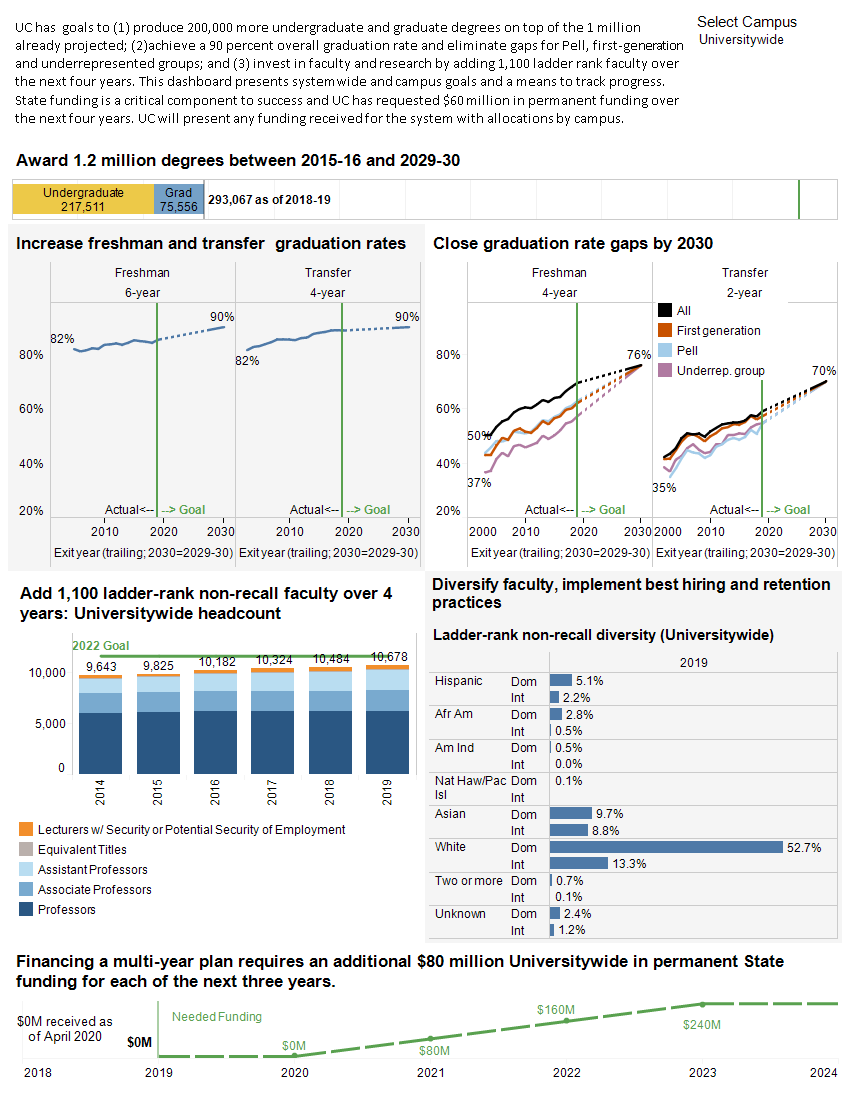
At the end of this executive summary is a dashboard displaying UC 2030 systemwide goals; listed below are relevant UC Accountability Report indicators, which set the baseline and highlight existing challenges and opportunities to achieve these goals.
Goal 1: Producing 200,000 more undergraduate and graduate degrees by 2030

The Public Policy Institute of California (PPIC) estimates that California will face a shortfall of 1.1 million workers with at least a bachelor’s degree between 2014 and 2030, in large part due to Baby Boomers leaving the workforce. The University of California has set a goal to add 200,000 degrees over the one million currently projected — or 1.2 million undergraduate and graduate degrees. Since 2015–16, UC has added over 293,000 undergraduate and graduate degrees or just over 24 percent of the 1.2 million total.
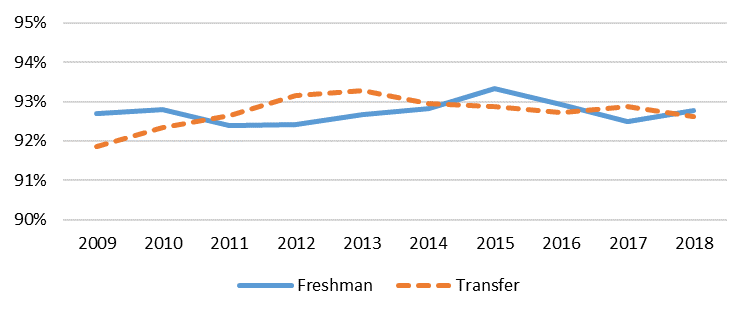
At the undergraduate level, much of this improvement will be made by increasing timely graduation, with all campuses proposing improvements that will yield a systemwide goal to increase four-year freshman graduation rates by eight points, from 68 percent to 76 percent, and two-year transfer graduation rates by 13 points, from 57 percent to 70 percent.
UC four-year freshman and two-year transfer graduation rates gained more than one point.
3.1.1 Freshman graduation rates, UC and comparison institutions, Cohorts entering fall 2013, 2014, and 2015; fall 2012 cohort for AAU comparison
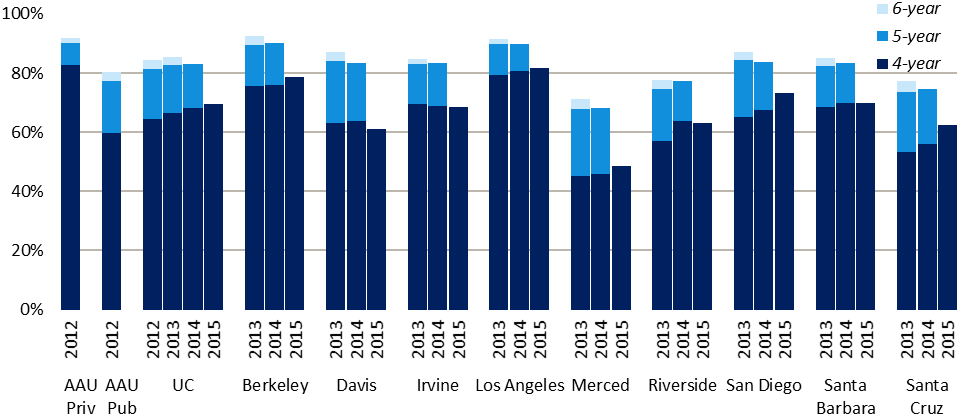
Source: UC Data Warehouse and IPEDS
3.1.3 Transfer graduation rates, Universitywide and UC campuses (fall 2015, 2016, and 2017 cohorts)
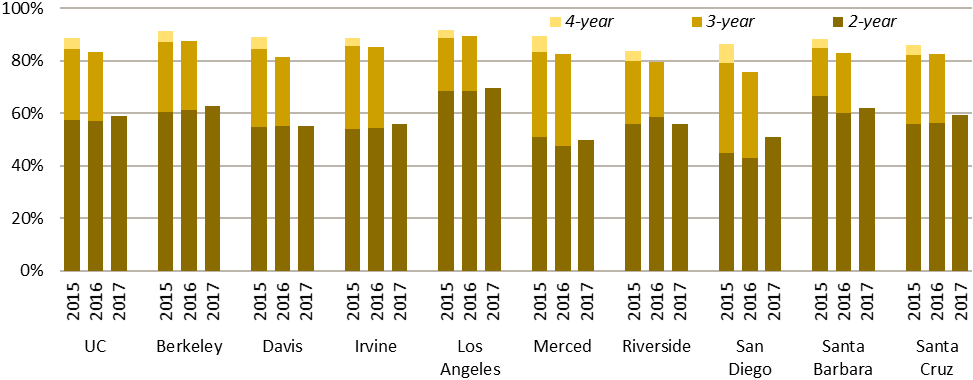
Source: UC Data Warehouse
Of the additional 200,000 degrees UC will produce, over 40,000 will be graduate degrees, and this growth will primarily be achieved through increased graduate enrollment across the system. Not only will this growth support degree attainment goals, it will increase the share of graduate students across the system, currently at 21 percent, compared to 27 percent for non-UC Association of American University (AAU) public institutions, and 56 percent for AAU private institutions (4.2.1). This graduate growth will also support both undergraduate degree attainment through teaching and mentorship, while advancing UC research activities.
Graduate enrollment, as a share of UC’s total undergraduate and graduate enrollment, has declined slightly and remains well below comparable institutions.
4.2.1 Graduate enrollment share of total, Universitywide, Fall 2000 to Fall 2019
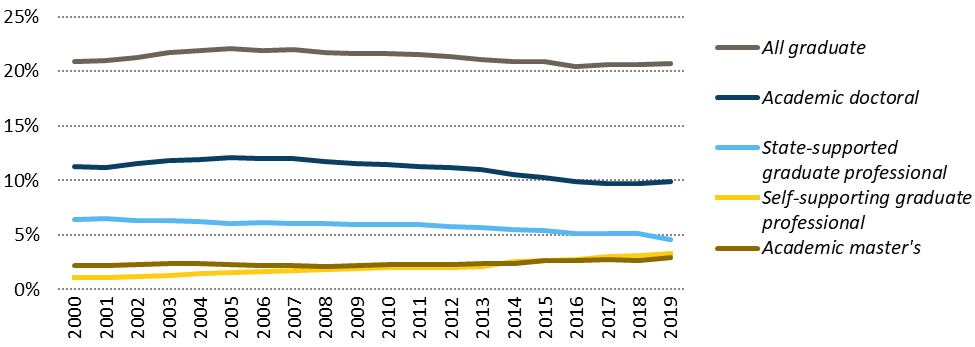
Source: UC Corporate Student System. Academic master’s students include post-baccalaureate, teaching-credential students. Graduate professional includes professional master’s (e.g., M.B.A., M.Ed.) and professional practice (e.g., J.D., M.D.) degrees.
Goal 2: Ensuring the California Dream is for everyone
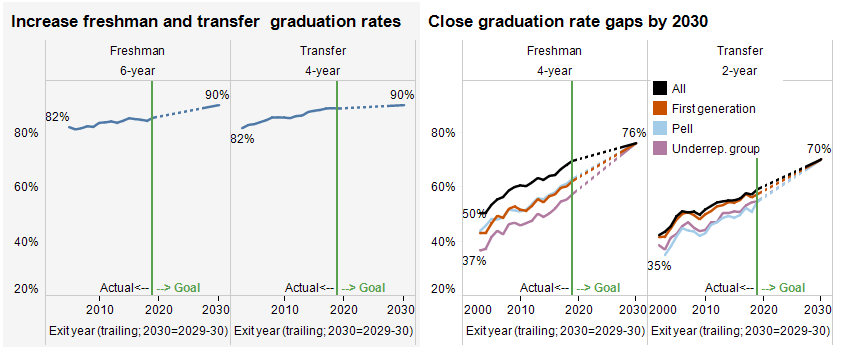
The emphasis of this goal is two-fold: ensuring that nine out of ten freshman and transfer entrants leave UC with a degree, and eliminating timely graduation gaps for first-generation, Pell grant, and underrepresented students.
Over the last 15 years, UC graduation rates have improved, particularly four-year freshman and two-year transfer graduation rates. However, UC has been unable to close gaps in timely graduation for Pell, first-generation, and underrepresented groups, particularly for freshman entrants. UC is seeking to eliminate double-digit gaps in timely graduation rates for Pell, first-generation and underrepresented students.
UC’s gap in timely graduation for Pell and non-Pell recipients decreased by one point for freshmen and four points for transfers.
3.1.6 Freshman graduation rates by Pell Grant recipient status, Cohorts entering fall 2013, 2014, and 2015
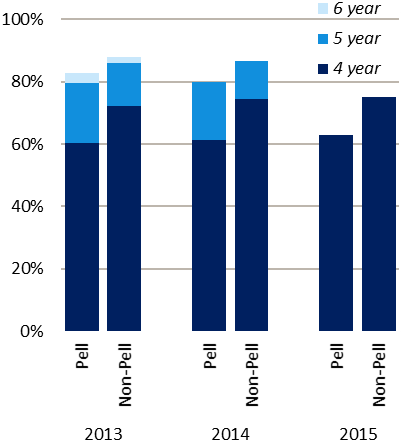
3.1.7 Transfer graduation rates by Pell Grant recipient status, Cohorts entering fall 2015, 2016, and 2017
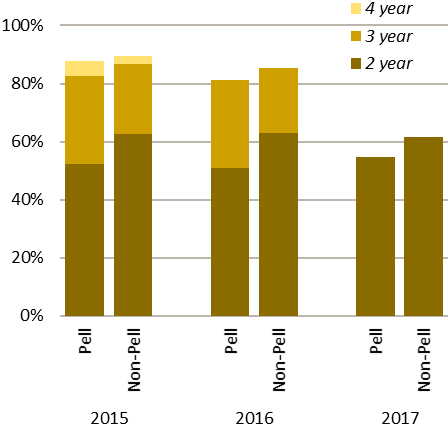
Source: UC Data Warehouse. Pell Grant recipients are those who received a Pell Grant at any point during their time at UC.
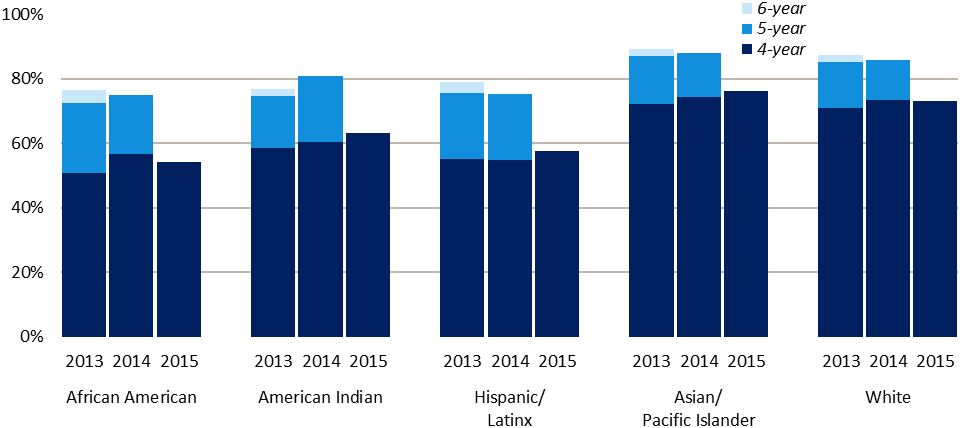
UC’s gap in four-year graduation rates dropped by one point for underrepresented students compared to Asian and White peers, though the gap is still around 18 points and grew for African American students.
3.1.4 Freshman graduation rates by race/ethnicity, Universitywide, AAU public, and AAU private, Cohorts entering fall 2013, 2014, and 2015
One challenge to achieving these ambitious goals is a recent decline in first-year retention rates, around half a percentage point for freshman and a point for transfer entrants. First-year retention has dropped even further for freshman entrants who are underrepresented (two percentage points), Pell grant recipients (two percentage points), and first-generation (one percentage point), exactly the populations UC is targeting to eliminate graduation gaps. These data highlight that UC is likely to see a drop in graduation rates for these cohorts.
Freshman and transfer retention rates are high, but a recent decline forecasts likely drops in graduation rates.
3.2.1 First-year retention rates, UC systemwide, Cohorts entering fall 2008 to fall 2017
Source: UC Data Warehouse
Goal 3: Investing in the next generation of faculty and research
While much of the funding for UC research comes from the federal government, a primary way California promotes UC research activity is through state support for faculty. Campuses estimated what they would need to achieve goals in the multi-year framework. Based on that input, the University has set a goal to add 1,100 net new faculty over the next four years. Over the last year, UC added just under 200 faculty.
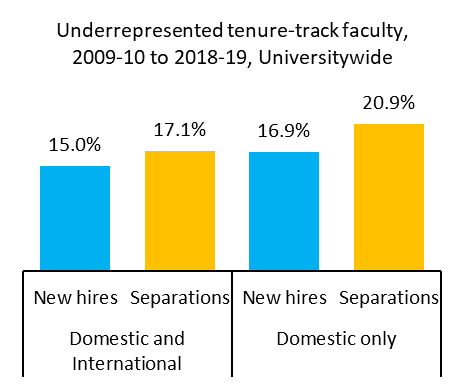
While many of the UC 2030 goals may take a decade to achieve, the goal to grow faculty is currently limited to the next four years. In part, this will help UC assess its efforts to further diversify the faculty, which in turn will support student outcomes and benefit UC research. UC’s recent hires are more diverse than existing faculty and they meet or exceed national availability pools of recent Ph.D. graduates (5.3.1).
UC’s hiring of underrepresented and female faculty overall exceeds or meets the national availability of doctorates, with variation among discipline groups.
5.3.1 Underrepresented* new assistant professors compared with national availability by discipline group, Universitywide, 2015–16 to 2018–19
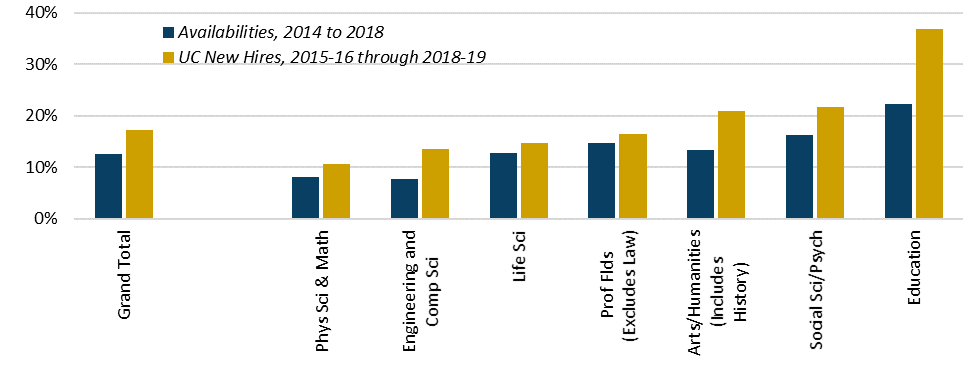
* Underrepresented includes those who identify as Black/African American/African, Hispanic/Latinx, and American Indian/Native American.
5.3.2 Women new assistant professors compared with national availability by discipline group, Universitywide, 2015–16 to 2018–19
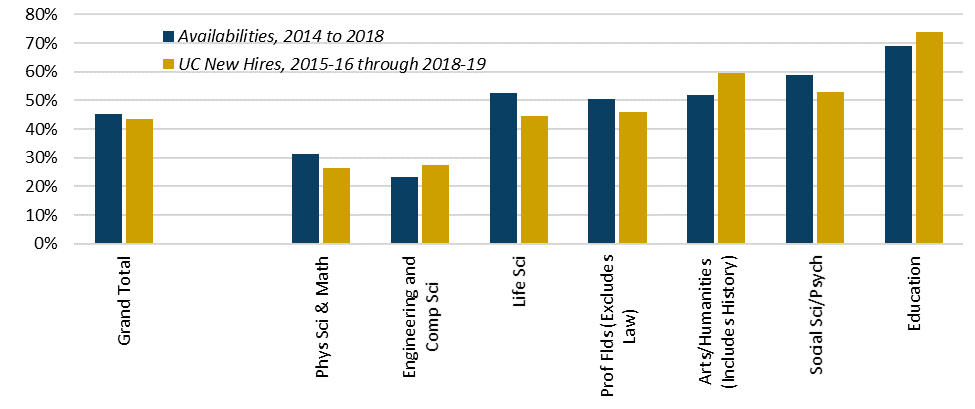
Source: UC Academic Personnel and Program Administration and Survey of Earned Doctorates
UC 2030 dashboard
This dashboard highlights key goals of the UC 2030 framework and can be accessed online.
Dashboard Notes and Data Sources
Degrees Awarded include the leading summer and the full academic year.
Graduation rates are based on entering cohorts but labeled by the exit academic year, which is a leading year. For example, the six-year graduation rate for 2017 in the graph reflects students who entered in fall 2012 and graduated in the 2017–18 year (including the trailing summer).
Ladder-rank non-recall faculty are October payroll snapshot headcounts.