Overview
The three-pronged mission of the University of California includes teaching, research, and public service, none of which can be accomplished without the support of staff who organize and facilitate all that is required to do the work of the University. Despite the operational and financial challenges created by the COVID-19 pandemic in 2020 and 2021, UC employees quickly rose to the challenge of engaging in the University’s mission of teaching, research, and service in a remote environment. Recognizing the challenges faced by employees, the University of California adopted numerous programs and exceptions to policy providing flexibility to the staff to conduct their work.
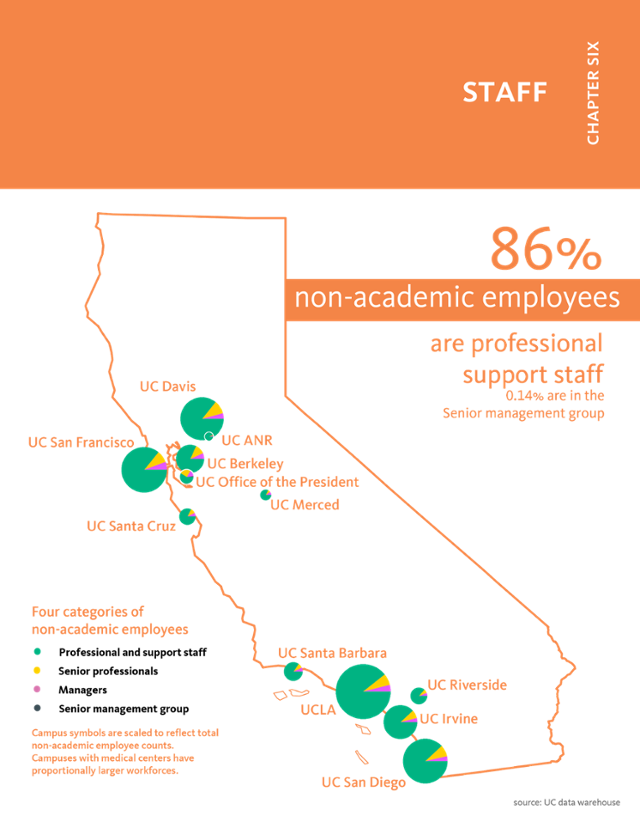
Non-academic staff employees constitute nearly 70 percent of UC’s workforce and are responsible for health services, student services, instruction and research support, compliance, and general administration (6.1.1). In October 2020, this group included 143,188 individuals. Overall, this staff workforce represented over 115,577 full-time equivalent (FTE) employees in that month.
Staff workforce
- About six out of every ten UC staff FTE are working for the University of California Health system. These frontline workers (including doctors, nurses, administrators, technicians, and allied health professionals) are playing a critical role in California’s response to the COVID-19 pandemic. Over 97 percent of these employees are supported by non-core funds, typically the revenues generated by hospital services.
- Students often work part-time on campus as part of their financial aid packages or for research experience. During the pandemic, UC campuses transitioned to remote instruction. With staff, faculty, and students no longer on campus, student employee headcount at general campus halved from 36,000 in October 2019 to 18,000 in October 2020.
- General campus, non-student employees are the remainder of the University’s staff, at 43,752 FTE. This includes student services employees, career advisors, IT specialists, research administration, laboratory staff, food and auxiliary service workers, accountants, maintenance and janitorial staff, safety workers, and analysts (6.1.1).
diversity
The University of California is committed to diversity and excellence in its staff workforce. Staff at UC are majority women and increasingly ethnically diverse across all personnel groups (6.1.2). However, there are variations among the different employee groups, with less diversity and women representation among senior positions. A more diverse academic and staff population is an increasingly important attribute of a thriving public research university system.
Staff compensatioN
Over the past decade, UC has relied less on core funds (State funds, tuition and fees, and other general funds) to cover the staff payroll. While UC has about 19,300 more staff FTE than ten years ago — largely due to University of California Health and student staff growth — fewer FTE are paid on core funds (6.2.1). Just over 18 percent of staff are paid using core funds.
General campus career staff salaries have stayed relatively flat compared to inflation for the past decade and have increased modestly for some University of California Health professionals. Staff salaries tend to lag behind comparable market positions, and the lack of increases beyond inflation could affect staff satisfaction and turnover (6.2.2, 6.2.3). Chancellor compensation falls on the lower end when compared to the peer institutions (6.2.4).
Staff separations and satisfaction
UC’s separation rate among career staff is about 7.7 percent (6.3.1), which is lower than it has been in a decade. More than 23 percent of staff separations are due to retirement and reflect the baby-boomer generation exiting the workforce. Still, a large portion of separations is due to resignation to accept another job, to move out of areas, or for other reasons (6.3.2). The 2019 Council of University of California Staff Assemblies (CUCSA)/Systemwide Human Resources Engagement Survey shows some improvement since 2017 in organizational change, communication, and sustainable engagement, but that UC is still below the national norm in eight out of nine employee satisfaction categories. While voluntary separation is often influenced by a combination of factors, employee satisfaction can give us a window into the areas that might be contributing to the loss of employees to other organizations or geographic areas.
UCPath Deployment
UCPath is the University of California’s new, modernized human resources, academic personnel, benefits, and payroll system for all UC employees systemwide. The systemwide deployment of UCPath was completed in June 2020.
For more informatioN
University of California Health staff has grown significantly as health services have expanded, while general campus, non-student support staff growth has lagged behind overall student enrollment over the past decade.
6.1.1 Staff Full-time Equivalent (FTE), Universitywide, October 2011 to 2020
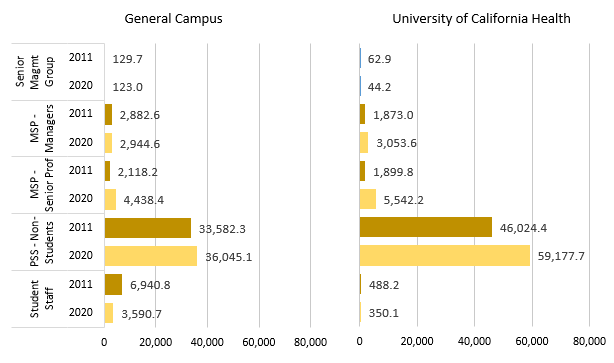
Source: UC Corporate Personnel System
* In 2017 and 2018, several job titles were reclassified between MSP and PSS groups. Excludes Lawrence Berkeley National Laboratory, Hastings School of the Law, and Associated Students UCLA.
UC operates six health systems with five academic medical centers as well as schools of medicine, dentistry, nursing, and other health sciences education and research programs. Nearly 59 percent of UC non-academic staff FTE work for the University of California Health system. These frontline workers (including doctors, nurses, administrators, technicians, and allied health professionals) are playing a critical role in California’s response to the COVID-19 pandemic. The growth of University of California Health FTE is also driven by service expansions, such as increases in inpatient days as well as outpatient/emergency visits.
General campus, non-student staff has seen the greatest growth amongst senior professionals, due to both the introduction of Career Tracks and the professionalization of UC’s workforce towards high-skilled analysis and technical capabilities. Career Tracks is a function-specific, market-aligned job classification system that applies consistent interpretations of which positions are Management and Senior Professional (MSP) and which are Professional and Support Staff (PSS). Within PSS, there has been a significant shift away from clerical roles into student services positions and administrative analysis to manage growing campuses and student bodies.
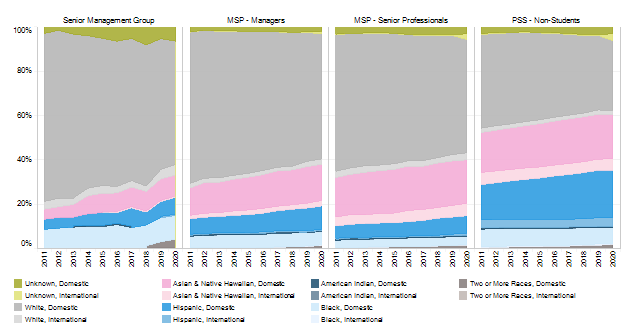
The proportion of underrepresented staff has grown modestly at all levels in the last decade. Representation of women has grown at the Senior Professional levels, and has stayed high at the Manager and Support Staff levels.
6.1.2 Racial/ethnic diversity of non-student staff by personnel program, Universitywide, October 2011 to 2020
6.1.3 Gender diversity of non-student staff by personnel program, Universitywide, October 2011 to 202020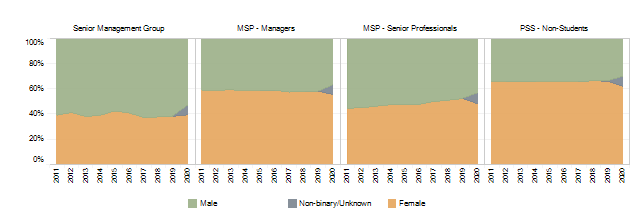
Source: UC Corporate Personnel System
UC has sought to improve representation of historically underrepresented domestic racial/ethnic groups. Diversity has increased steadily at all staffing levels; however, management and more senior positions remain less diverse. More than half of the managers and professional support staff employees are women. The percentage of women employees has remained steady within the Senior Management Group (SMG), while Senior Professionals have nearly equal gender representation. As a result of the California Gender Recognition Act (SB-179), UC recently revised self-reporting options for gender identity and sexual orientation.
In last decade, the number of staff supported by core funds has fallen as State funding for the University has decreased. Non-core funds supported all of the increases in University of California Health and non-student, general campus staff FTE over the same time.
6.2.1 Non-student staff FTE by fund source, General campus and UC Health, October 2011 and 2020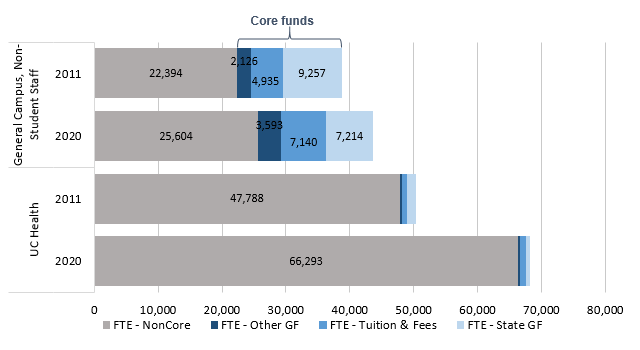
Source: UC Corporate Personnel System
General campus employees are increasingly paid with non-core funds such as research funds, auxiliary revenues, and other sources. Though overall general campus staff increased modestly, overall core-funded staff has decreased. Overall core-funded staff has decreased by over 2,700 in the last ten years. This more than offsets the increases in staff funded by tuition and fees as well as other general funds.
University of California Health almost exclusively relies on non-core funds, particularly from hospital revenues, to support its staff. Despite adding about 17,800 FTE, even fewer FTE today are paid on core funds than a decade ago.
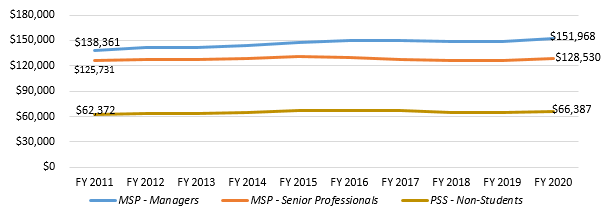
Over the past decade, inflation-adjusted salaries have been relatively flat for general campus staff, with moderate increases for some University of California Health staff.
6.2.2 General campus career staff average inflation-adjusted base salaries by personnel program, FY 2011 to 2020
6.2.3 University of California Health career staff average inflation-adjusted base salaries by personnel program, FY 2011 to 2020
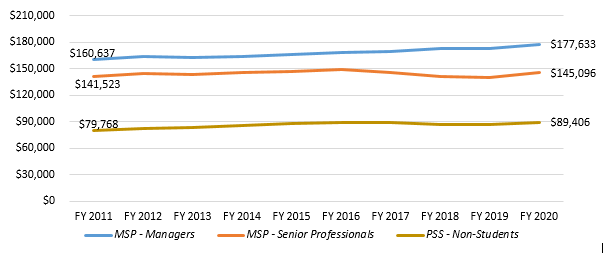
Source: UC Corporate Personnel System; California CPI-W used for inflation adjustment
Over the past ten years, salaries in inflation-adjusted dollars have increased modestly for general campus career Support Staff, Managers, and Senior Professional staff. At the same time, UC employees are contributing more to their health care costs and to the UC retirement system, putting downward pressure on the competitiveness of UC’s total compensation compared with the regional labor markets where University centers are located.
Salaries among University of California Health career staff have been increasing moderately in real dollars for Professional and Support Services (PSS) staff and for Managers. This reflects market trends in wages for hospital staff and growing demand for health care professionals.
UC chancellors are among the lowest-paid when compared to their Association of American Universities (AAU) peers.
6.2.4 Base salaries and additional pay for UC and AAU institution leaders
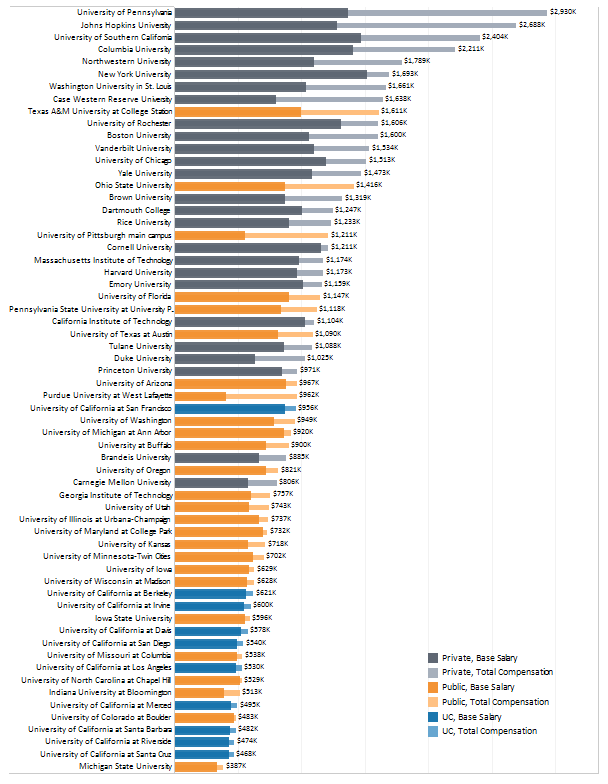
Source: The Chronicle of Higher Education Executive Compensation Report and institutional data sources
UC chancellors continue to be among the lowest-paid university leaders compared with their AAU peers. Nine UC chancellor salaries fall among the lowest third in this group. UC San Francisco, an exclusively graduate health science campus, is the only exception.
In response to the COVID-19 pandemic and reduction in UC revenues, the UC President and UC Chancellors voluntarily agreed to reduce their salary by ten percent.
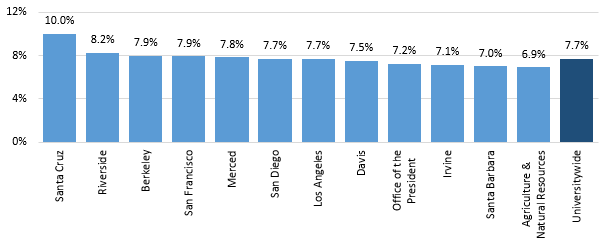
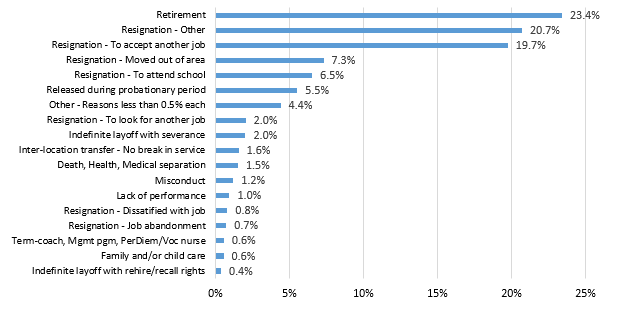
The separation rate among staff was about 7.7 percent in FY2020, down from nine percent in the previous fiscal year. Retirement is the leading reason for separation.
6.3.1 Separation rates for career staff by campus and overall, FY 2020
6.3.2 Separation reasons for career staff, FY 2020
Source: UC Corporate Personnel System
Campuses experience a wide range of separation rates among their career staff, which may reflect different mixes of employees, work environments, and local job markets. High turnover is often expensive in terms of lost productivity, lost institutional knowledge, and replacement costs.
Over 23 percent of separations were due to retirement, a result of the aging baby-boomer population. About 58 percent of separations were resignations, 27 percent of those are due to people moving away or choosing to attend school.