Chapter 1:
UNDERGRADUATE STUDENTS: ADMISSIONS and ENROLLMENT
INCREASING ADMISSIONS OPTIONS, WORKING TOWARD uc'S 2030 ENROLLMENT GOAL
UC has proposed growing California resident undergraduate enrollment by 17,000 to 23,000 between 2020–21 and 2029–30, while keeping nonresident enrollment about the same. Over the first two years of this period, California resident enrollment during the academic year went up by 2,000 while summer enrollment went down by 5,000. To meet legislative expectations for growth, UC plans to increase California resident full time equivalents (FTE) by 8,000 in 2023–24 compared to 2021–22. Then, to reach the 2029–30 goal UC will need to grow by an average of 2,000 FTEs per year.
One of the university’s highest priorities is to ensure that a UC education remains accessible to all Californians who meet the admissions standards. This goal is articulated in California’s Master Plan for Higher Education, which calls for UC to admit all eligible freshmen and transfers, with freshman eligibility designed to capture the top 12.5 percent of California public high school graduates. Campus admission decisions are based on a comprehensive review of qualifications and establish the incoming California-resident class size based on state funding.
The rapid growth in freshman applications to UC from 48,800 in 1994 to 211,000 in 2022 demonstrates the increased demand for a college education, the growth of California’s population, and UC’s continued desirability. UC continues to meet its Master Plan goals of guaranteeing admission to California resident applicants who are either in the top nine percent of high school graduates statewide or the top nine percent of graduates from their own high schools. Qualified freshman applicants are offered an opportunity to be admitted to another UC campus if they do not receive an offer of admission from any of the UC campuses where they applied.
Consistent with UC’s commitment to transfer students from California Community Colleges (CCCs), fall enrollment of new CCC California resident transfers more than doubled since 1994, from 8,400 to 19,600. Almost all transfer students enter UC at the upper-division level with junior status. Campus enrollment targets are based on state funding as well as capacity in major programs. Transfer applicants, admits, and enrollees dropped sharply in fall 2022 as CCC enrollments declined. This has made it difficult for some UC campuses and the UC system overall to achieve the goal of enrolling one new California resident transfer for every two new California resident freshmen.
UC Transfer Pathways (UCTPs) identify a common set of lower-division courses for each of 20 of the most popular majors. UCTPs present a roadmap for prospective transfers to prepare for their majors and be well positioned to graduate in a timely fashion from any UC campus. Expanding on the campus-based Transfer Admission Guarantees (TAGs), Pathways+ is an option for those who want both secure guaranteed admission to a TAG campus in a particular major, while also preparing for admission to all campuses with that major. For more information, see the UC Admissions' Transfer programs webpage.
UC has proposed a new systemwide transfer guarantee so that any California resident who completes the California General Education Transfer Curriculum (Cal-GETC) requirements, completes a UC transfer pathway, and meets a minimum college GPA threshold will be guaranteed a place at one of the UC campuses. Applicants meeting these requirements who do not get admissions offers from campuses of their choice will have the option of attending UC Santa Cruz in the northern part of the state, UC Merced in the center, or UC Riverside in the south.
This remainder of this chapter provides indicators in four areas:
- Section 1.1: Applicants, admits, and enrollees
- Section 1.2: Demographic outcomes
- Section 1.3: Preparation outcomes
- Section 1.4: Geographic origins and nonresidents
Demand for UC admission from freshman remains high with over 211,000 applicants.
1.1.1 Freshman applicants, admits, and enrollees, Universitywide and UC campuses, Fall 1994 to 2022
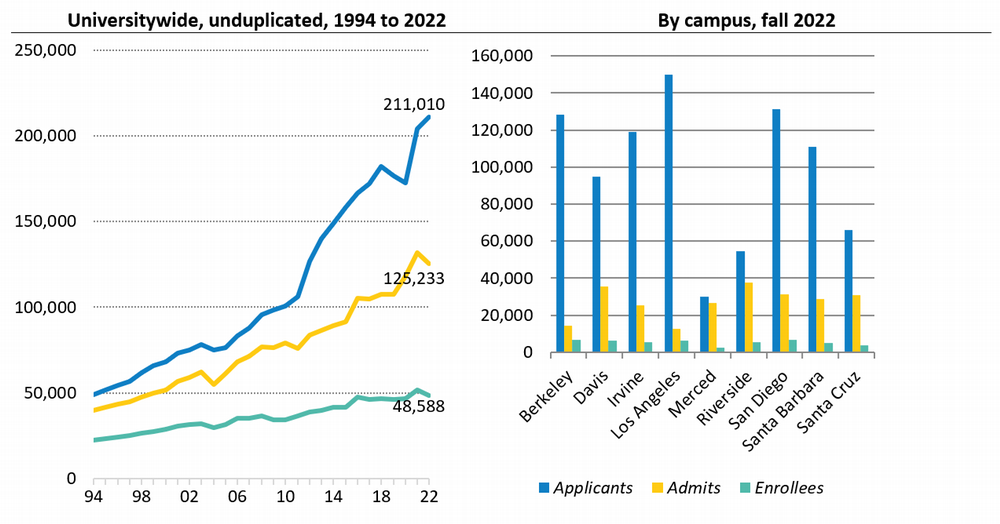
Source: UC Data Warehouse1
After a large increase in 2021, unduplicated freshman applicants increased at a smaller rate of four percent from 2021 to 2022 to a record high of over 211,000. Total growth from 2012 to 2022 was about 85,000 applicants, including about 39,000 California residents.
In fall 2022, most campuses admitted less than half of freshman applicants. Freshman applications increased at all campuses, and applicants applied to an average of 4.2 campuses.
The Undergraduate admissions summary dashboard at the UC Information Center presents data tables on UC freshman applicants, admits, and enrollees by campus over time.
1 Admits and enrollees here include applicants guaranteed admission who are not offered admission at a campus to which they applied but who are referred to and admitted by another campus. Some campuses admit fall applicants for a subsequent term (winter or spring). These “rollover” admits and enrollees are excluded in this indicator. Students who apply to multiple UC campuses are counted only once in the Universitywide indicator. A change in accounting for referral students is responsible for the apparent drop in 2011 admits. Beginning that year, UC Merced admitted only students who indicated interest in a referral offer, rather than every student who qualified for an offer.
Transfer applicants declined in 2022, dropping to 40,688.
1.1.2 Transfer applicants, admits, and enrollees, Universitywide and UC campuses, Fall 1994 to 2022
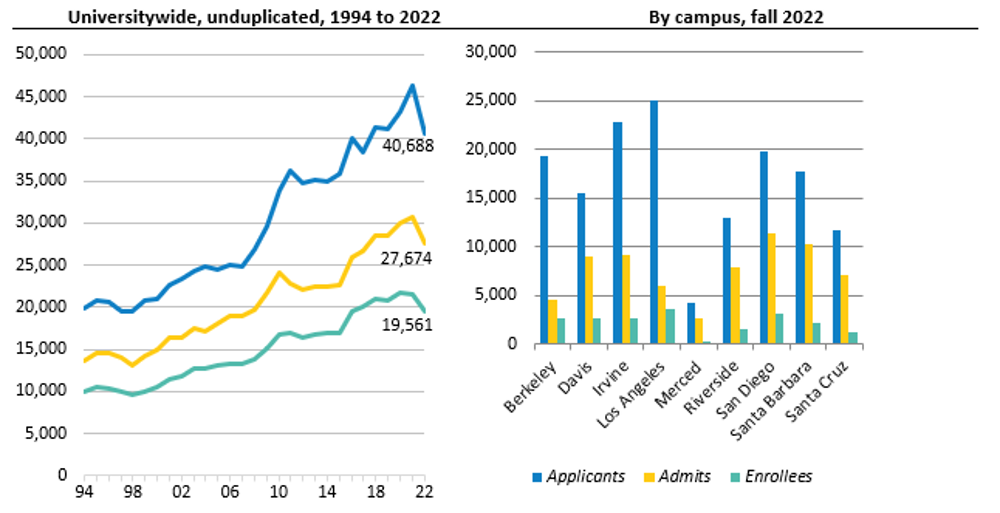
Source: UC Data Warehouse1
Transfer applications decreased by 12 percent and admits decreased by ten percent, while enrollees decreased by nine percent in fall 2022 compared to 2021. Almost all transfer enrollees (93 percent%) came from California Community Colleges (CCCs). On average, transfer applicants applied to 3.7 UC campuses.
The Undergraduate admissions summary dashboard at the UC Information Center presents data tables on UC transfer applicants, admits, and enrollees by campus over time.
UC did not meet the 2:1 goal of resident freshman to transfer enrollees in 2022–23 due to pandemic challenges that resulted in a decline in transfer enrollees.
1.1.3 New California resident freshmen and transfer students, Universitywide, 2008–09 to 2022–23
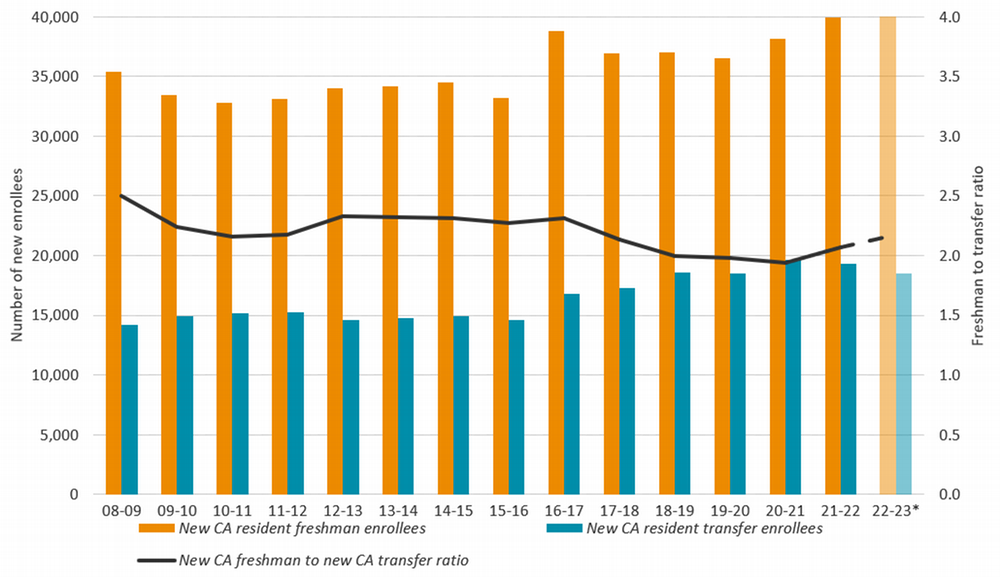
Source: UC Data Warehouse and UC campuses1
The California Master Plan calls for UC to accommodate all eligible resident California Community College (CCC) transfer students. It specifies that the University maintain at least a 60:40 ratio of upper-division (junior and senior) to lower-division (freshman and sophomore) students to ensure adequate upper-division spaces for CCC transfers. To do so, UC aims to enroll one new California resident transfer student for every two new California resident freshmen, or 67 percent new resident freshmen to 33 percent new resident transfer students.2 UC moved from 2.3:1 in 2016–17 to 1.9:1 in 2020–21 before increasing slightly the last two years to an estimated 2.2 in 2022–23 (Universitywide). The UC system and several UC campuses did not meet 2:1 in 2022–23 due primarily to decreases in new transfer enrollees as the CCCs experienced declines in enrollment.
|
2022–23*
|
% New CA resident freshmen
|
% New CA resident transfers
|
Ratio of new CA freshmen to new CA transfers
|
|
Berkeley
|
68%
|
32%
|
2.1
|
|
Davis
|
66%
|
34%
|
1.9
|
|
Irvine
|
67%
|
33%
|
2.0
|
|
Los Angeles
|
60%
|
40%
|
1.5
|
|
Merced
|
90%
|
10%
|
8.9
|
|
Riverside
|
76%
|
24%
|
3.2
|
|
San Diego
|
66%
|
34%
|
2.0
|
|
Santa Barbara
|
67%
|
33%
|
2.1
|
|
Santa Cruz
|
73%
|
27%
|
2.7
|
|
Universitywide, all campuses
|
68%
|
32%
|
2.2
|
|
Universitywide, excl. Merced
|
67%
|
33%
|
2.1
|
UC’s fall undergraduate headcount was just over 230,400 in fall 2022.
1.1.4 Undergraduate headcount enrollment, Universitywide and UC campuses, Fall 2008 to 2022
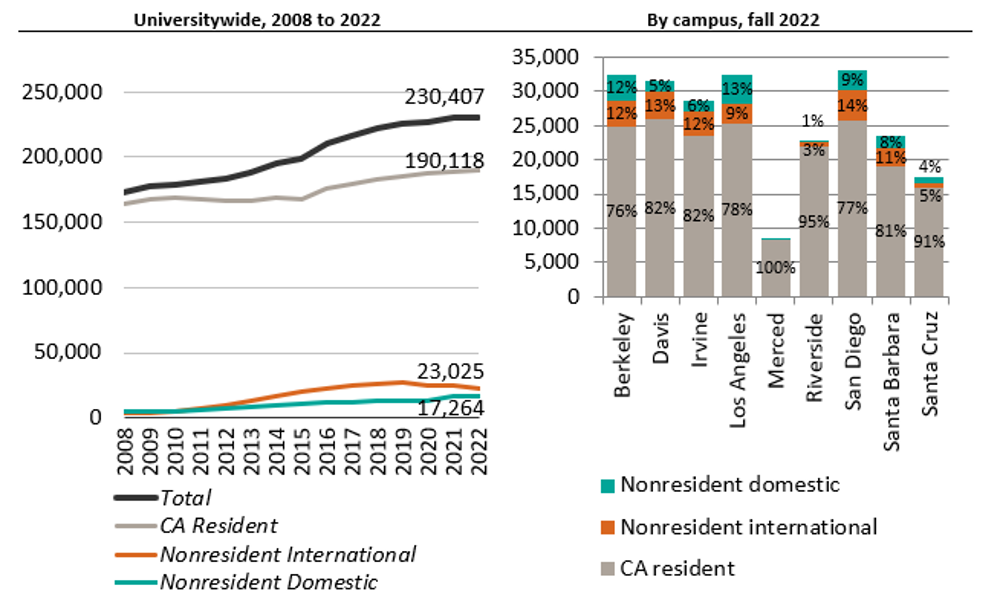
Source: UC Data Warehouse
The University and the state share the goal of expanding access to a UC education. The University enrolled over 700 additional California residents in fall 2022 compared to fall 2021, with a total increase of almost 22,000 California resident undergraduates since fall 2015.
Percentages are rounded so don't always total 100%.
1.1 APPLICANTS, ADMITS AND ENROLLEES
UC is on target to meet its goal to enroll over 250,000 California resident undergraduate FTEs by 2030.
1.1.5 FTE enrollment, progress toward 2030 goals, Universitywide, 2015–16 to 2029–30
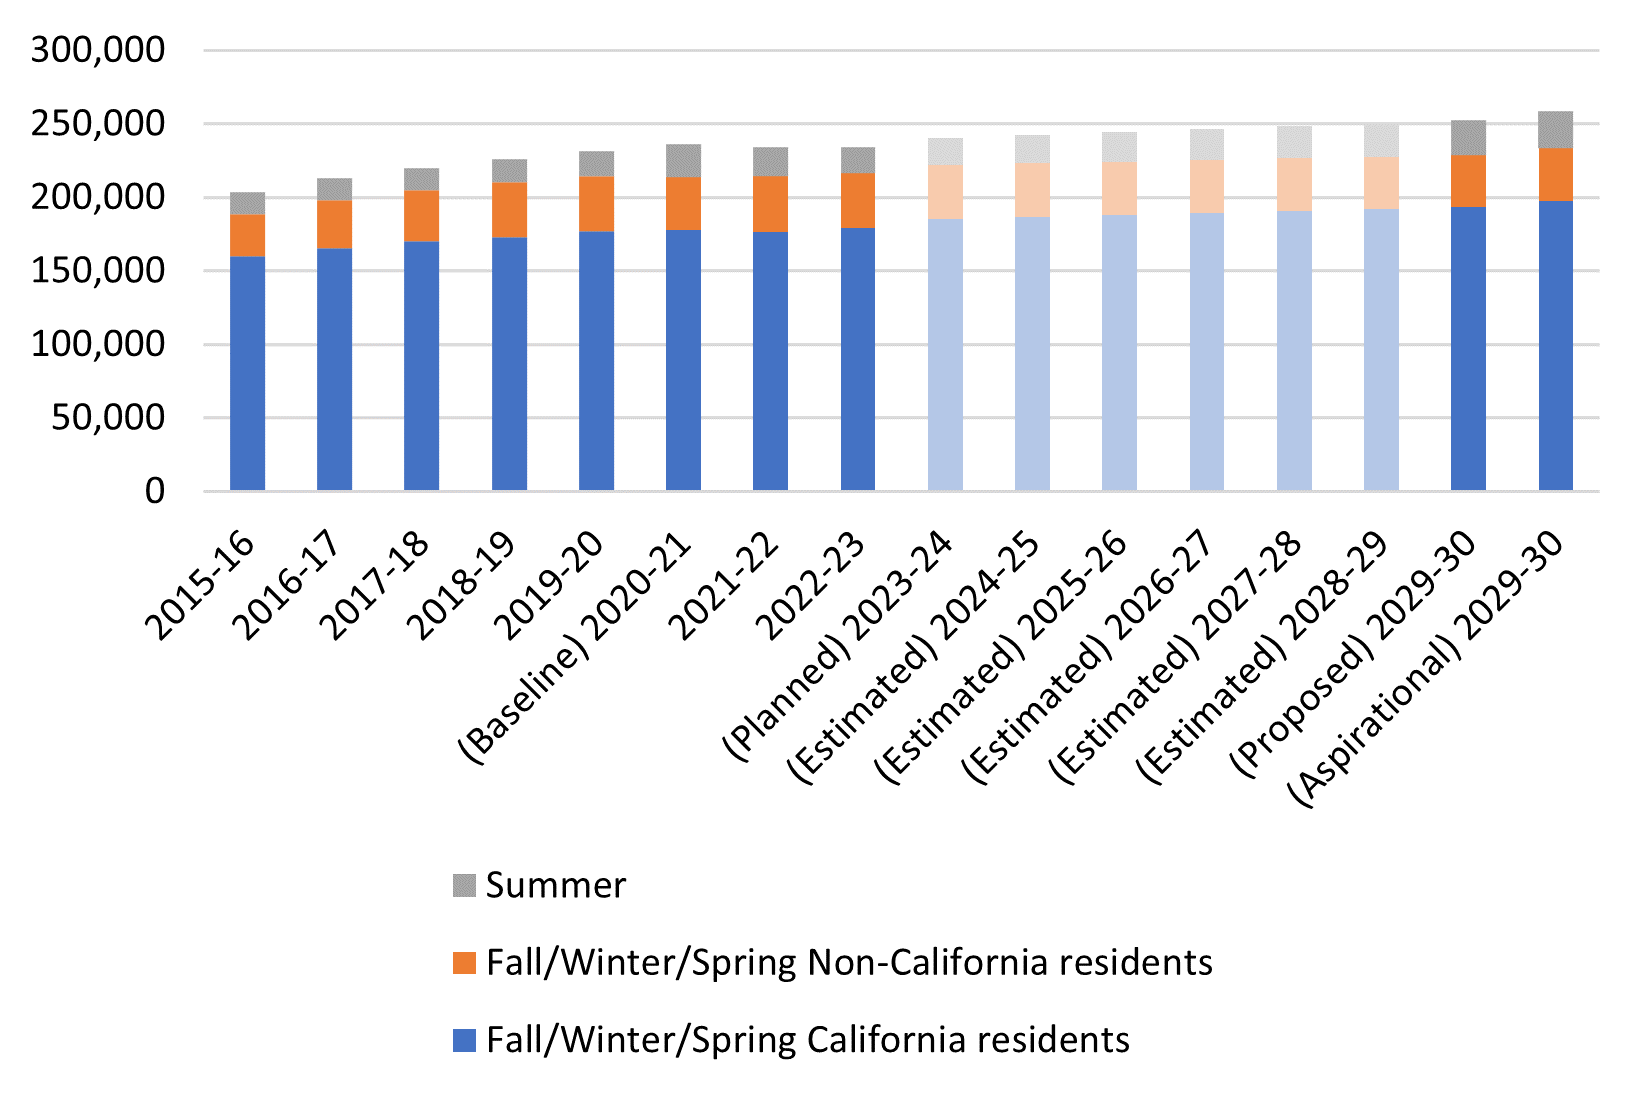
Source: UC Data Warehouse, UCOP Institutional Research & Academic Planning
In the University of California 2030 Capacity Plan, UC proposed increasing undergraduate enrollment of California residents1 from about 200,000 in 2020–21 to between 217,000 and 223,000 in 2029–30 and keeping undergraduate enrollment of non-California residents roughly the same at about 36,000.
In the two years since the baseline, enrollment of California residents during the academic year increased by nearly 2,000, while summer enrollment declined by about 5,000 from a record high in 2020–21. In addition, the average number of units taken has declined, leading to a decline in FTEs relative to headcount enrollment. In 2023–24, UC plans to meet legislative expectations for growth by increasing the number of California resident undergraduates by about 8,000 compared to 2021–22. To reach the proposed 2029–30 goal, enrollment of undergraduate California residents will need to grow by 2,000 students per year in 2024–25 and all other years through 2029–30.
1In this capacity plan, summer students are counted as California residents.
A little over one-third of entering freshmen and over two-fifths of entering transfer students are first-generation college students.
1.2.1 Entering students by first-generation status1, Universitywide, Fall 2011 to 2022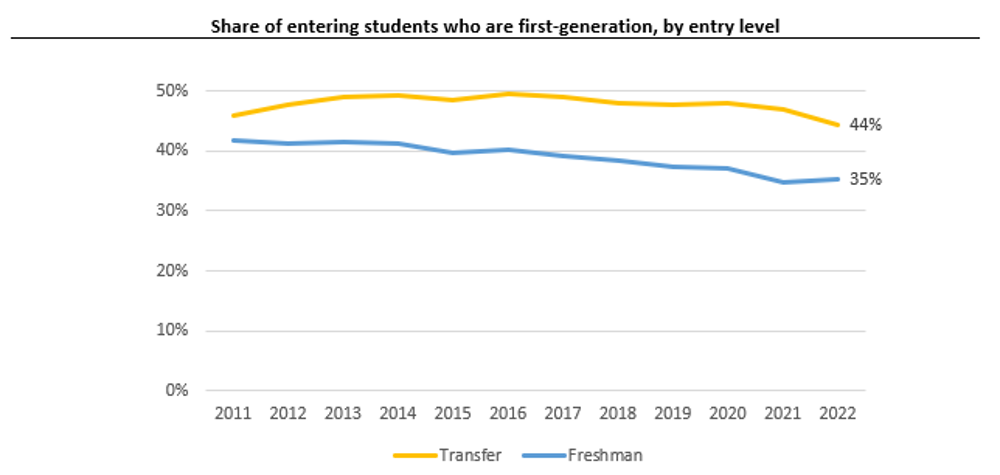
Source: UC Data Warehouse
A little over one-third (35 percent) of entering freshman students were first-generation in fall 2022 compared to 44 percent of entering transfers. The first-generation share of freshmen was about the same in fall 2022 compared to fall 2021 (35 percent), while the share of transfer students declined from fall 2021 (47 percent) to fall 2022 (44 percent).
1 First-generation students are those whose parent(s) did not complete a four-year college degree. Total of first-generation students is 28,193 (38.3 percent); not-first-generation students total 43,270 (58.8 percent); and missing/unknown are 2,102 (2.9 percent).
1.2 DEMOGRAPHIC OUTCOMES
Most undergraduate students who are first-generation are from underrepresented groups (URGs).
1.2.2 Demographics of first-generation students, Universitywide

First-generation college students dashboard
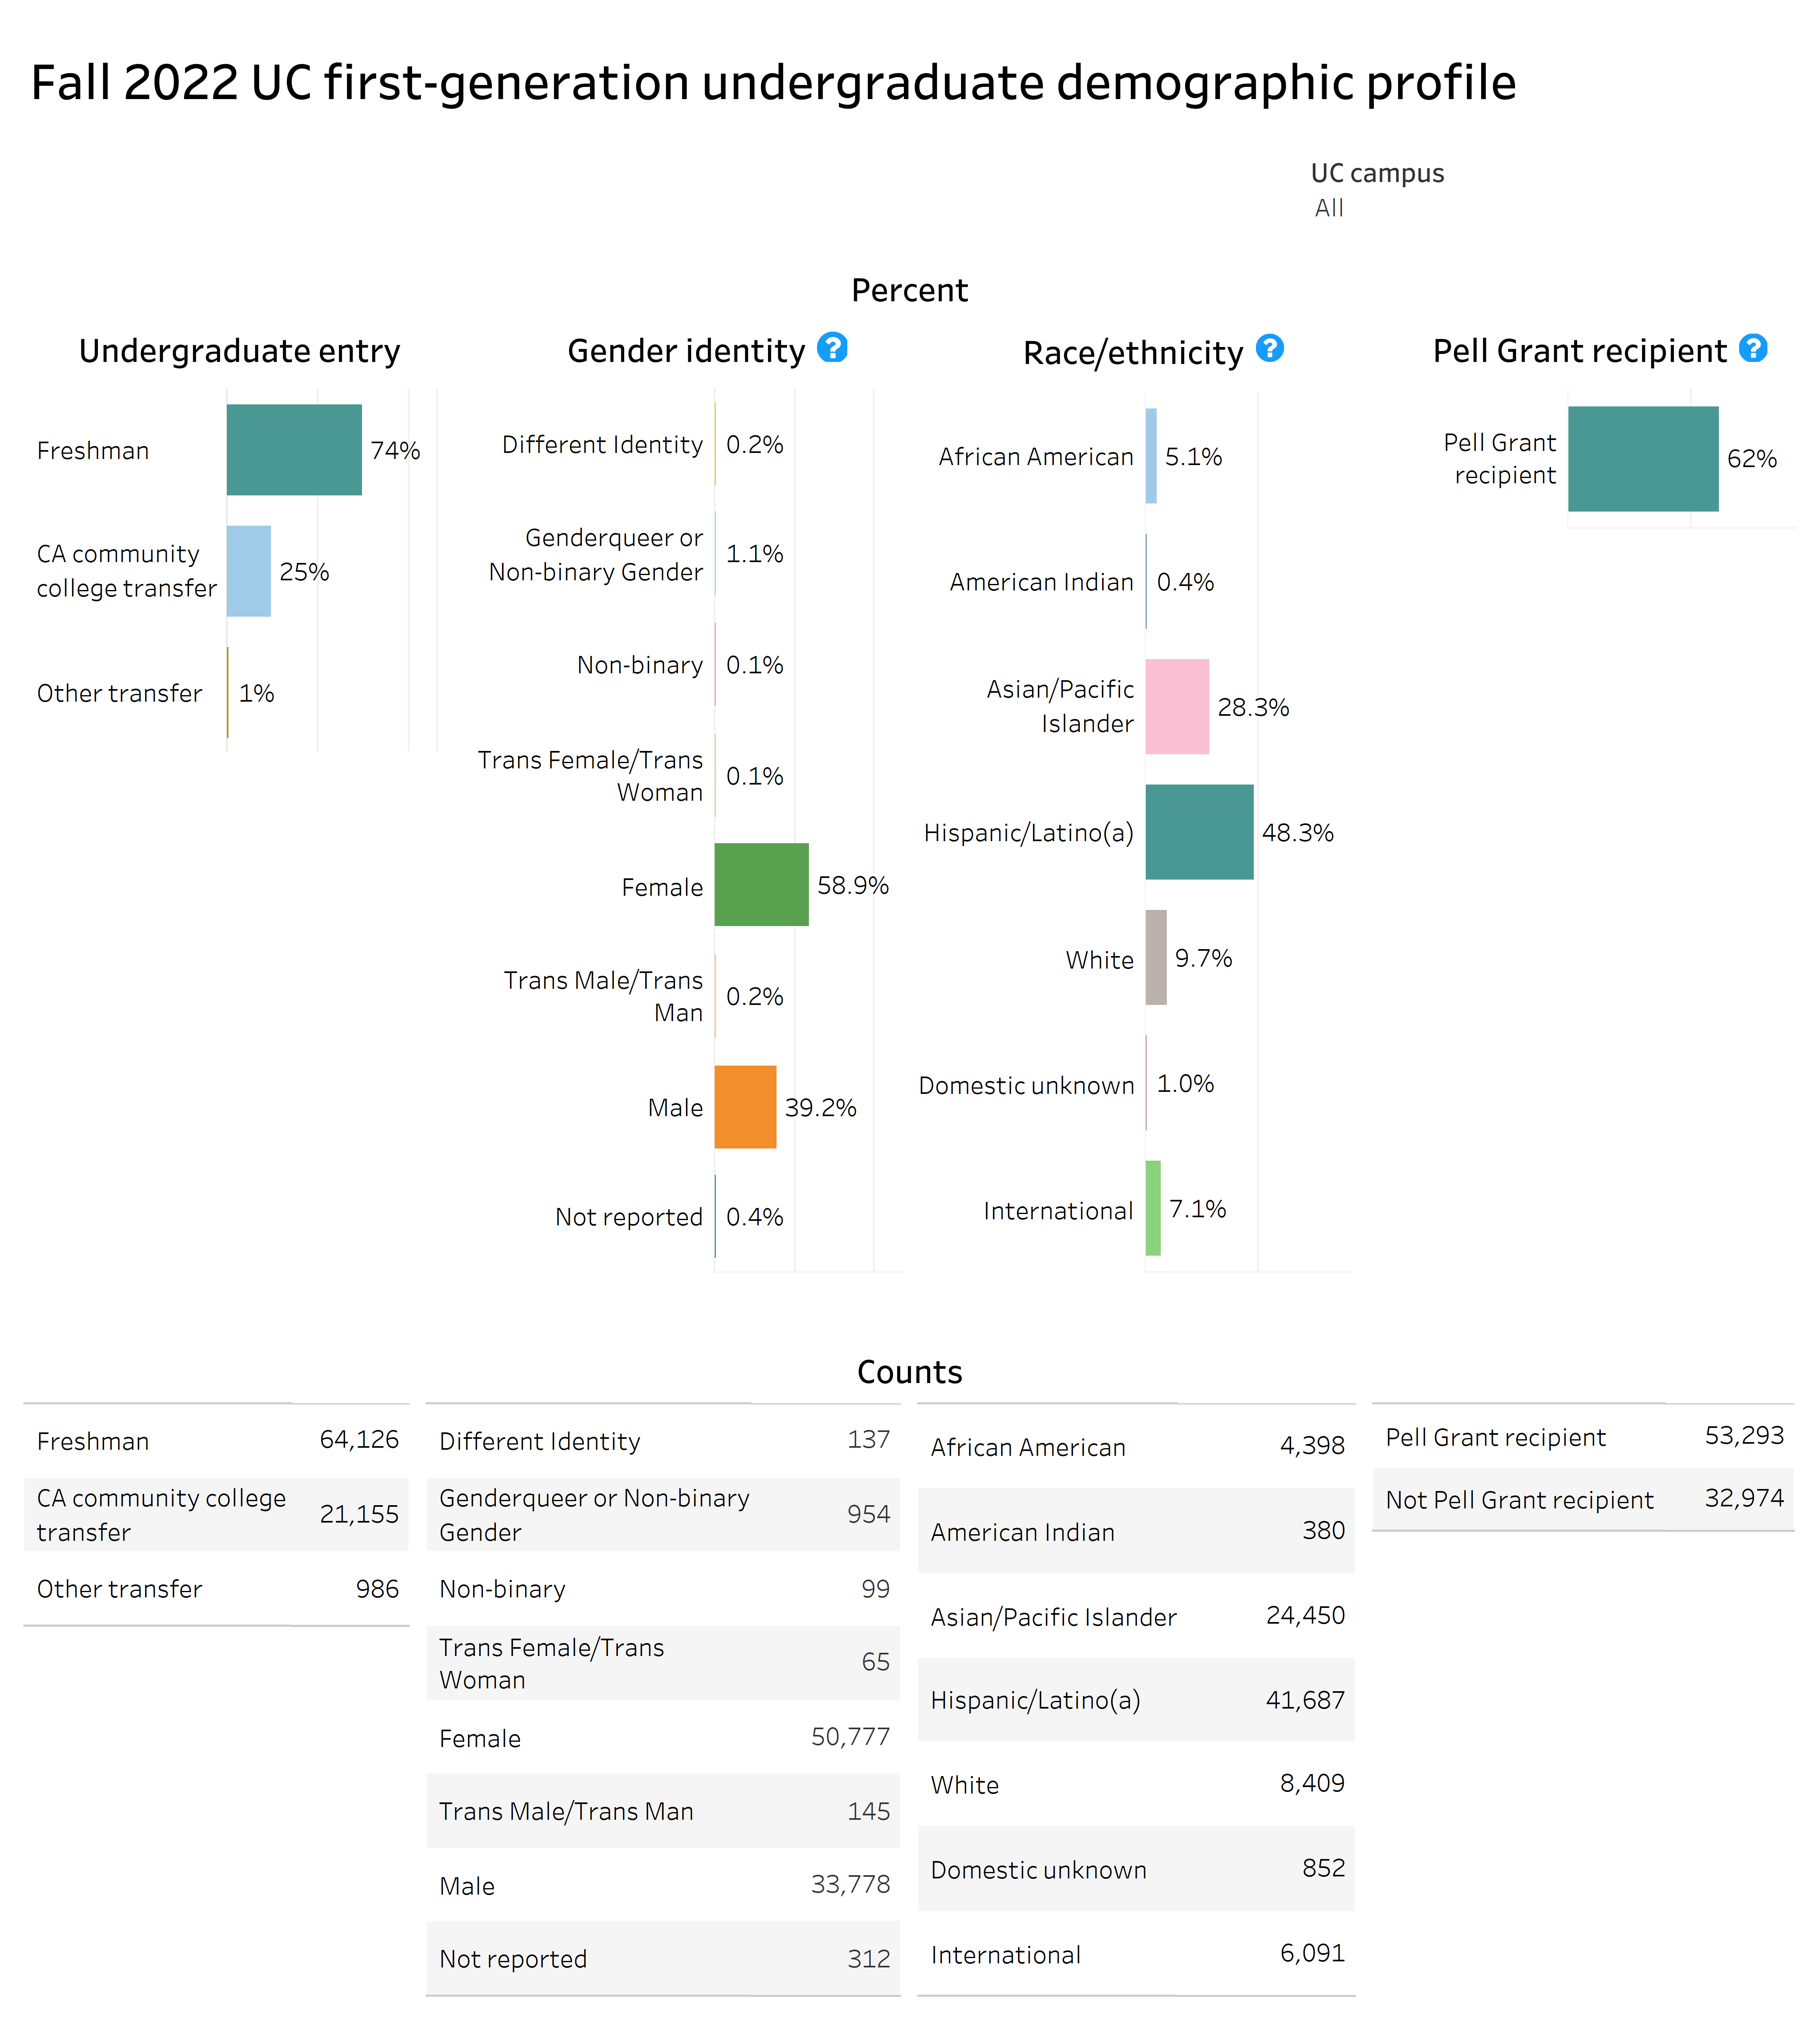
Over half (52 percent) of first-generation undergraduate students in fall 2022 are from URGs. Over one-fourth (26 percent) of first-generation students entered as transfers. Over three-fifths (62 percent) of first-generation students are lower-income Pell Grant recipients. And nearly three-fifths (59 percent) of first-generation students are female vs. 40 percent male and about one percent other gender identities or unknown.
1.2 DEMOGRAPHIC OUTCOMES
The gap between the share of URG high school graduates and URG freshman enrollees increased slightly in 2022 to 21 percentage points.
1.2.3 Underrepresented Groups (URGs) as a share of California public high school graduates vs. a share of freshman applicants, admits, and new enrollees from California public high schools, Universitywide, Fall 1989 to 2022
Gap analysis dashboard
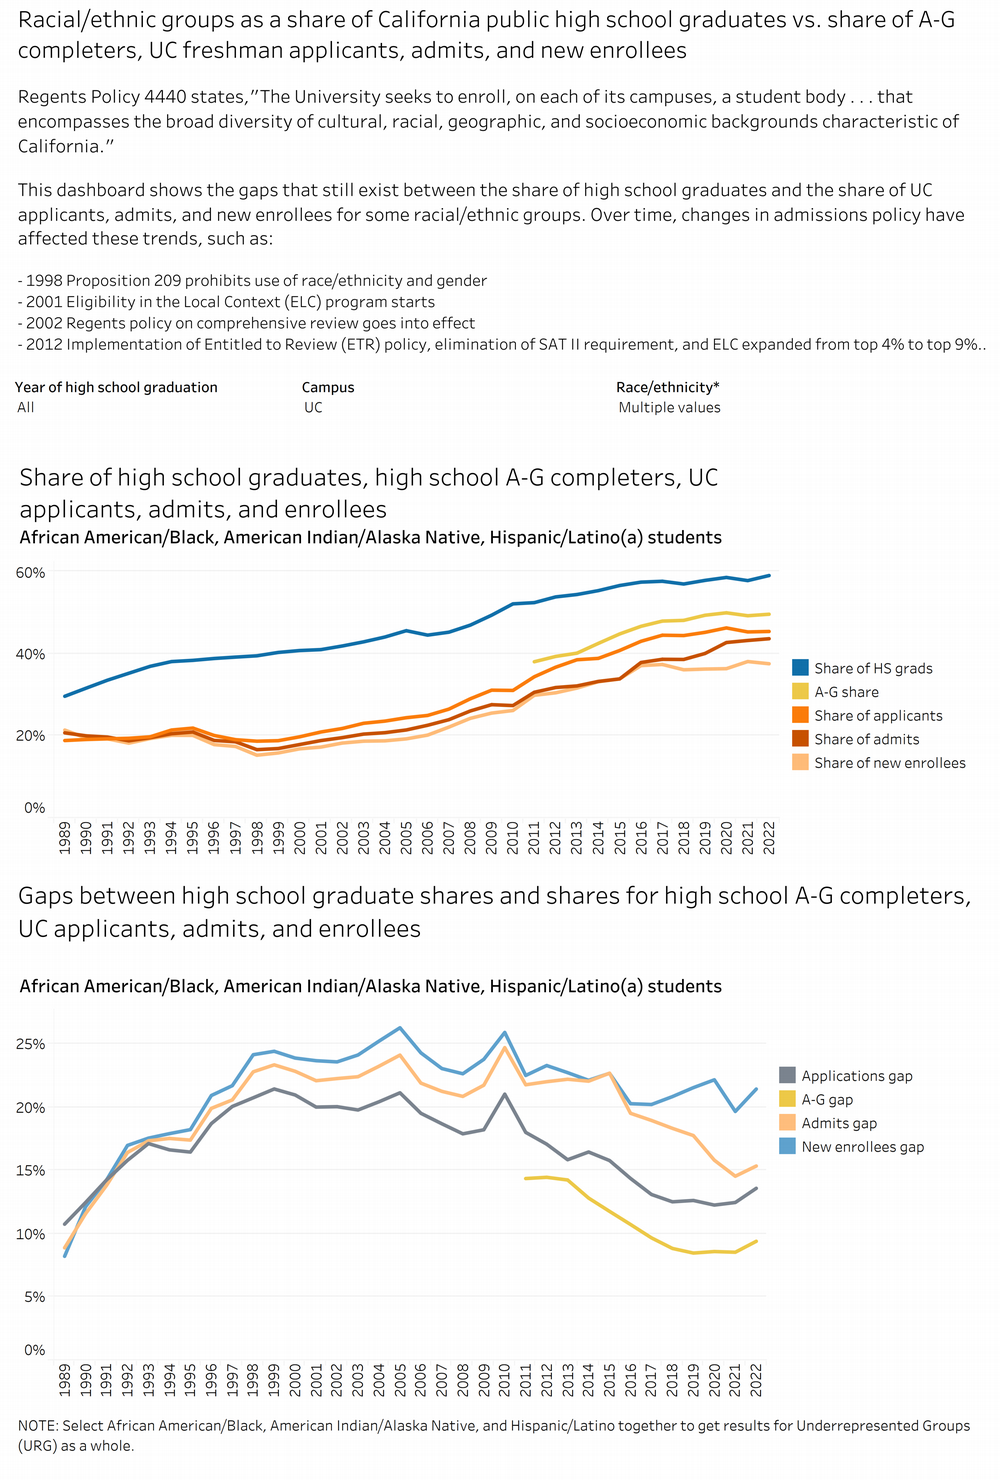
Before Proposition 209 took effect in 1998, the gap between the share of URGs among California public high school graduates and the share of URGs among UC freshman enrollees from California public high schools was in the eight to 22 percent range, with most years below 20 percent. This gap has stayed in the 20–25 percent range since 1998.
In 2022, 59 percent of California public high school graduates were from underrepresented groups (URGs) while 38 percent of new freshman enrollees at UC were from these groups, for a 21 percent gap (similar to the 20-22 percentage point gaps in recent years).
1.2 DEMOGRAPHIC OUTCOMES
The gap between the share of transfer-ready CCC students who are from URGs and the share of CCC transfer new enrollees who are from URGs has grown in recent years.
1.2.4 Underrepresented Groups (URGs) as a share of transfer-ready1 California Community College (CCC) students vs. a share of UC transfer applicants, admits, and new enrollees from CCCs, Universitywide, Fall 1989 to 2022
Gap analysis dashboard
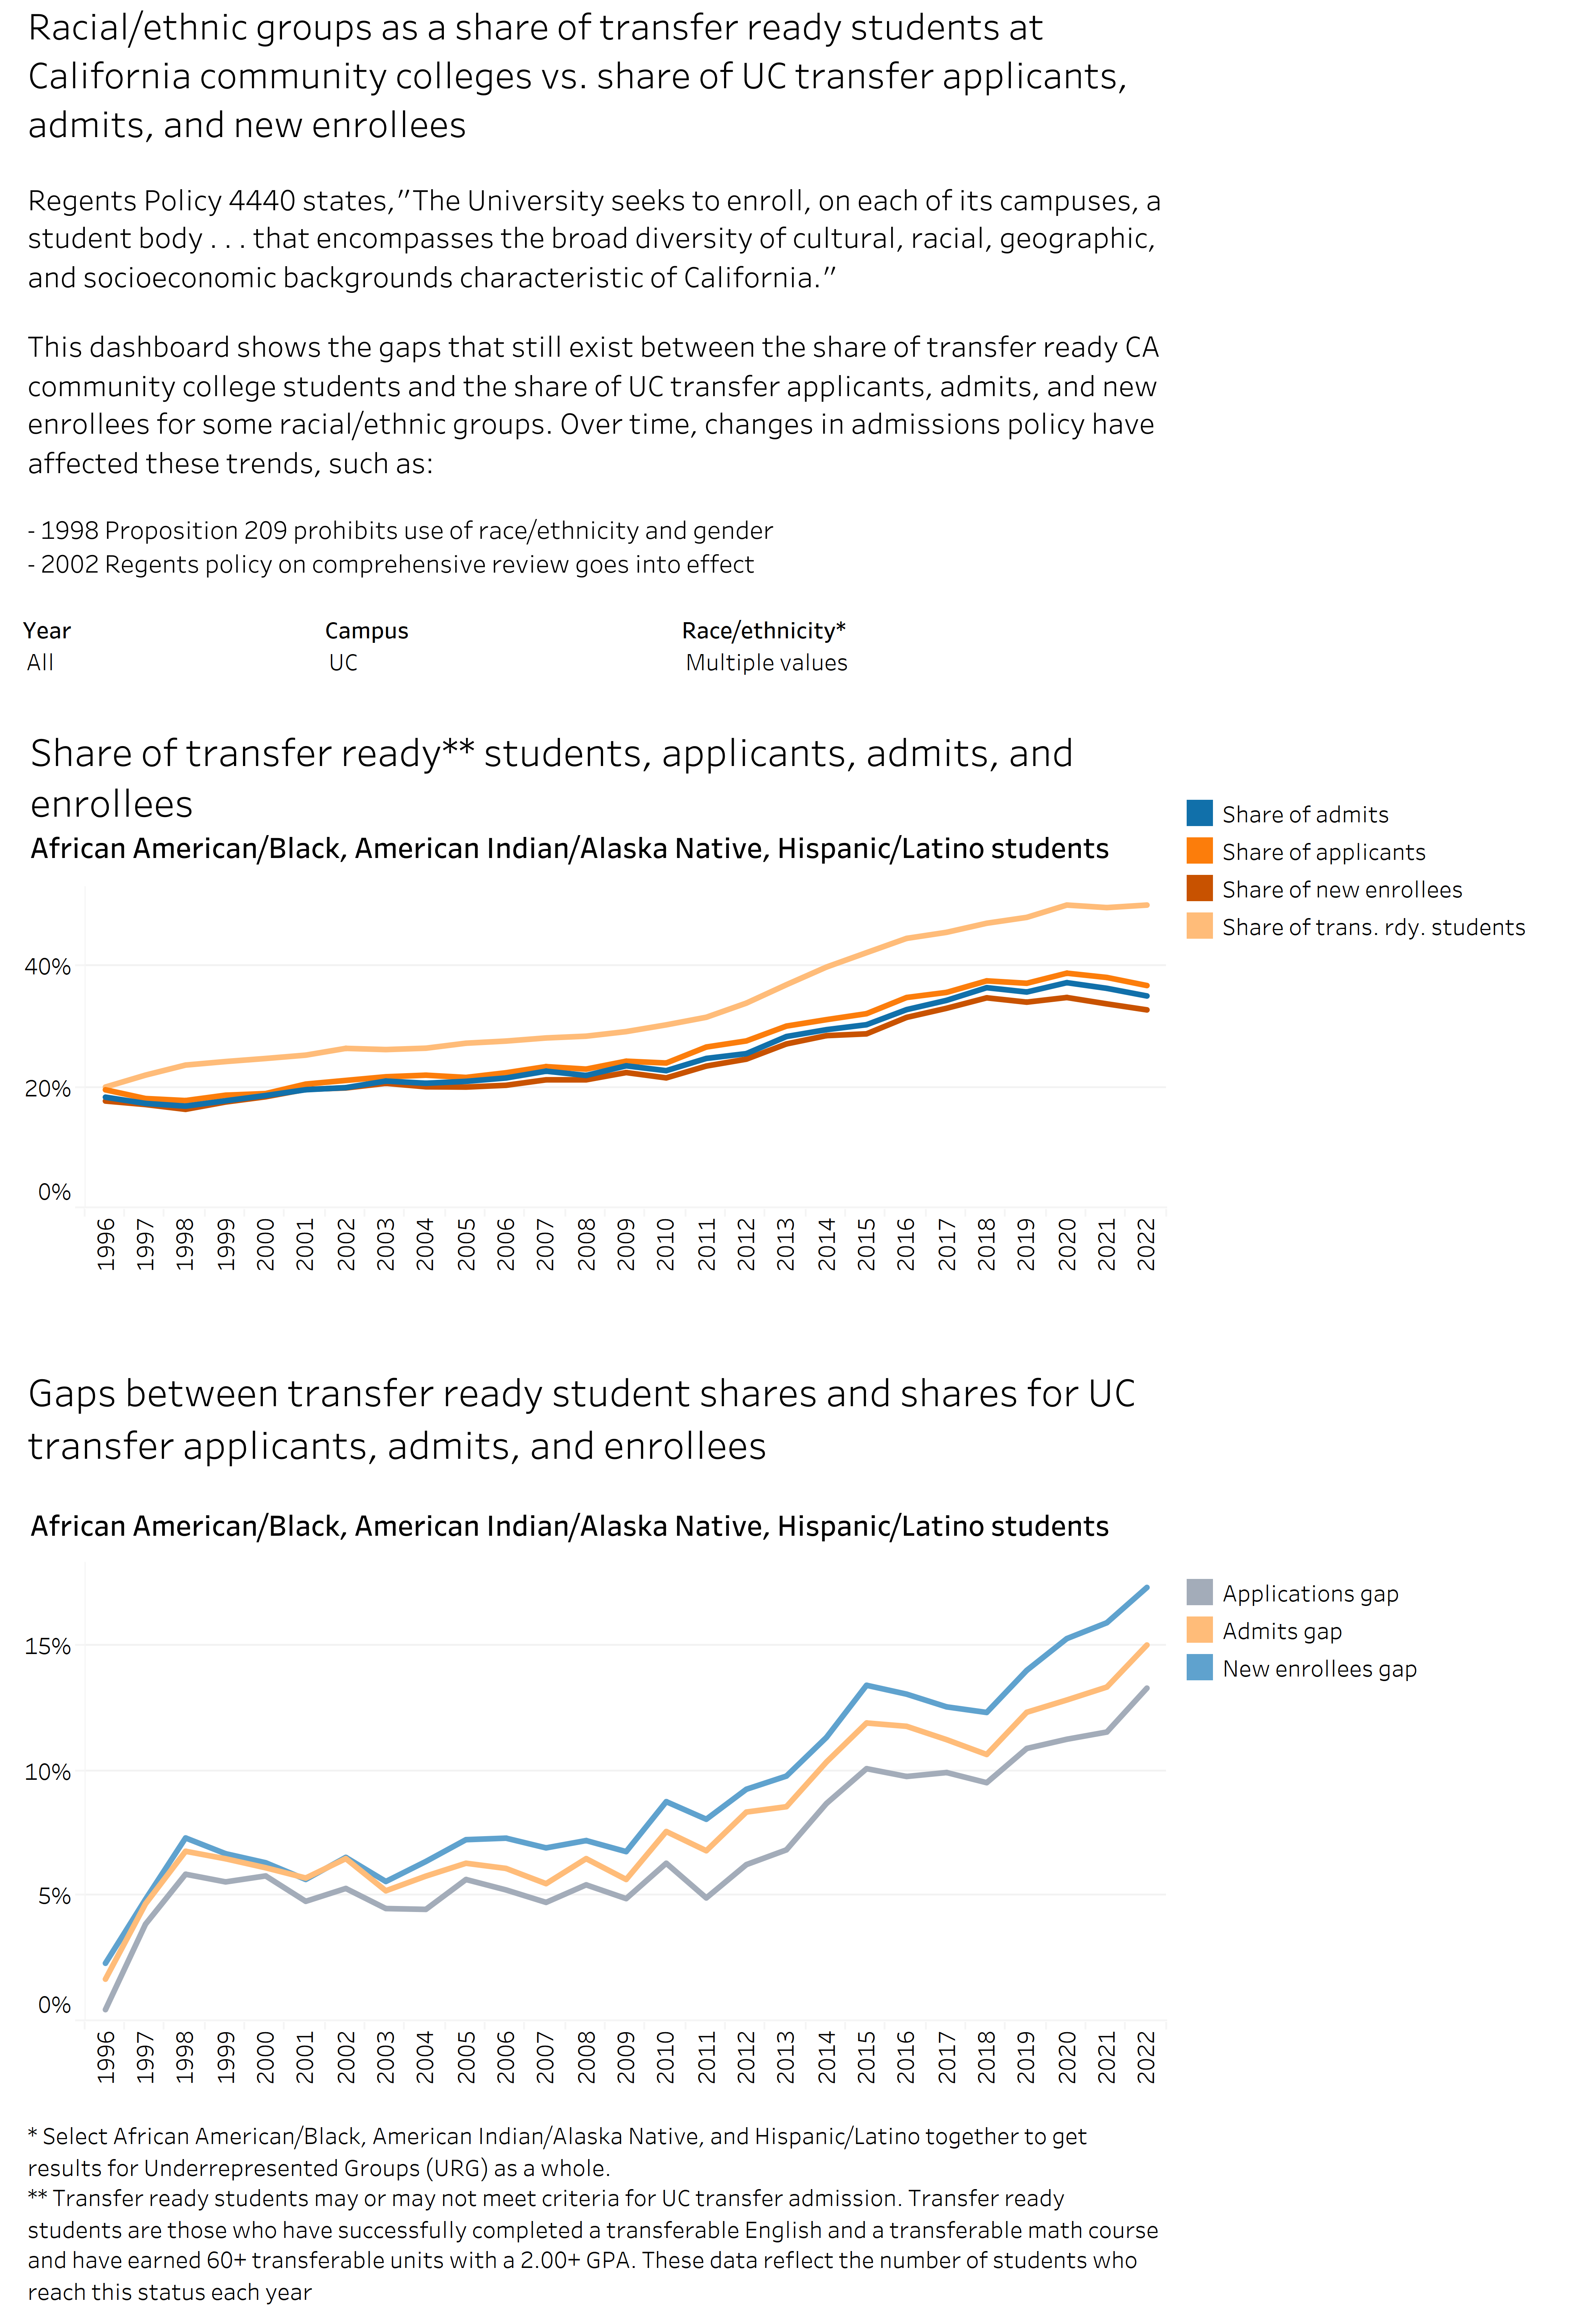
The gap between the URG share of transfer-ready CCC students and the URG share of UC transfer enrollees from CCCs has gone from six percentage points in 2003 to 17 percentage points in 2022.
1Transfer ready students are those who have successfully completed a transferable English and a transferable math course and have earned 60+ transferable units with a 2.00+ GPA. These data reflect the number of students who reach this status each year. “Transfer-ready” is a proxy for students who are ready for UC admission.
1.2 DEMOGRAPHIC OUTCOMES
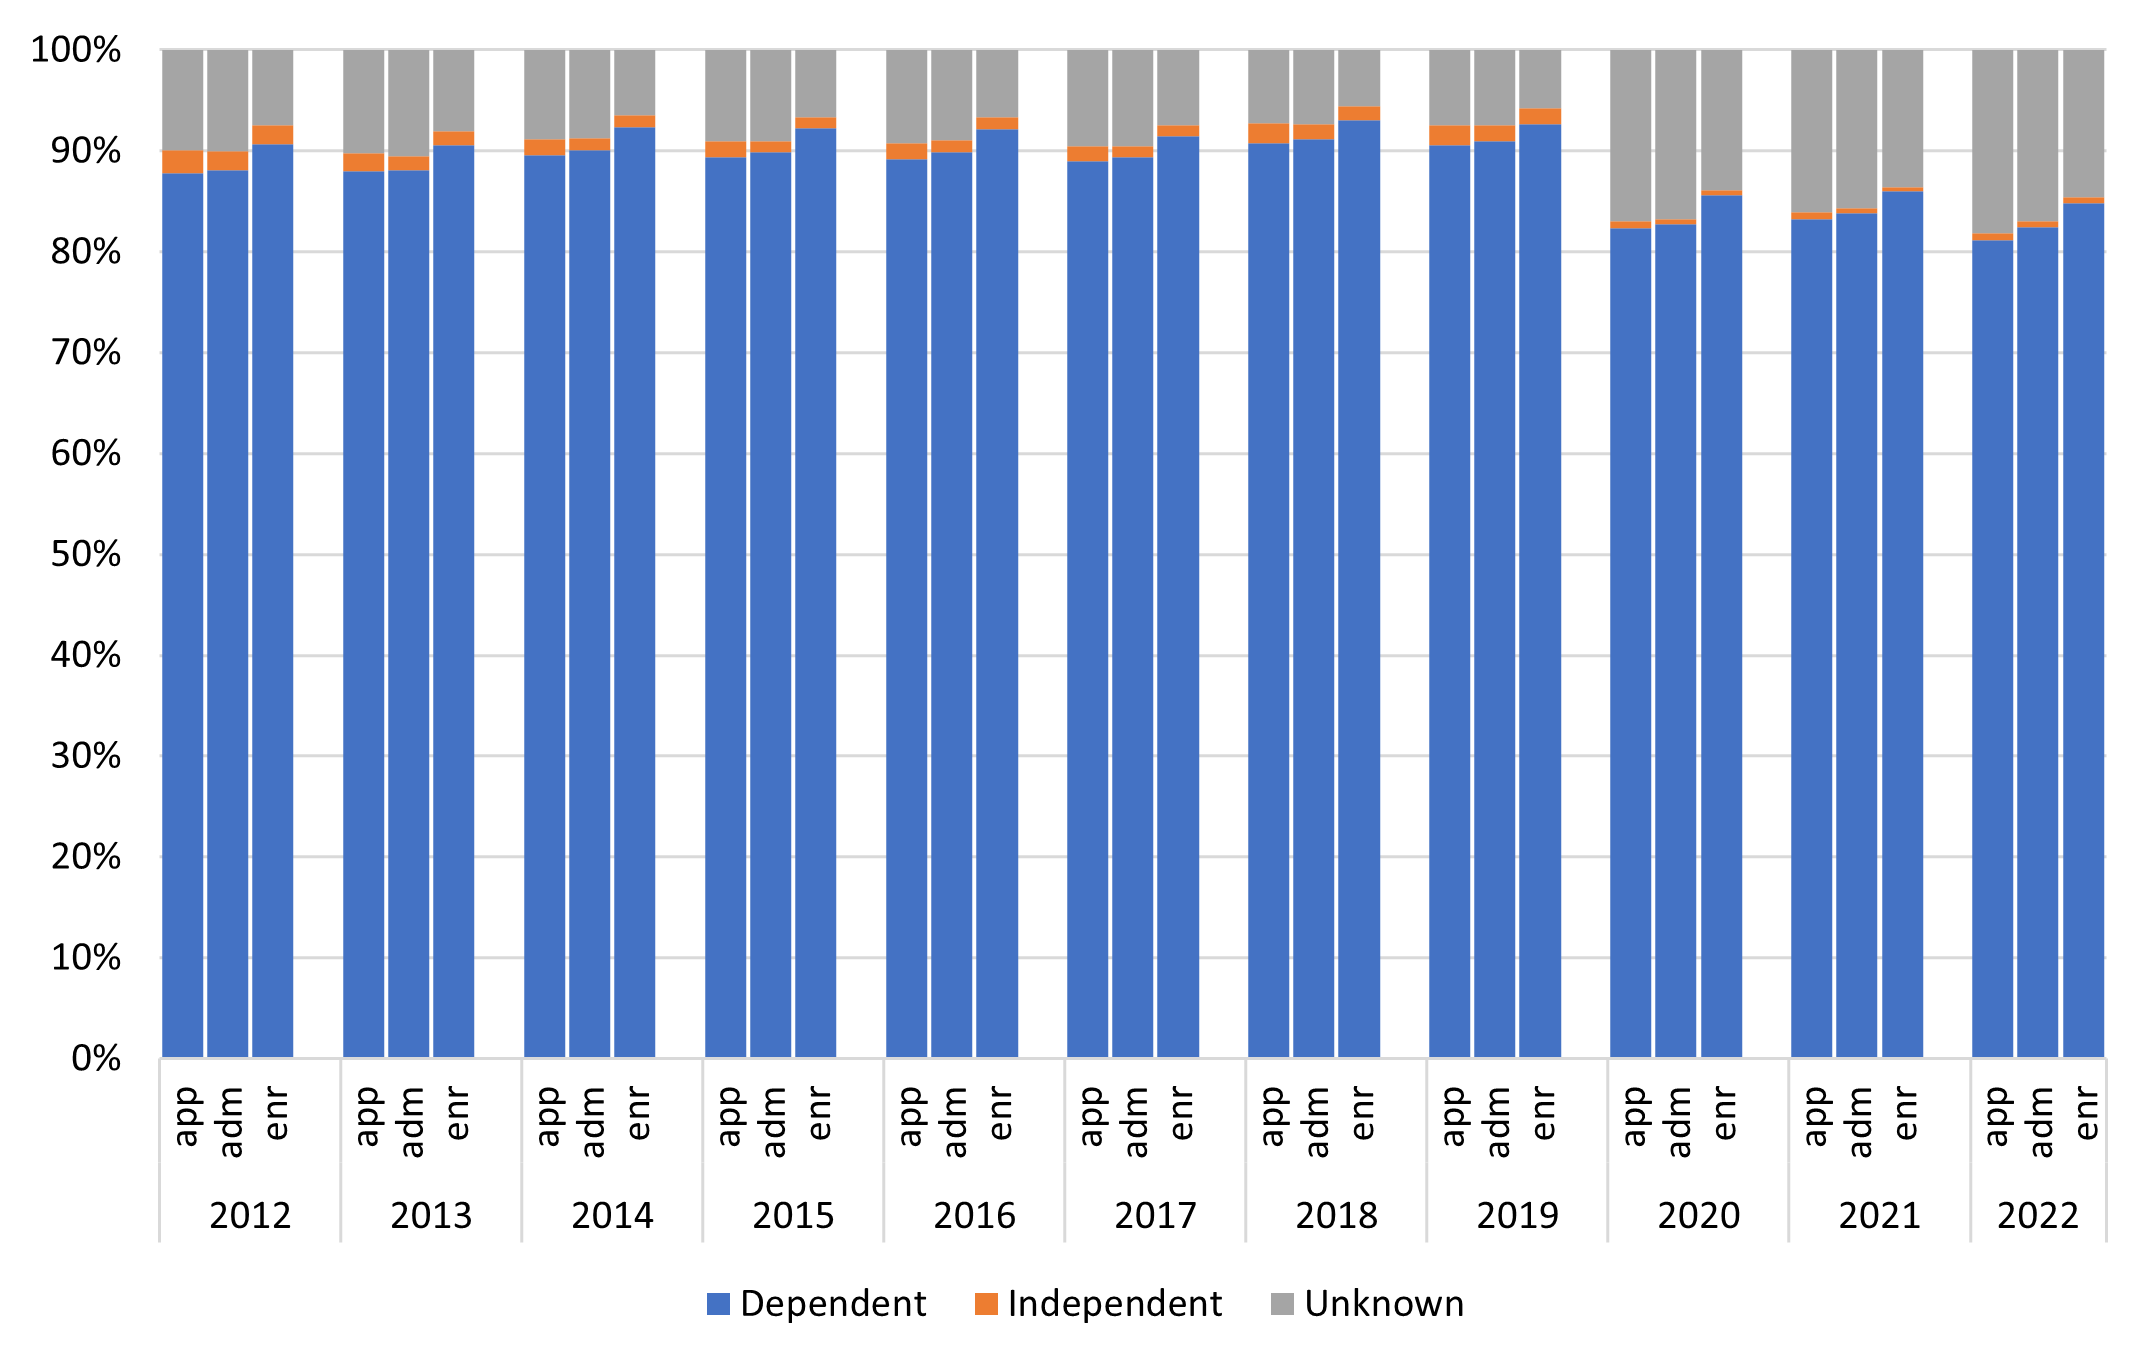
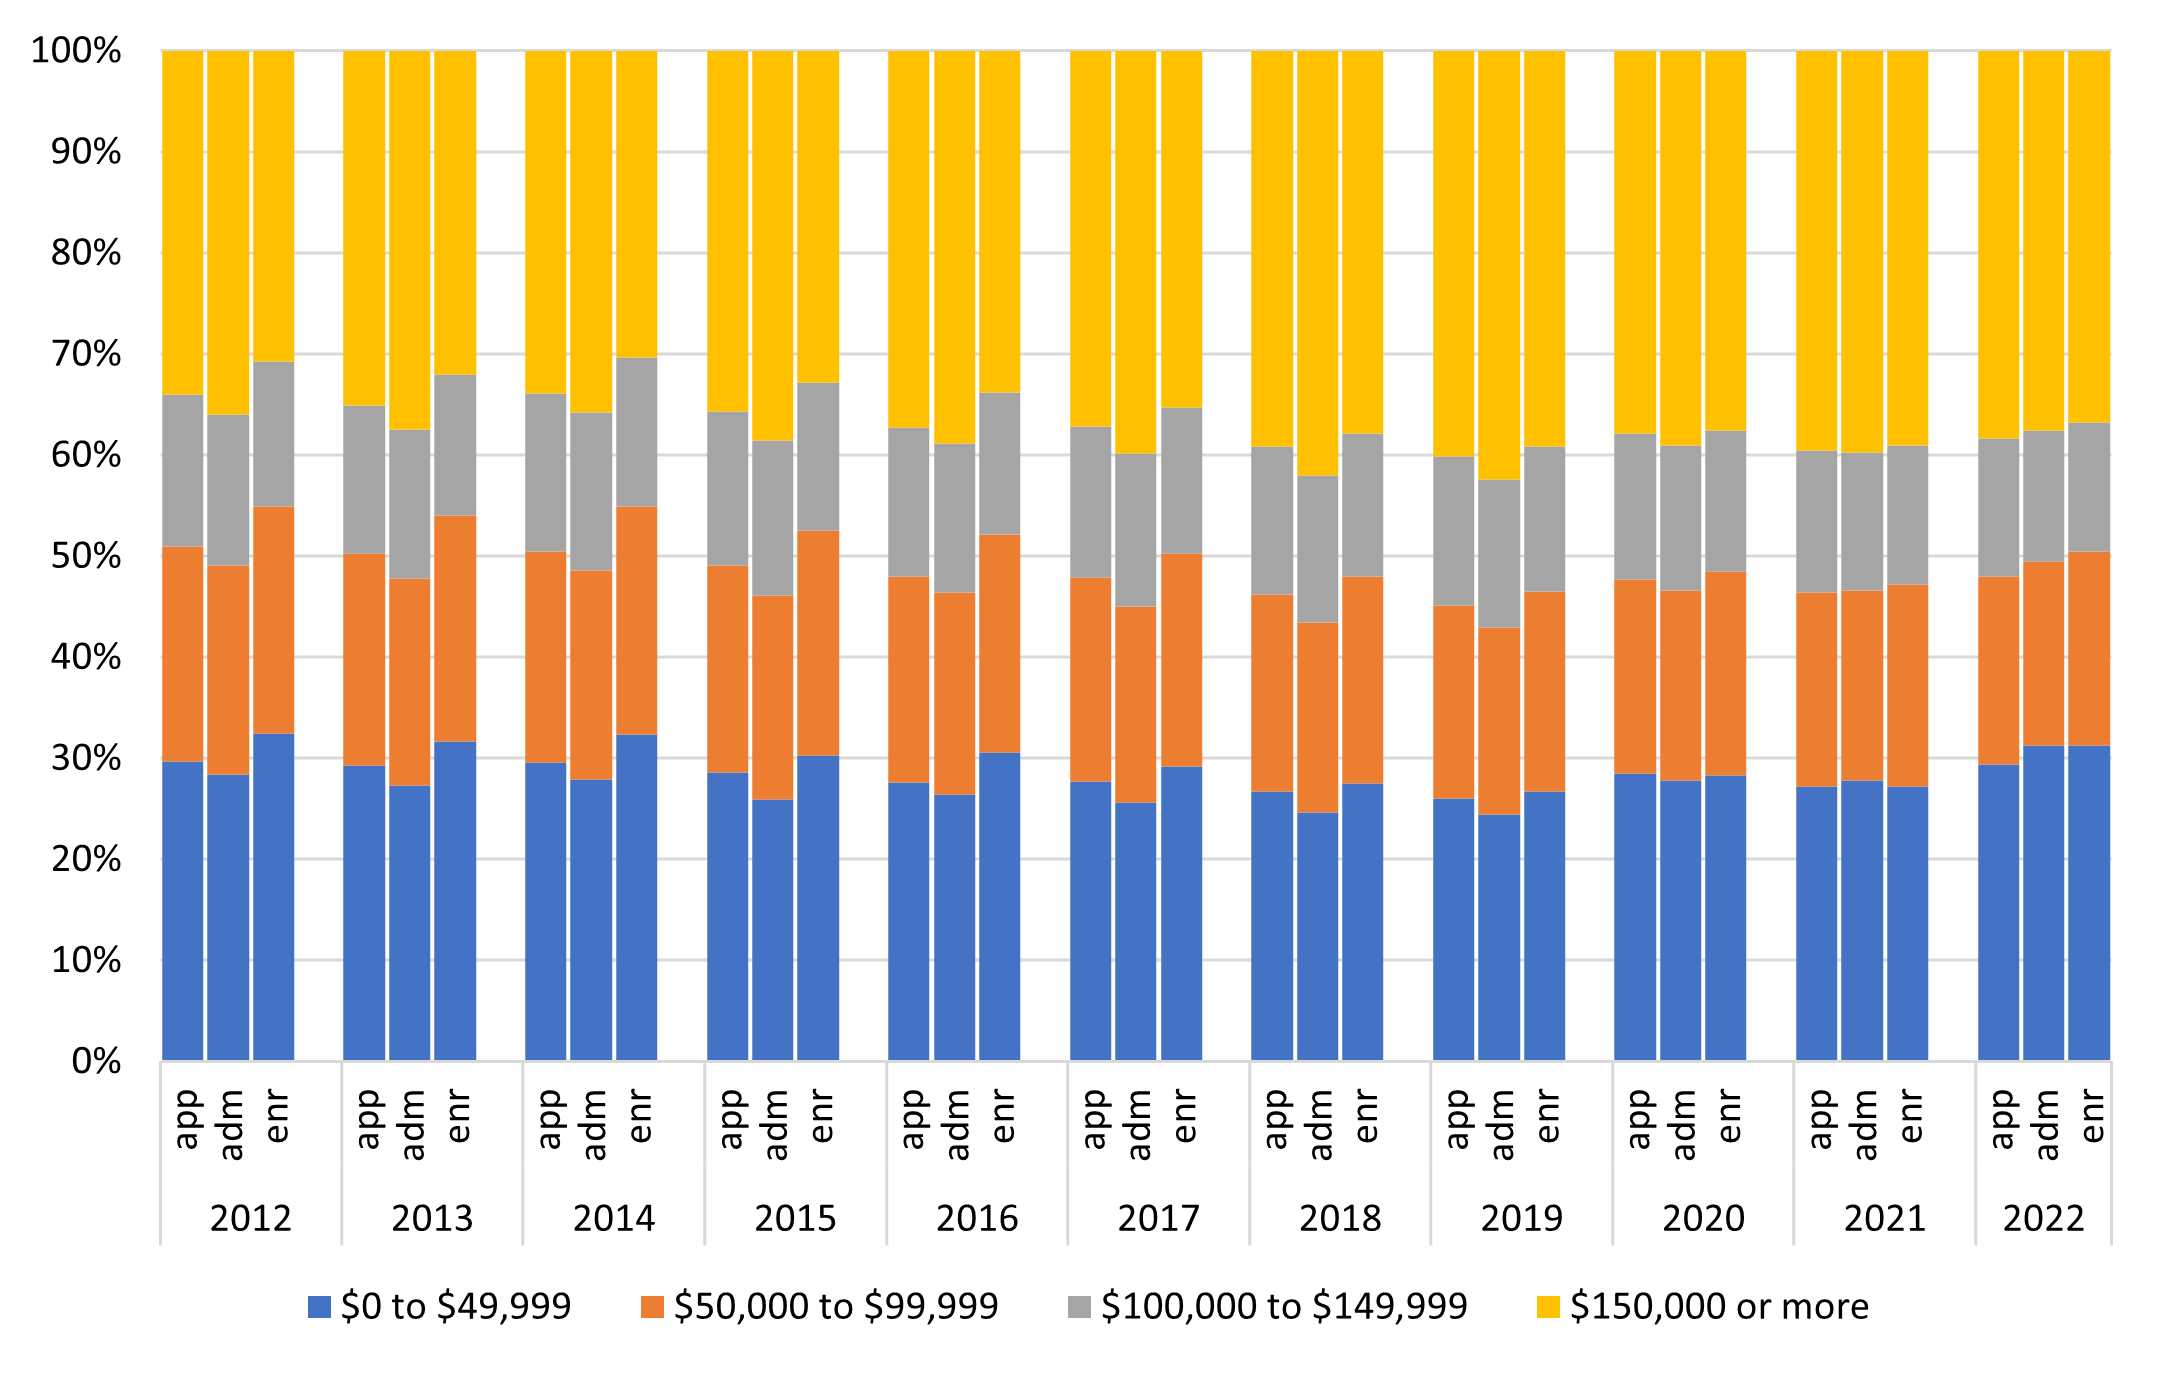
The share of dependent freshman applicants, admits, and enrollees with parents’ income under $50,000 has stayed about the same in recent years.
1.2.5 Undergraduate freshman applicants, admits, and enrollees by self-reported parents’ income, Universitywide1, Fall 2012 to 2022
Share of undergraduate freshman applicants, admits, and enrollees by dependency2
Share of undergraduate dependent freshman applicants, admits, and enrollees by income range
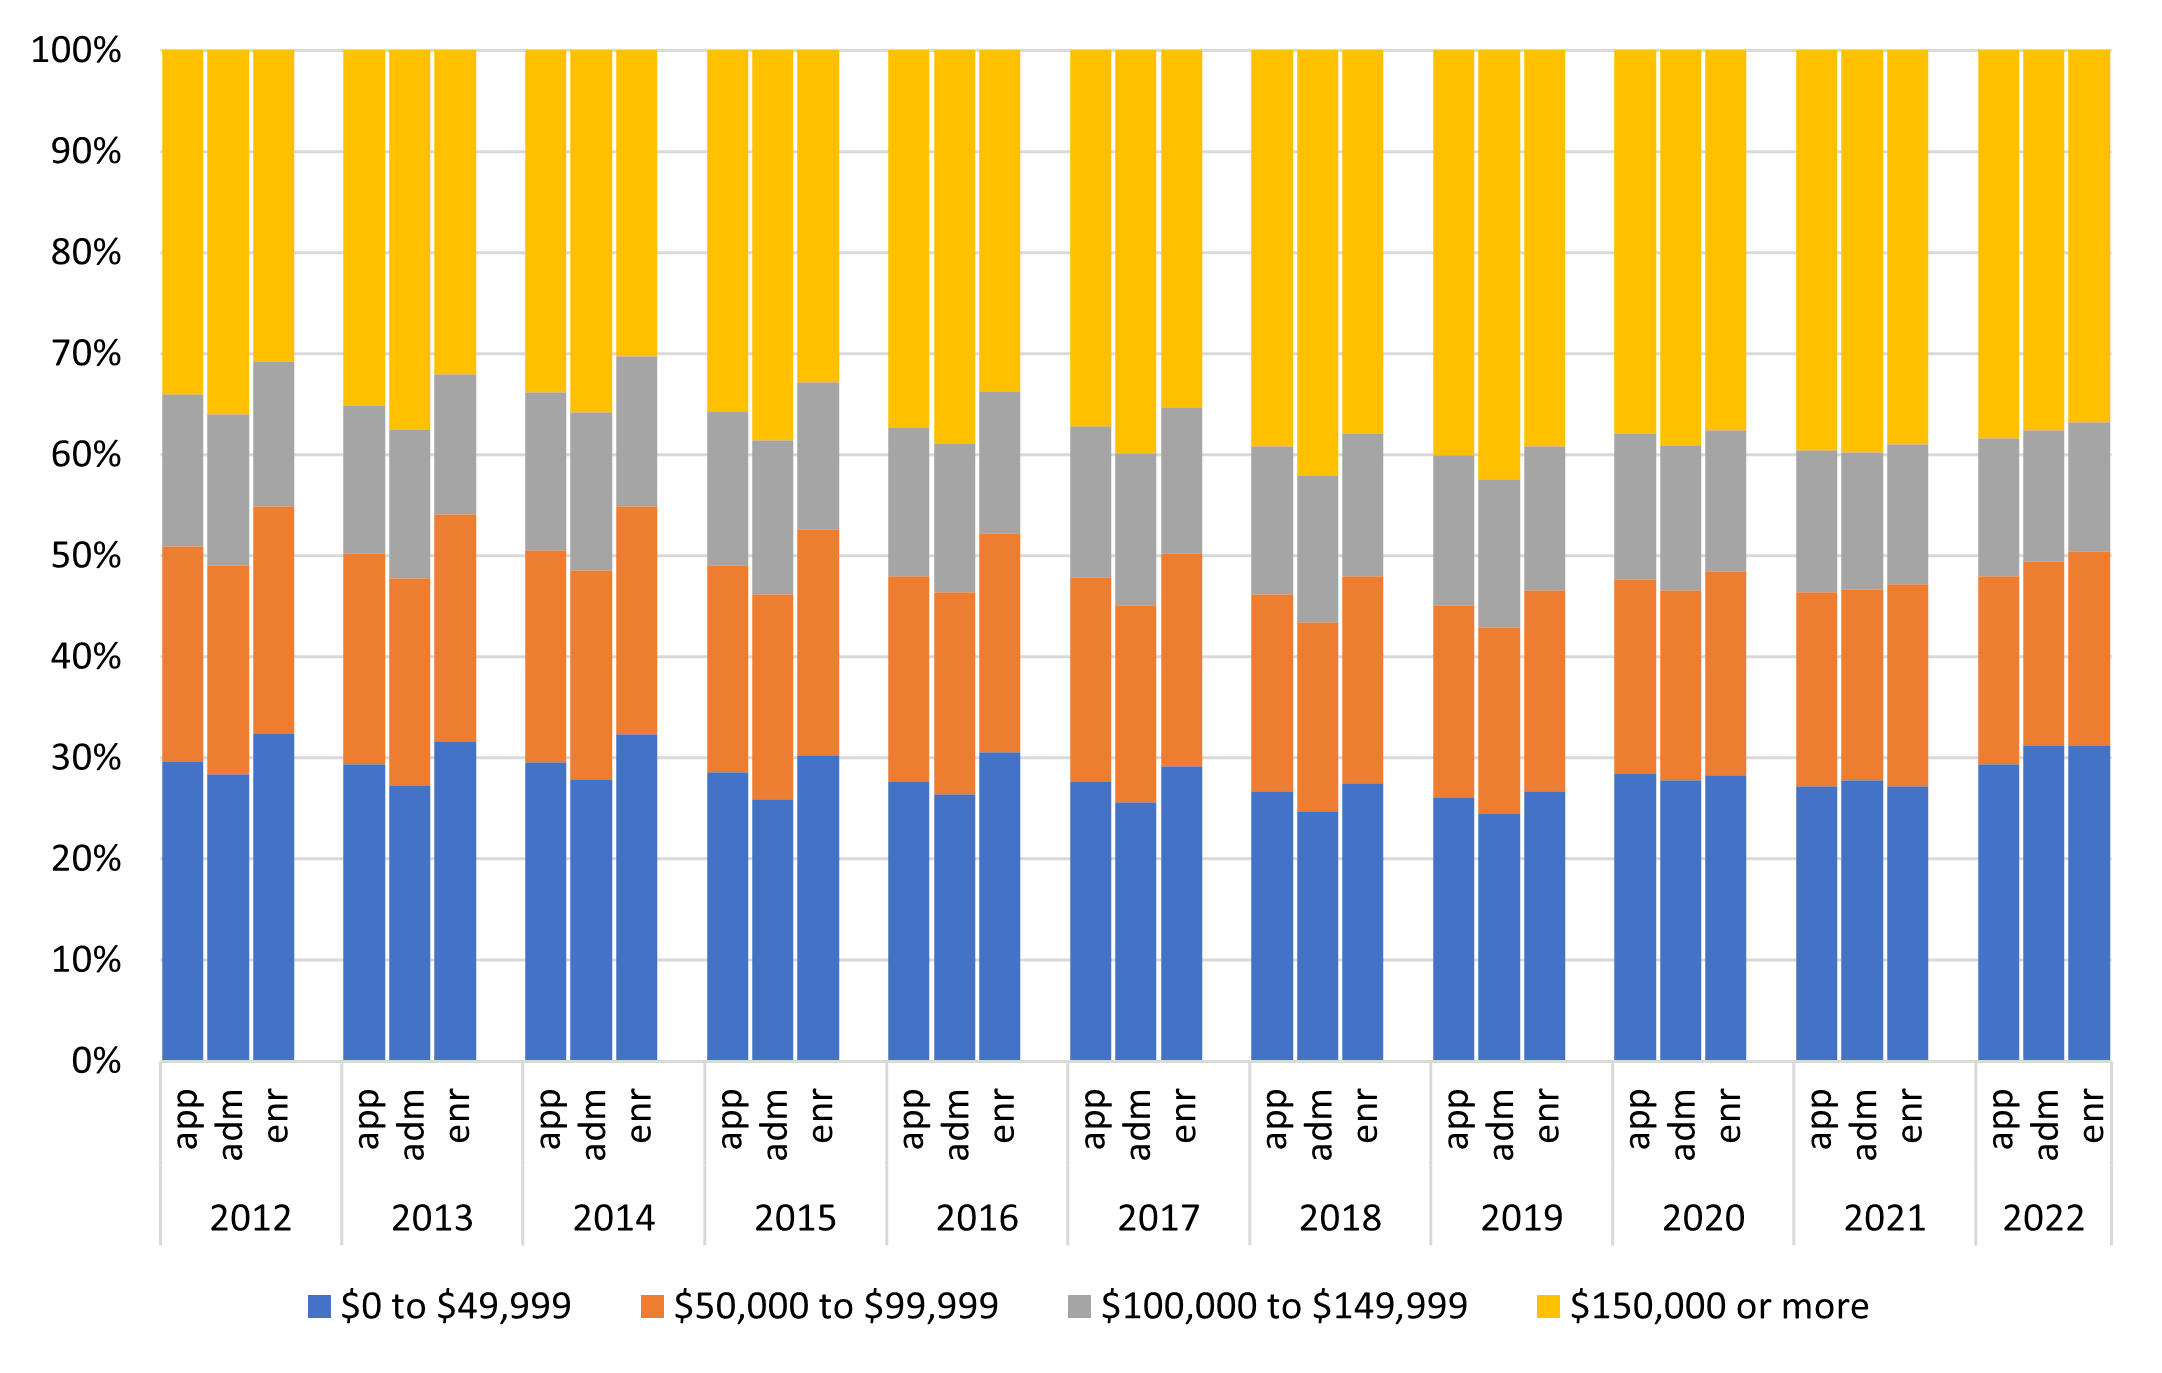
Source: UC Data Warehouse
In fall 2022, over 80 percent of freshman applicants, admits, and enrollees were dependent, about were independent, and the rest were unknown. In recent years, about one-third of dependent freshman applicants, admits, and enrollees have had parents’
income under $50,000, over one-fifth were between $50,000 and $99,999, about one-sixth were between $100,000 and $149,999, and about three-tenths were at least $150,000
1Dependency status and parents’ income are based on information reported on the application for admission, both of which can vary from that provided on financial aid applications. All dollar amounts are in inflation-adjusted 2022 dollars. The unknown category comprises students who did not provide income information on the application.
2To be considered independent, a student must be married, have children, be a member of the U.S. military on active duty or have served on active duty, or be age 24 by by the time they enroll at UC. All others who provided income information are considered dependent. The increase in unknown dependency status in fall 2020 was primarily due to changes in the presentation of income questions on the application.
1.2 DEMOGRAPHIC OUTCOMES
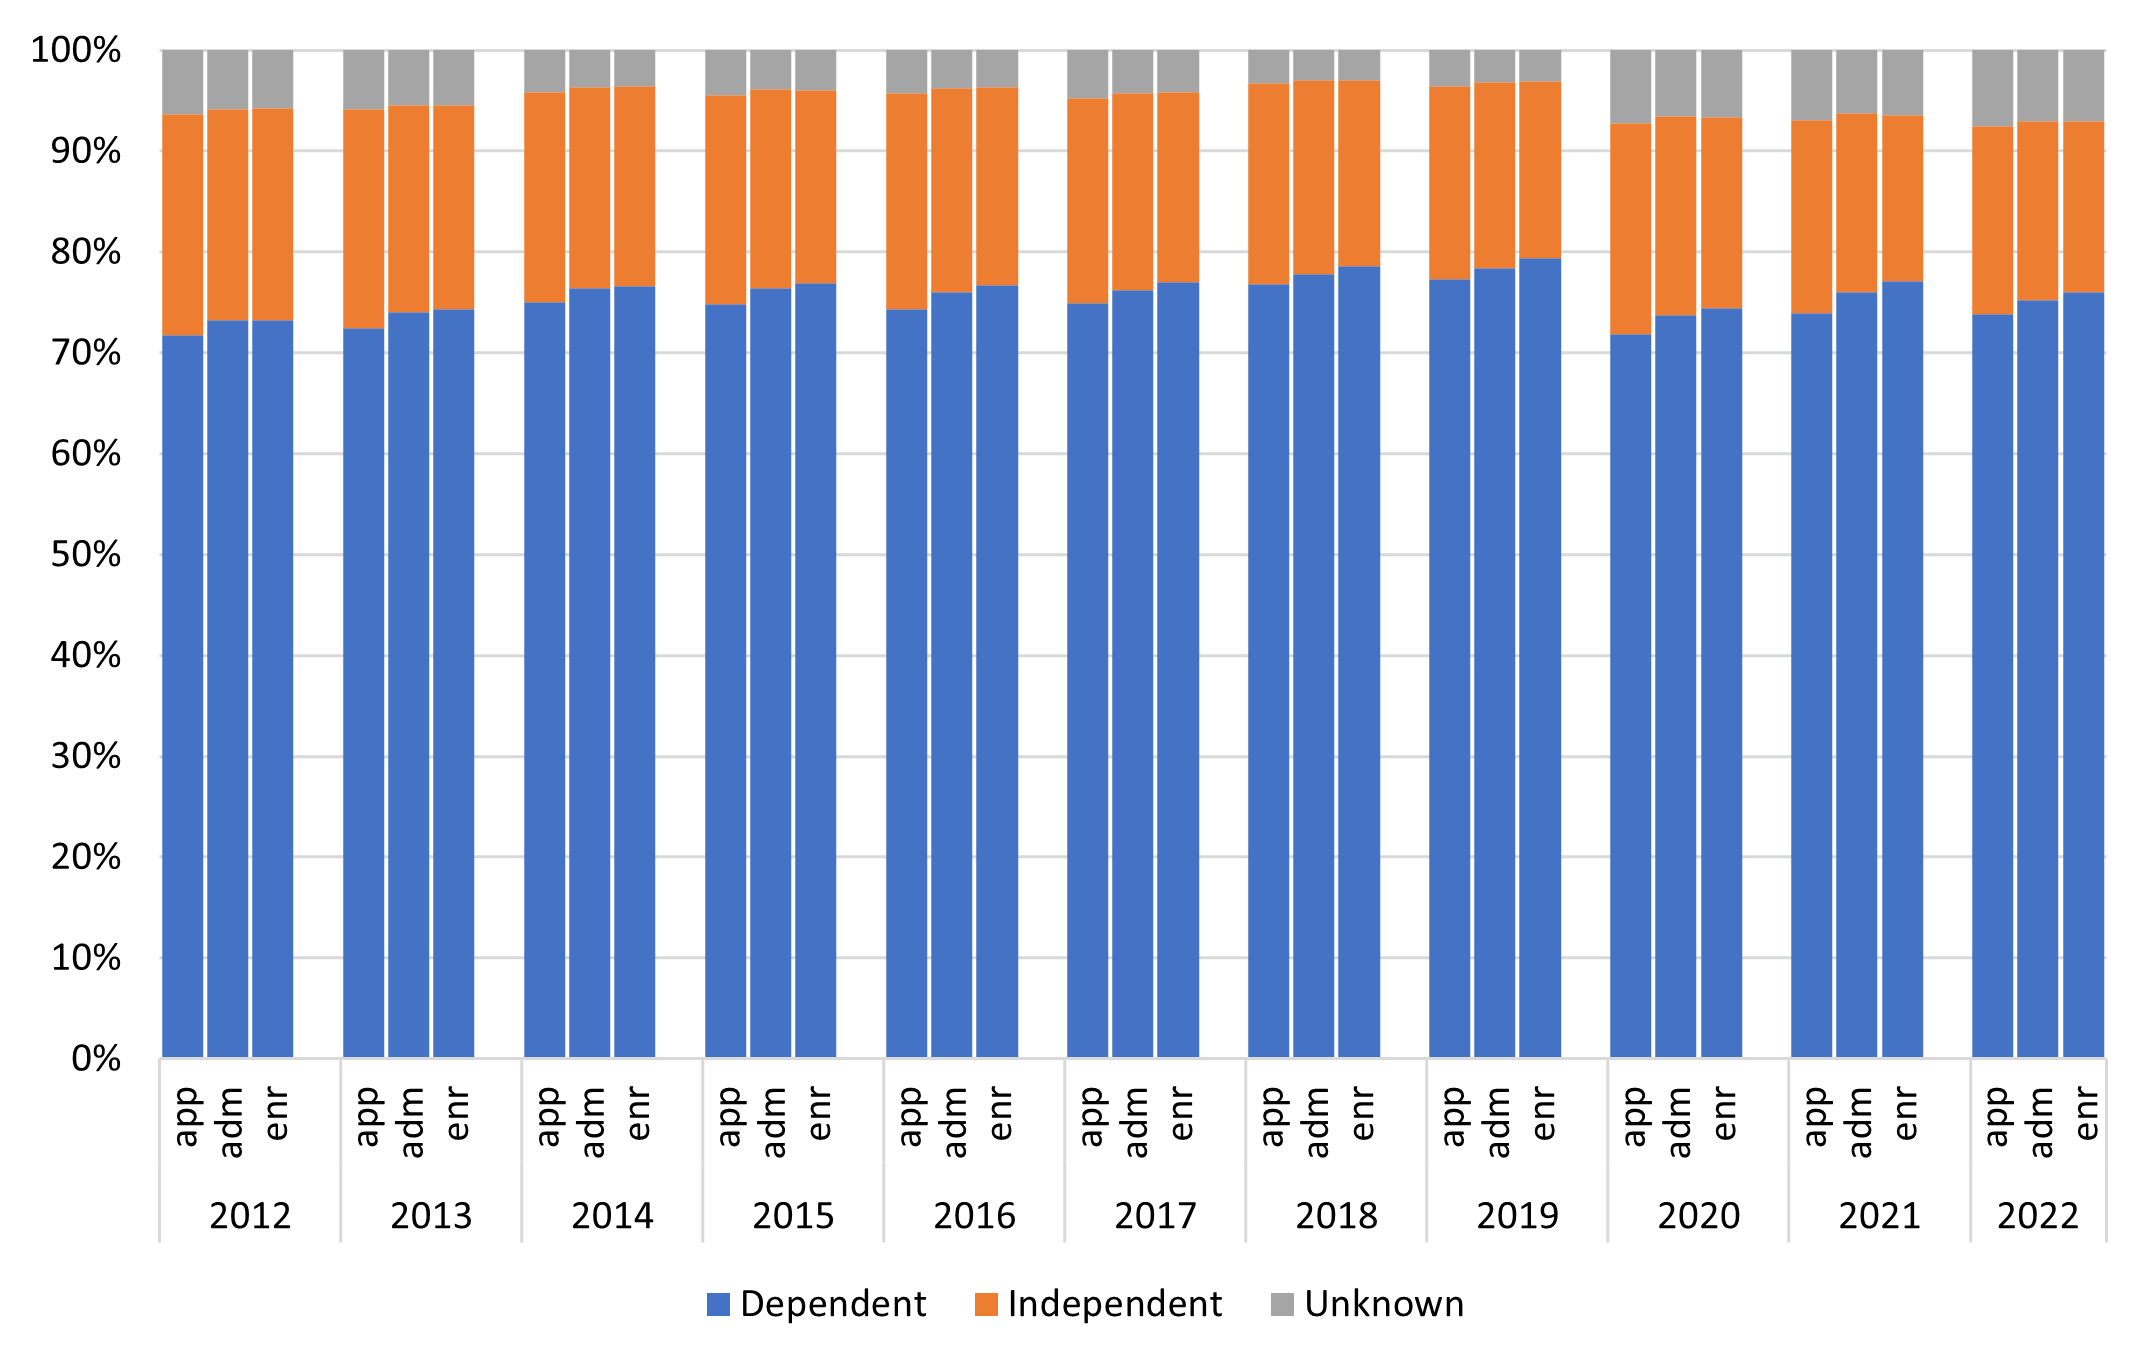
The share of dependent transfer applicants, admits, and enrollees with parents’ income under $50,000 has stayed about the same in recent years.
1.2.6 Undergraduate transfer applicants, admits, and enrollees by self-reported parents’ income, Universitywide1, Fall 2012 to 2022
Share of undergraduate transfer applicants, admits, and enrollees by dependency2
Share of undergraduate dependent transfer applicants, admits, and enrollees by income range
Source: UC Data Warehouse
In fall 2022, about three-quarters of transfer enrollees were dependent. Almost one-fifth were independent, and the remainder were unknown.
Among dependent transfer enrollees:
- 31 percent had incomes under $50,000
- 19 percent were between $50,000 and $99,999
- 13 percent were between $100,000 and $149,999
- 37 percent were at $150,000 or above
1Dependency status and parents’ income are based on information reported on the application for admission, both of which can vary from that provided on financial aid applications. All dollar amounts are in inflation-adjusted 2022 dollars.
2To be considered independent, a student must be married, have children, be a member of the U.S. military on active duty or have served on active duty, or be age 24 by by the time they enroll at UC. All others who provided income information are considered dependent.
Freshmen entering UC are increasingly well prepared based on high school GPA and A–G course completion rates.
1.3.1 A–G (college preparatory)1 courses and weighted, capped high school grade point average (GPA)2 of entering freshmen, as share of class, Universitywide, Fall 2008 to 2022
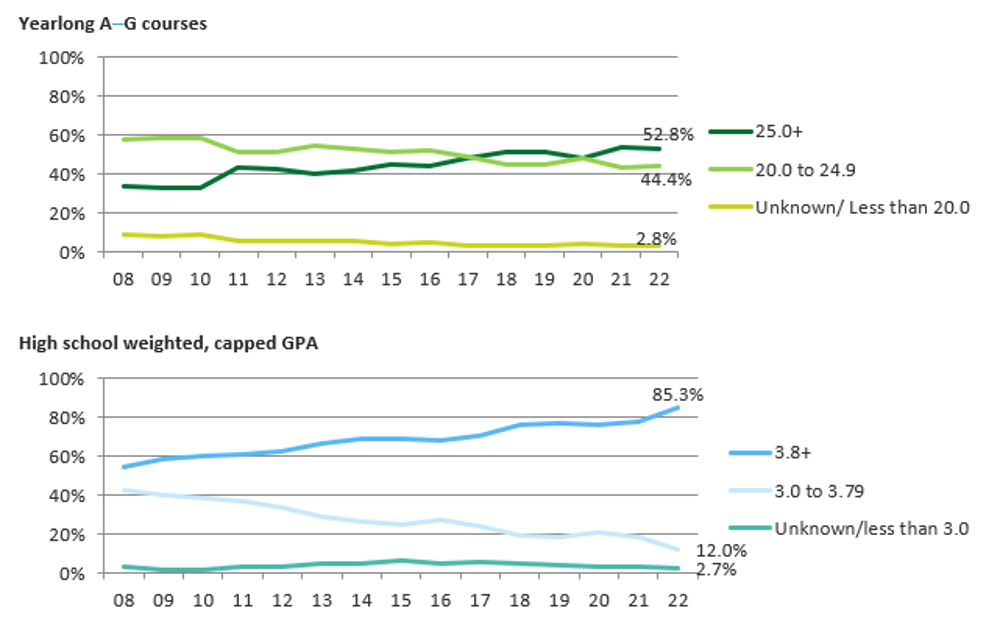
Source: Apply UC data (A–G courses) and UC Data Warehouse (GPA)
From 2008 to 2022, the share of students completing 25 or more college-preparatory courses went up from 33 percent to 53 percent, while the share having a high school GPA of 3.8 or higher went up from 54 percent to 85 percent.
Recent increases in the share of students with higher GPAs may reflect the COVID-19 era policies allowing students to opt for Pass/No Pass grading for some or all A–-G courses.
1A–G courses refer to those high school courses that UC has reviewed and approved as college preparatory. The minimum number of required A–G courses is 15.
2Weighted, capped GPA means that students may receive a maximum of eight semesters of honors credit. More information is available at the UC Admissions website.
UC transfer students entering in fall 2022 performed better academically than their counterparts a decade ago, as measured by their grades in pre-UC college courses.
1.3.2 College grade point average (GPA)1 of entering transfer students, as share of class, Universitywide, Fall 2008 to 2022
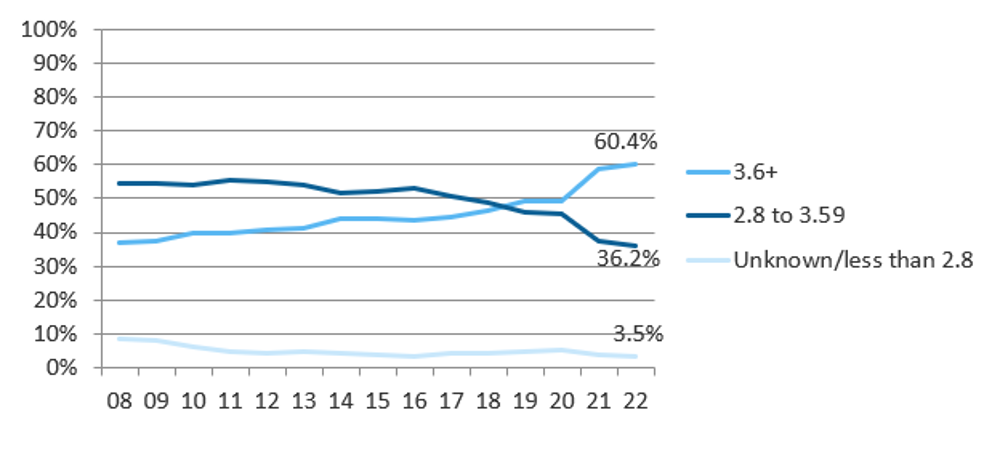
Source: UC Data Warehouse and UC Corporate Student System
The academic qualifications of transfer students entering UC have improved over time, as reflected by an increase in the share of students having a 3.6 or higher college GPA, from 37 percent in fall 2008 to 60 percent in fall 2022. The notable increase in higher GPAs in recent years may be due in part to the increase in Pass/No Pass grading during the COVID era.
1 The transfer GPA is based on grades for college-level academic courses from the college(s) where students were previously enrolled.
UC has consistently had a substantially lower proportion of out-of-state undergraduates than other AAU universities in recent years. In fall 2022, only 17.5 percent of UC’s enrollees were out-of-state or international, compared with 32.5 percent for other AAU Public institutions.
1.4.1 Residency of undergraduate students, Universitywide and comparison institutions, Fall 2022
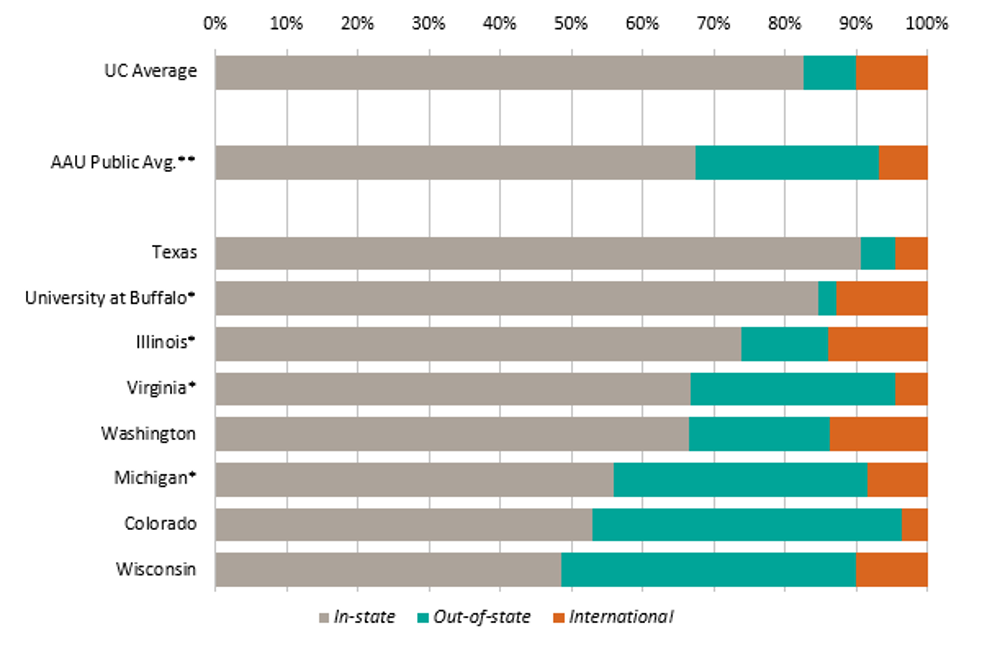
Source: UC Data Warehouse (UC numbers) and Common Data Set (comparator numbers)
Nonresidents provide geographic and cultural diversity to the student body. They also pay the full cost of their education. In 2022–23, systemwide tuition and fees for a nonresident undergraduate were $44,130, compared to $13,104 for California resident students.
Nonresident applicants must meet higher criteria to be considered for admission. The minimum high school GPA for nonresident freshmen is 3.4, compared to 3.0 for California freshmen. The minimum college GPA for nonresident transfer students is 2.8, compared to 2.4 for California residents.
*UC’s four comparison public institutions.
*AAU public average excludes UC; also excludes University of Missouri Columbia, University of Florida. And Rutgers New Brunswick because data was not available.
The proportion of undergraduate students paying nonresident supplemental tuition increased slightly in 2021–22.
1.4.2 Percentage of undergraduate enrollees paying nonresident supplemental tuition by academic year1, Universitywide, 2008–09 to 2021–22
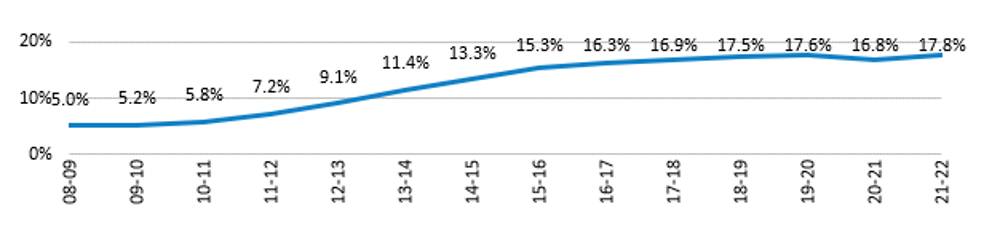
Source: UC Data Warehouse
Systemwide, the share of all undergraduates paying nonresident supplemental tuition (NRST) increased slightly from 16.8 percent in 2020–21 to 17.8 percent in 2021–22. Over the last decade, this share rose from 7.2 percent in 2011–12 to 17.8 percent in 2021–22. From 2009–10 to 2015–16, the proportion of undergraduates paying NRST went up from 5.2 percent to 15.3 percent. Starting in 2016–17, as enrollment of new California residents increased, the proportion of undergraduates paying NRST leveled off in the 16–18 percent range.
The proportion of nonresident students at individual campuses varies depending on a campus’ capacity, and its ability to recruit nonresident students, as well as its nonresident cap under a policy approved in May 2017, which applies to total undergraduate numbers. Under the policy, effective in 2018–19, nonresident enrollment was limited to 18 percent at five UC campuses. At the other four campuses where the proportion of nonresidents already exceeded 18 percent — UC Berkeley, UC Irvine, UCLA, and UC San Diego — nonresident enrollment is capped at the proportion that each campus enrolled in 2017–18.
1This chart uses year average headcount enrollment, the average headcount across all terms in the academic year (three quarters or two semesters). Not all nonresident students pay nonresident supplemental tuition. Some have statutory exemptions, such as AB 540 students, children of UC employees, and others designated by the state. AB 540 students are considered California residents for tuition purposes as established by Assembly Bill 540, passed in 2001.
UC campuses draw freshmen from nearby regions and the major urban areas of California, with a systemwide local attendance rate of 34 percent.
1.4.3 Percentage of new California resident1 freshman enrollees whose home is within a 50-mile radius of their campus, UC campuses, Fall 2022
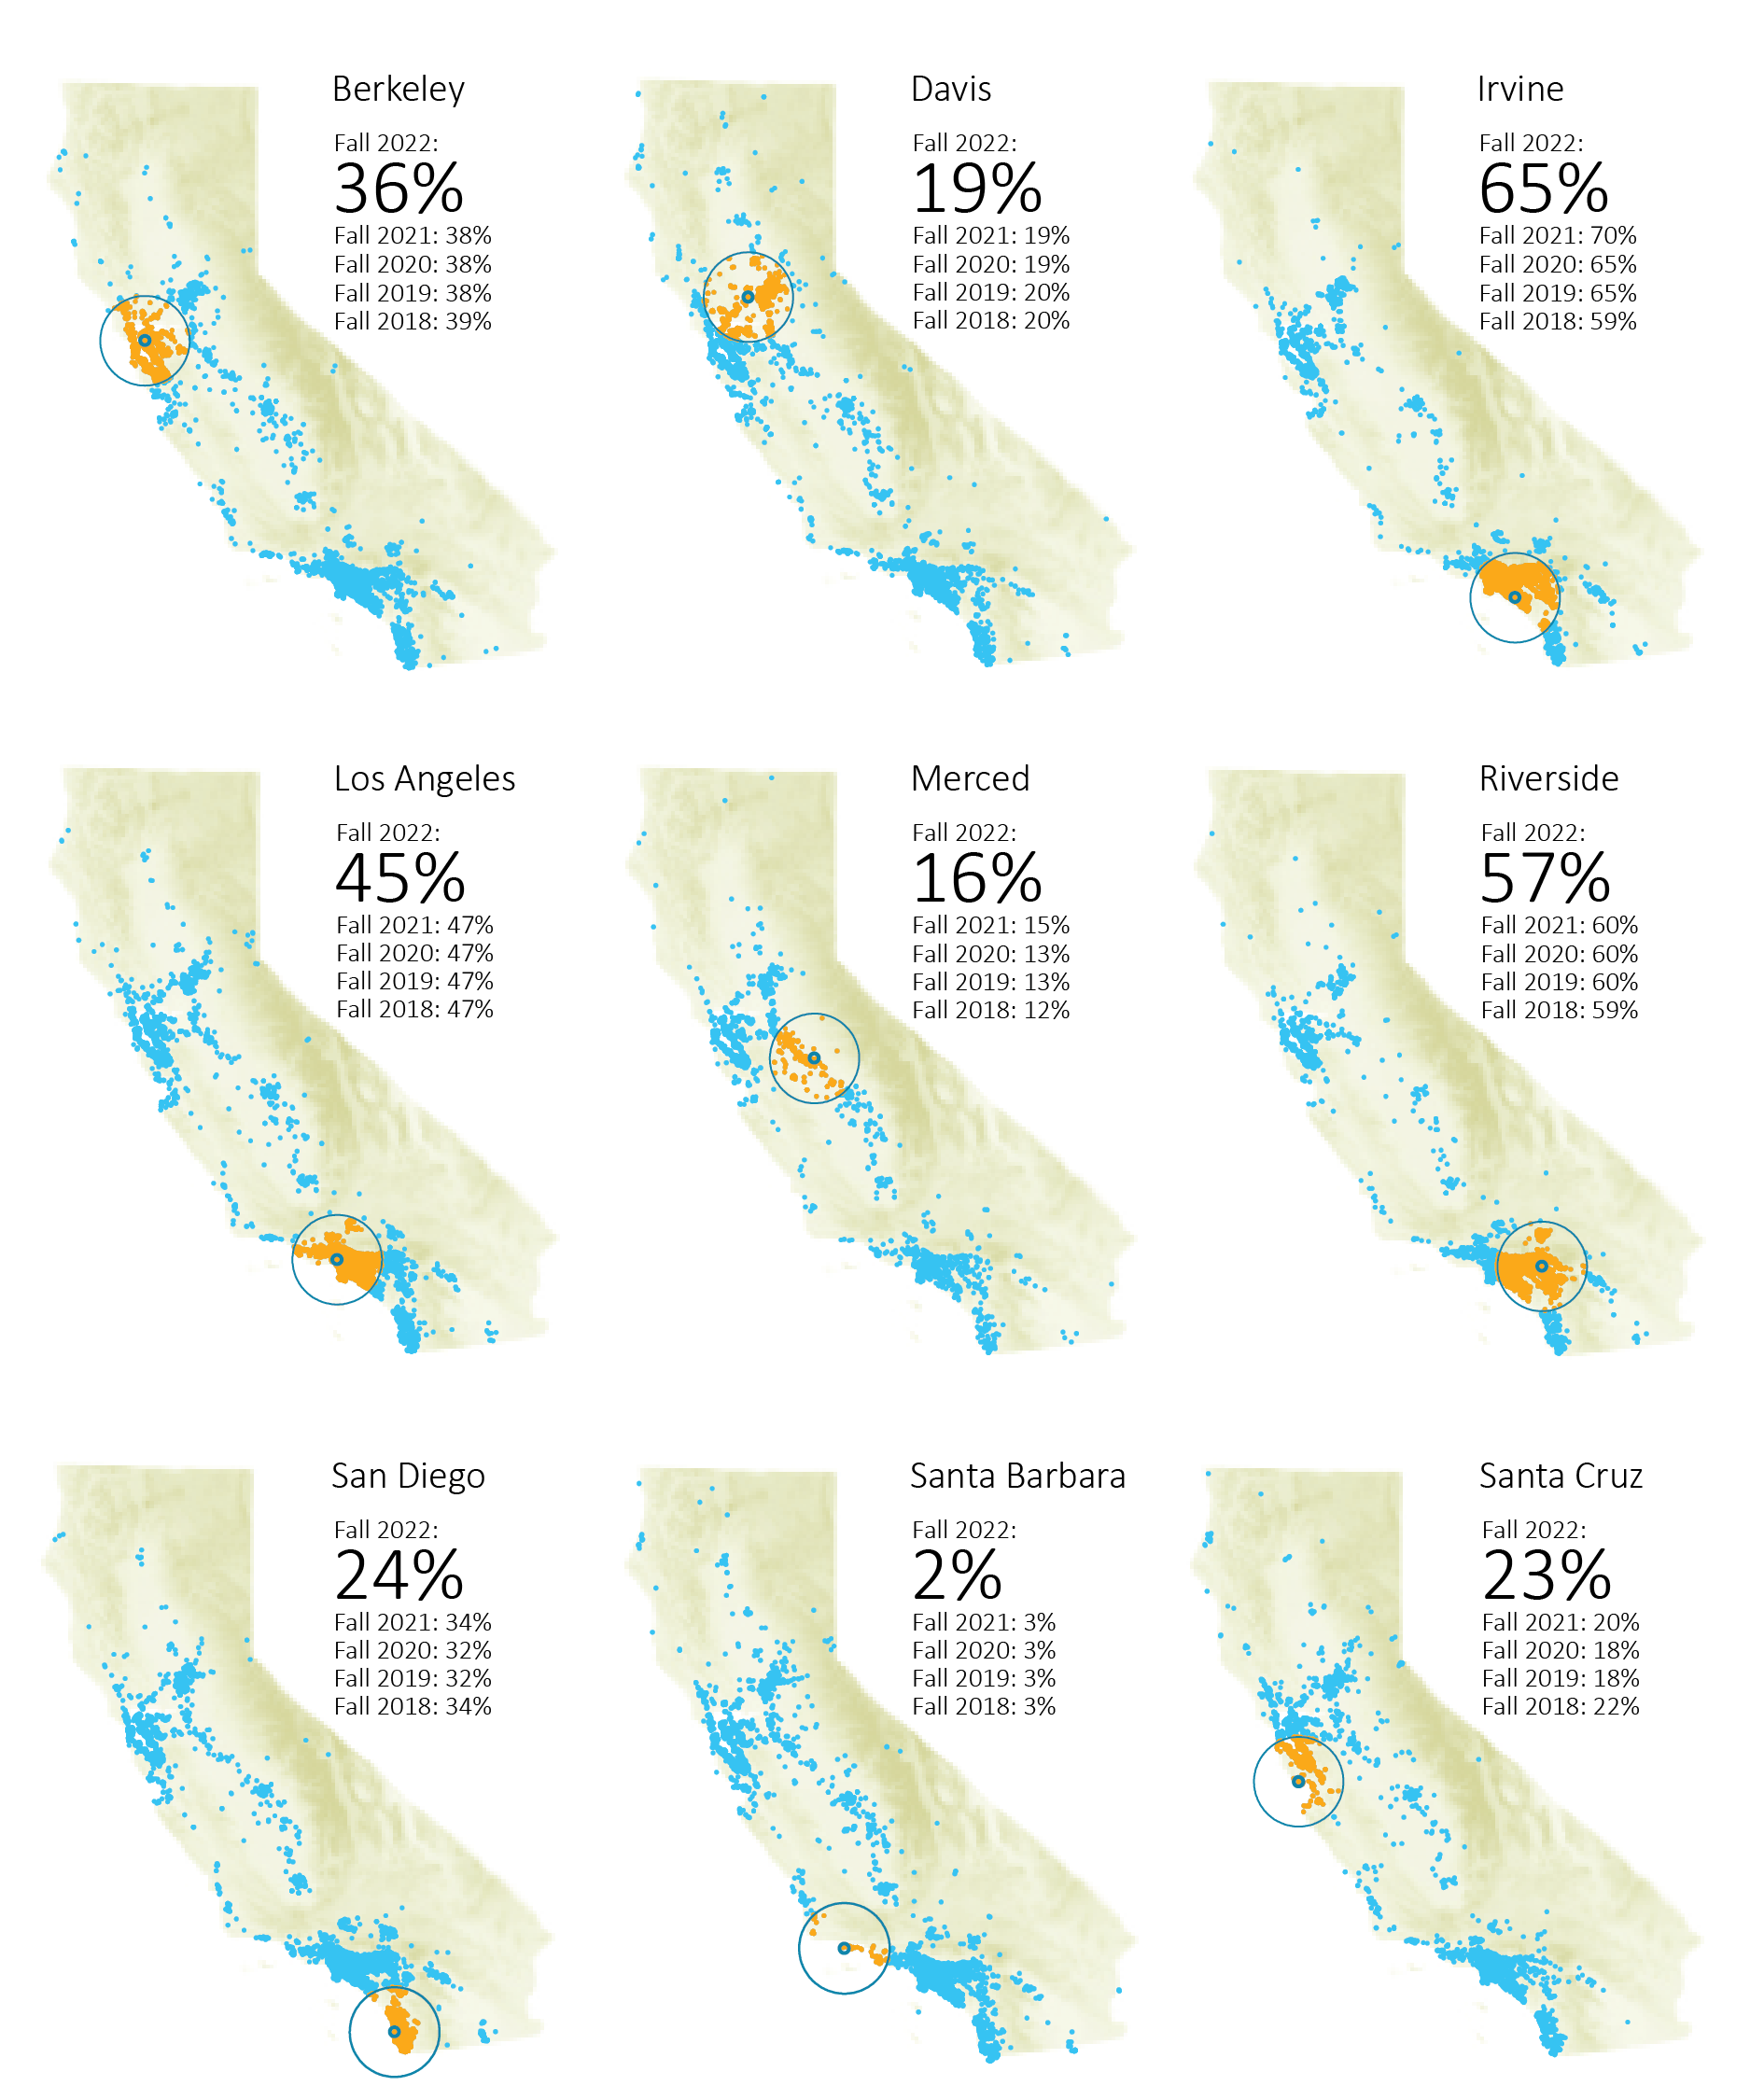
Source: UC Data Warehouse and UC Corporate Student System.
1California residents are defined here as those with permanent addresses in California.
Local area enrollment rates for transfers are higher than for freshmen, with 46 percent enrolling at a UC campus within 50 miles of their homes.
1.4.4 Percentage of new California resident transfer enrollees whose home is within a 50-mile radius of their campus, UC campuses1, Fall 2022
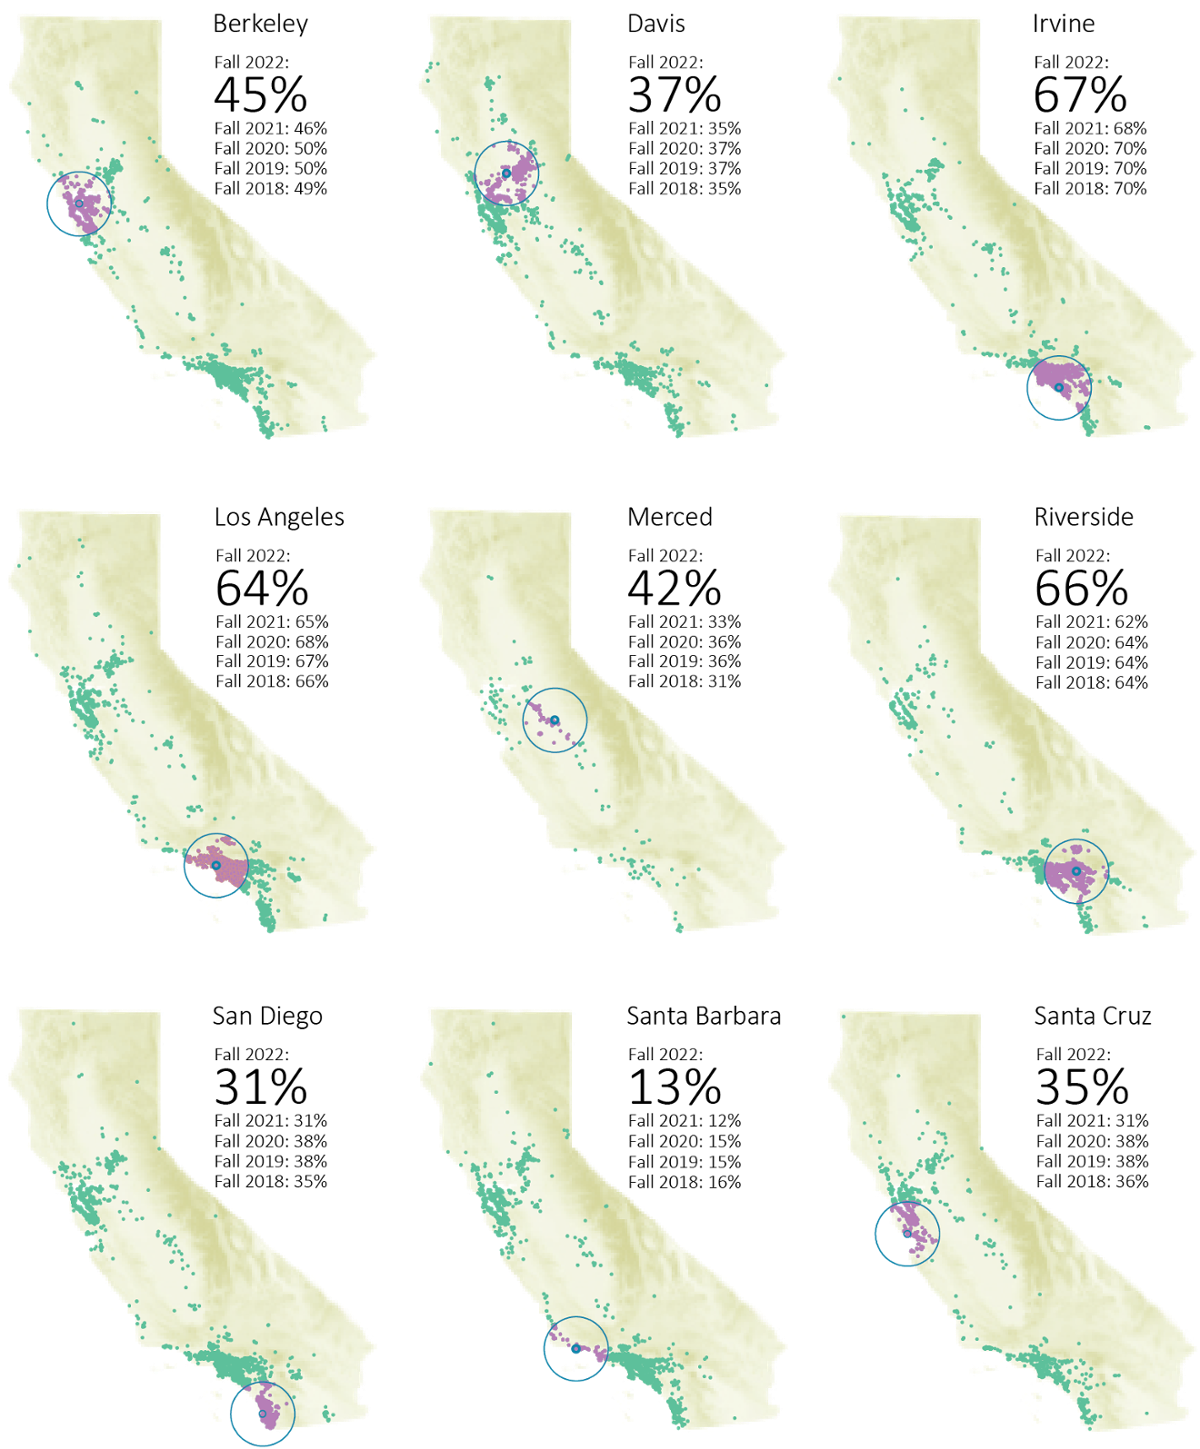
Source: UC Data Warehouse and UC Corporate Student System.
1California residents are defined here as those with permanent addresses in California.