Overview
The three-pronged mission of the University of California includes teaching, research, and public service, none of which can be accomplished without the support of staff who organize and facilitate all that is required to do the work of the University.
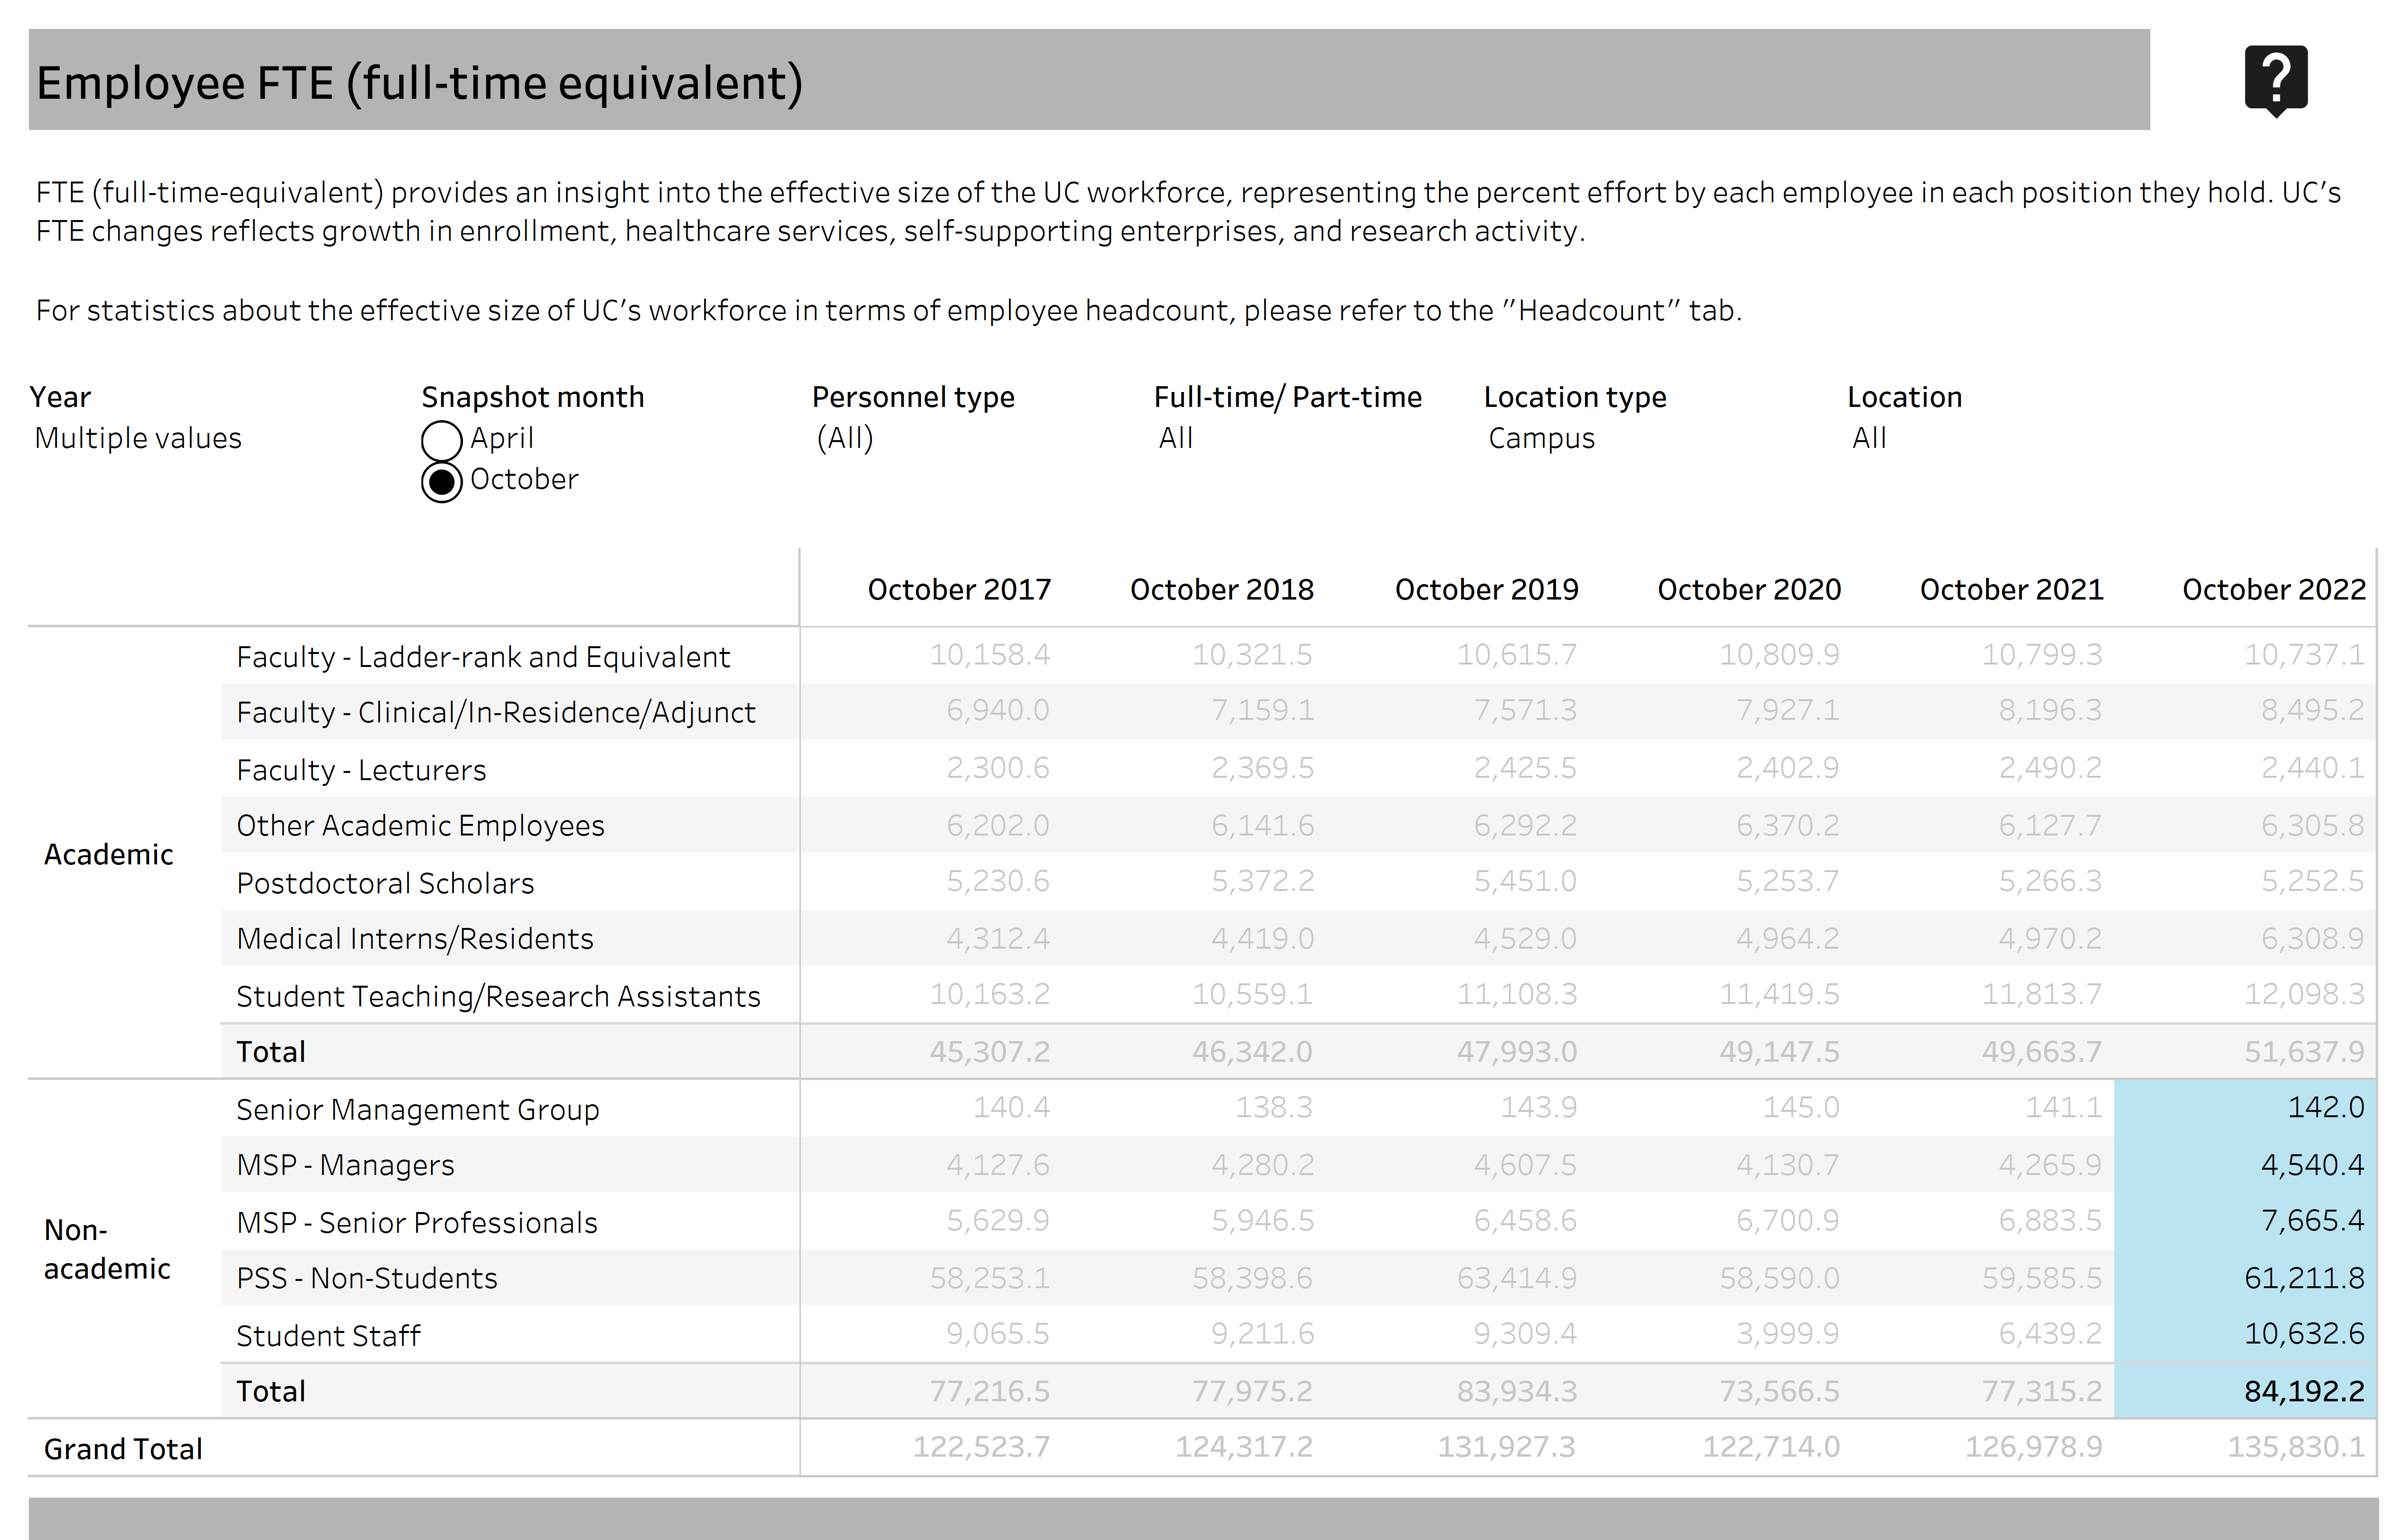
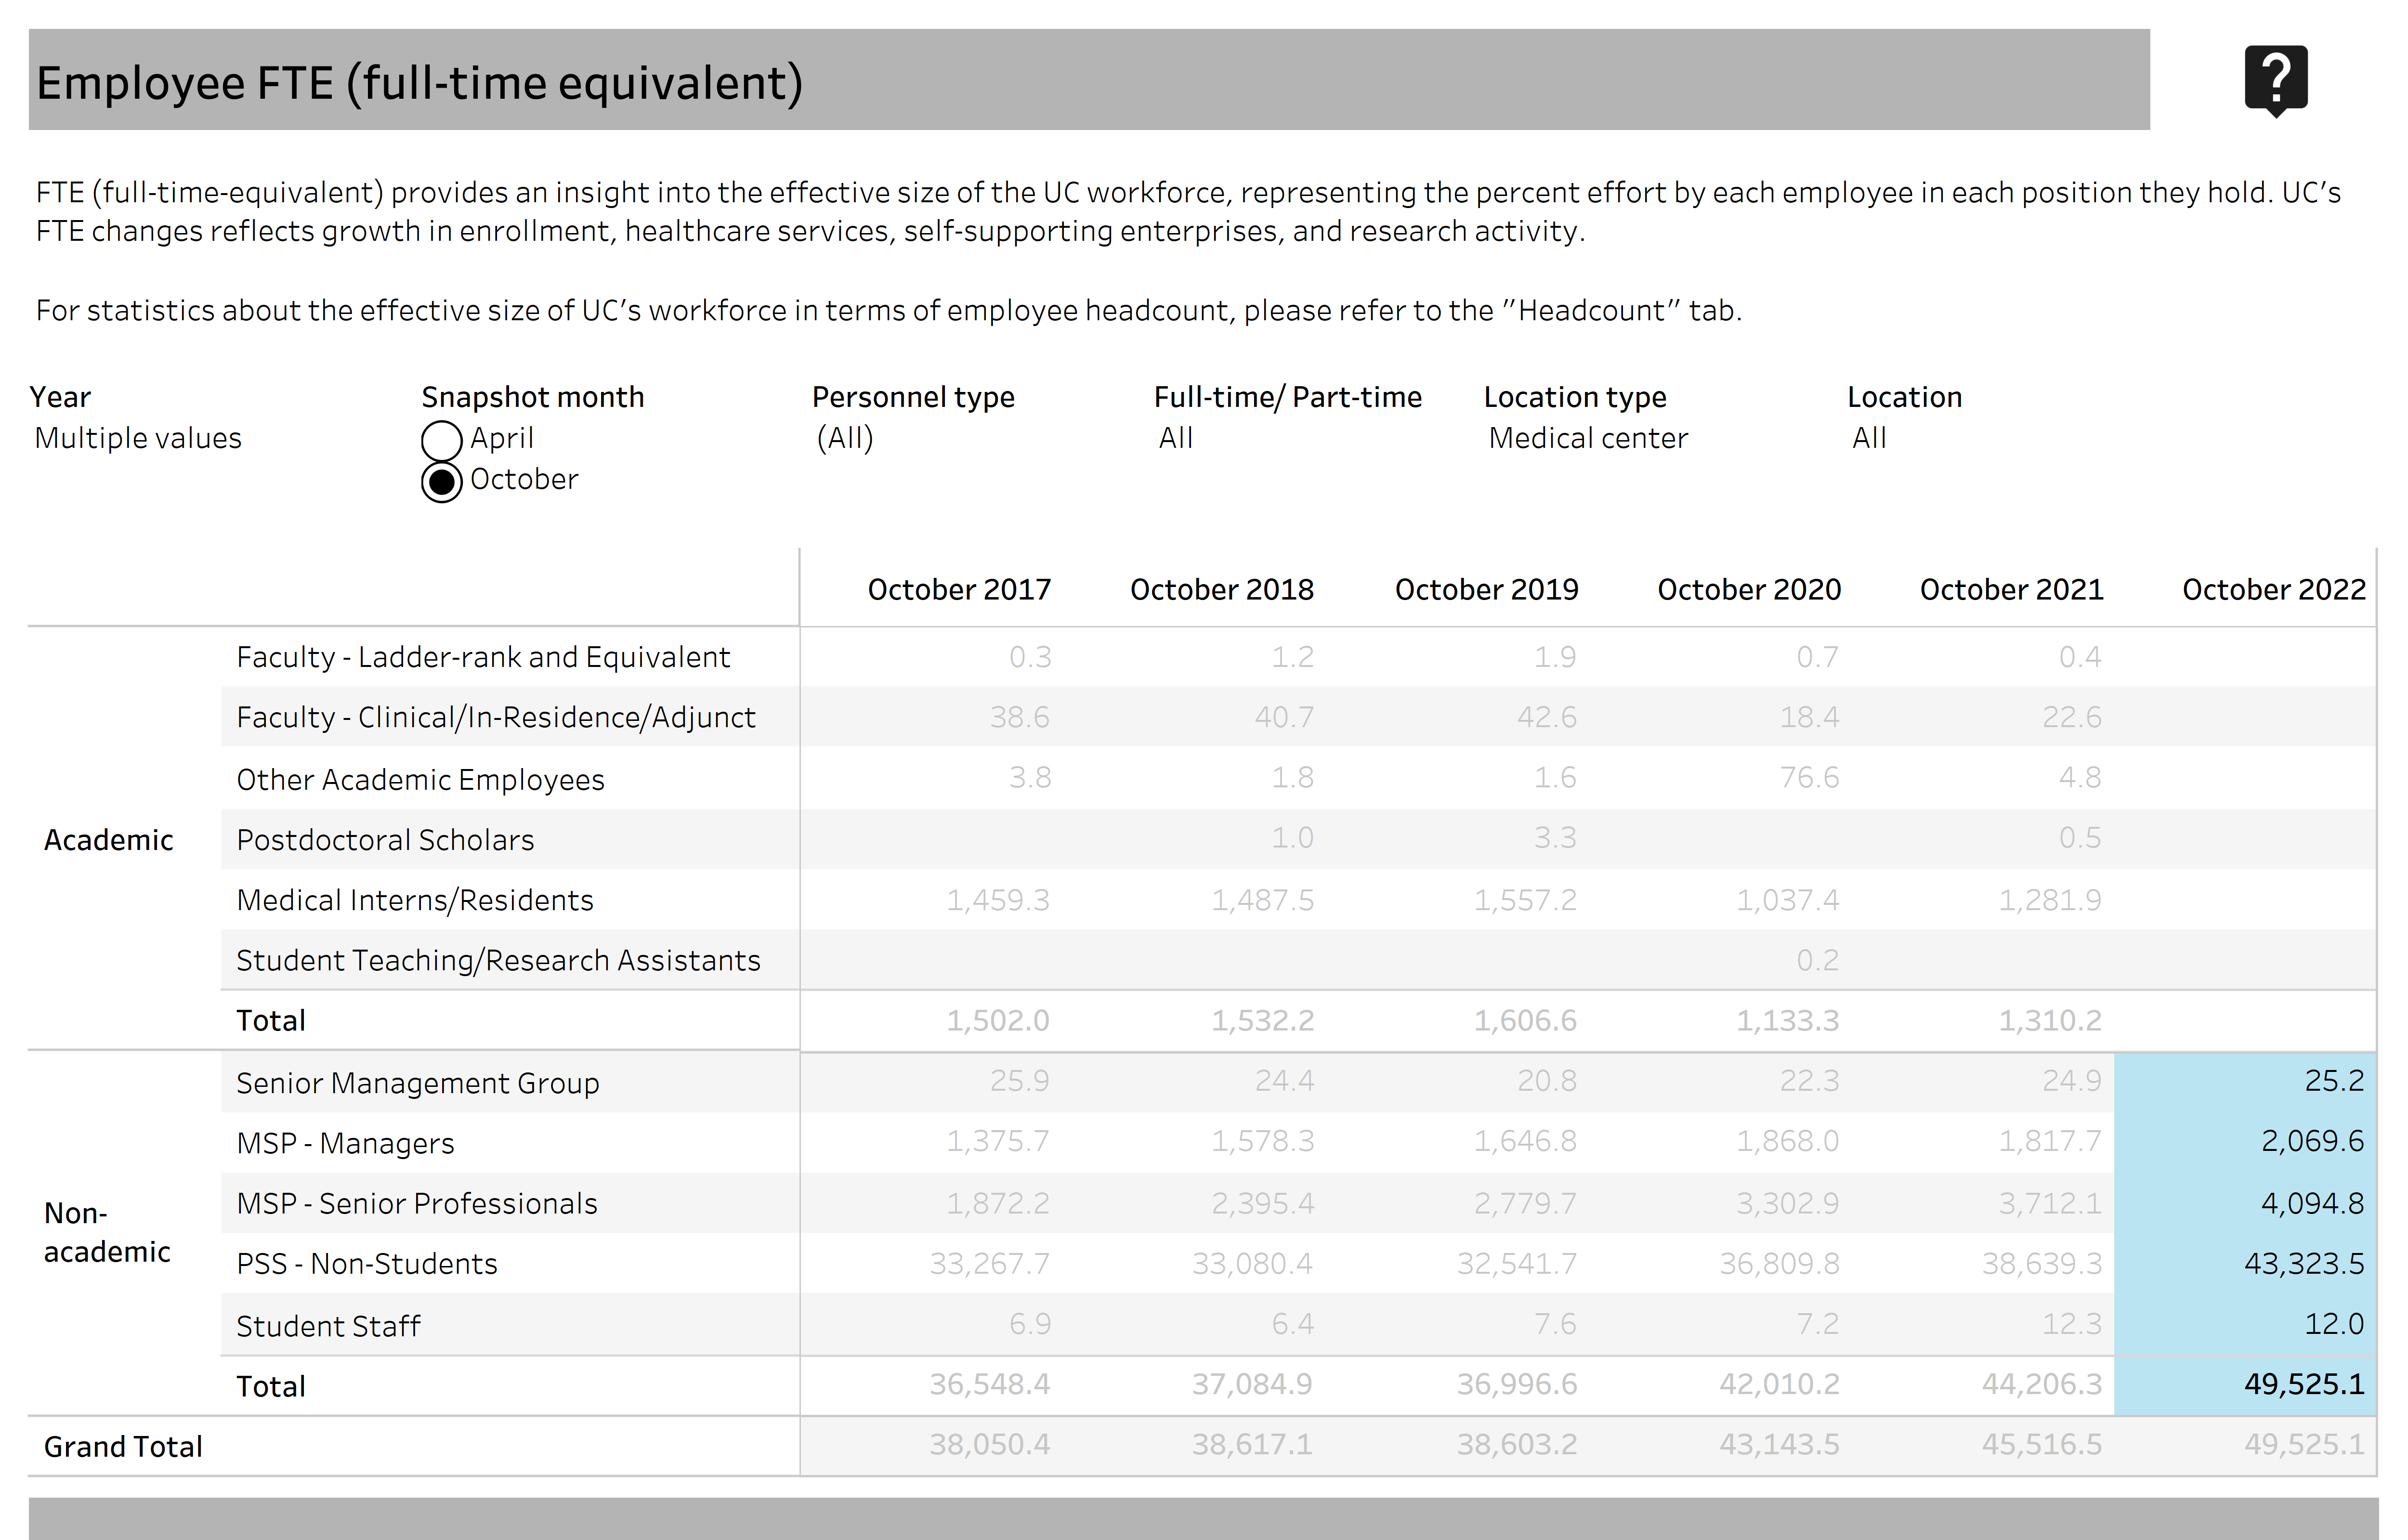
As of October 2022, staff FTE was 84,192 on the campuses and 49,525 at the medical centers.
6.1.1 Staff Full-time Equivalent (FTE)

UC employees, full-time equivalent (FTE) dashboard campus staff
UC employees, full-time equivalent (FTE) dashboard medical centers staff
General campus, non-student staff has seen the greatest growth amongst senior professionals, due to both the introduction of Career Tracks and the professionalization of UC’s workforce towards high-skilled analysis and technical capabilities. Career Tracks is a function-specific, market-aligned job classification system that applies consistent interpretations of which positions are Management and Senior Professional (MSP) and which are Professional and Support Staff (PSS). Within PSS, there has been a significant shift away from clerical roles into student services positions and administrative analysis to manage growing campuses and student bodies.
UC operates six health systems with five academic medical centers as well as schools of medicine, dentistry, nursing, and other health sciences education and research programs. The growth of University of California Health FTE is also driven by service expansions, such as increases in inpatient days as well as outpatient/emergency visits.
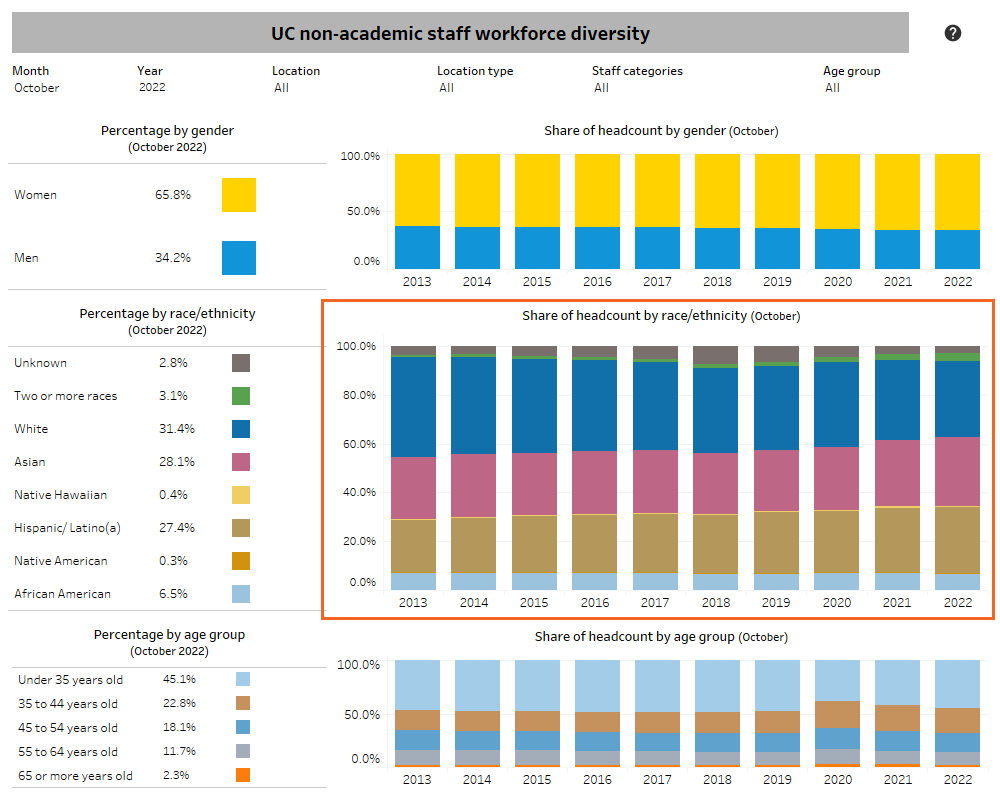
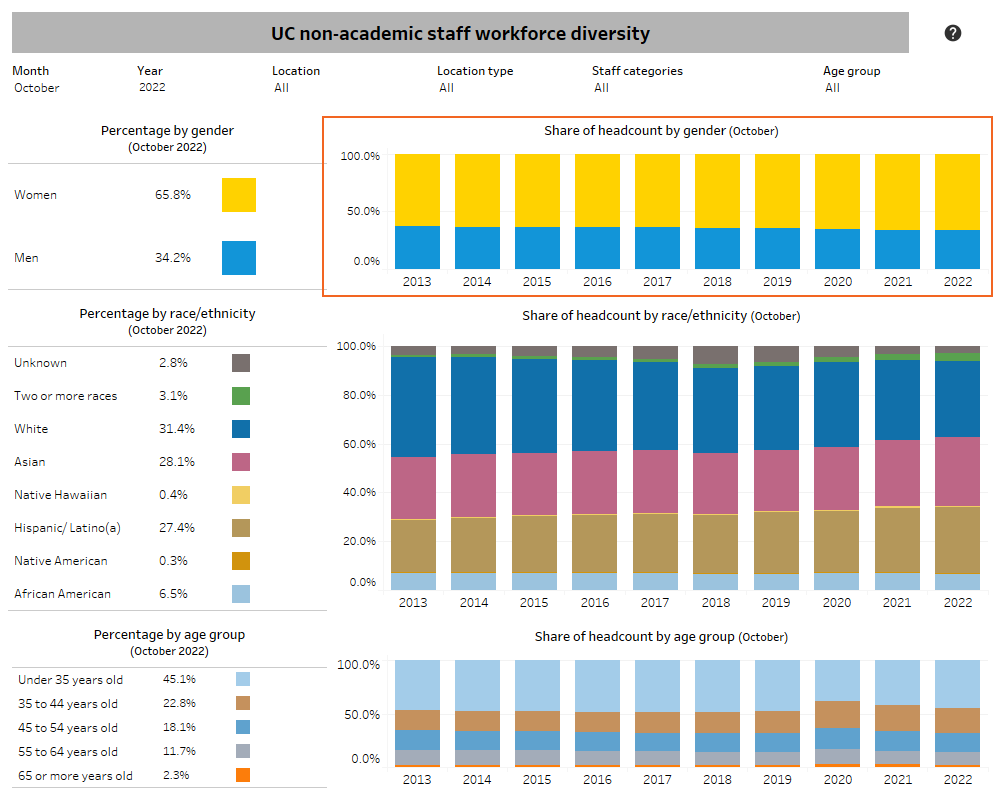
The proportion of underrepresented staff represented 35% of the workforce in April 2023, up from 29% in April 2014. In April 2023, women were 43% of senior management, 61% of managers, 55% of senior professionals, and 67% of professional and support staff.
6.1.2 Racial/ethnic diversity of staff by personnel program
UC workforce diversity dashboard
6.1.3 Gender diversity of staff by personnel program
UC workforce diversity dashboard
In 2015-16 through 2019-20, merit-based salary increases averaging 3% for policy-covered staff were implemented. For these employees, were no salary increases in 2020-21, increases of 3% in 2021-22, 4.5% in 2022-23, and 4.6% in 2023-24.
6.2.1 Increases in funding for staff salaries compared to market
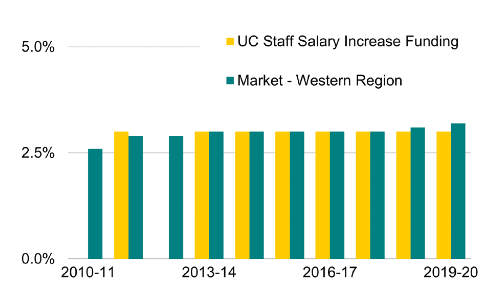
Source: UC Budget for Current Operations 2023-24; sourced from World at Work Annual Salary Budget Survey, which represents data from over 1,000 employers from all sectors in the western United States.
UC chancellors are among the lowest-paid when compared to their Association of American Universities (AAU) peers, based on the most recent comparative data.
6.2.2 Base salaries and additional pay for UC and AAU institution leaders
Comparative salaries of chancellors and system leaders dashboard

UC chancellors continue to be among the lowest-paid university leaders compared with their AAU peers. Nine UC chancellor salaries fall among the lowest third in this group. UC San Francisco, an exclusively graduate health science campus, is the only exception.
The separation rate among career staff was 7.2 percent in FY 2023, down from 8.6 percent in the previous fiscal year.
6.3.1 Separation rate for career staff
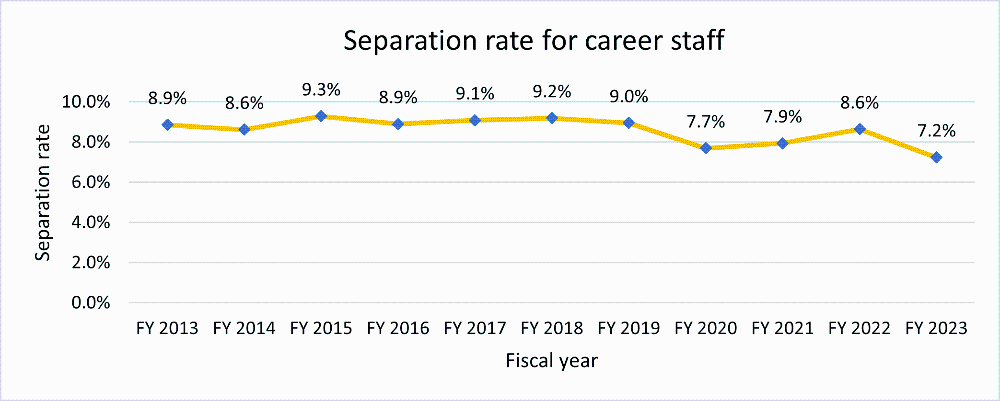
Source: UCPath and CPS
6.3.2 Separation reasons for career staff, FY 2023
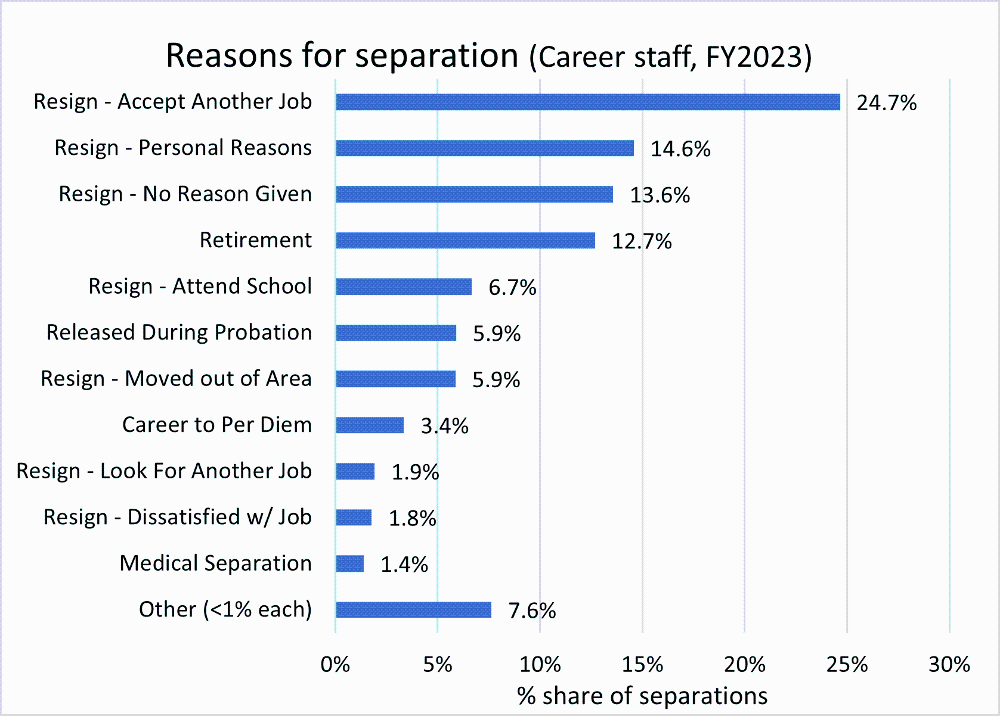
Source: UCPath
Campuses experience a wide range of separation rates among their career staff, which may reflect different mixes of employees, work environments, and local job markets. High turnover is often expensive in terms of lost productivity, lost institutional knowledge, and replacement costs.