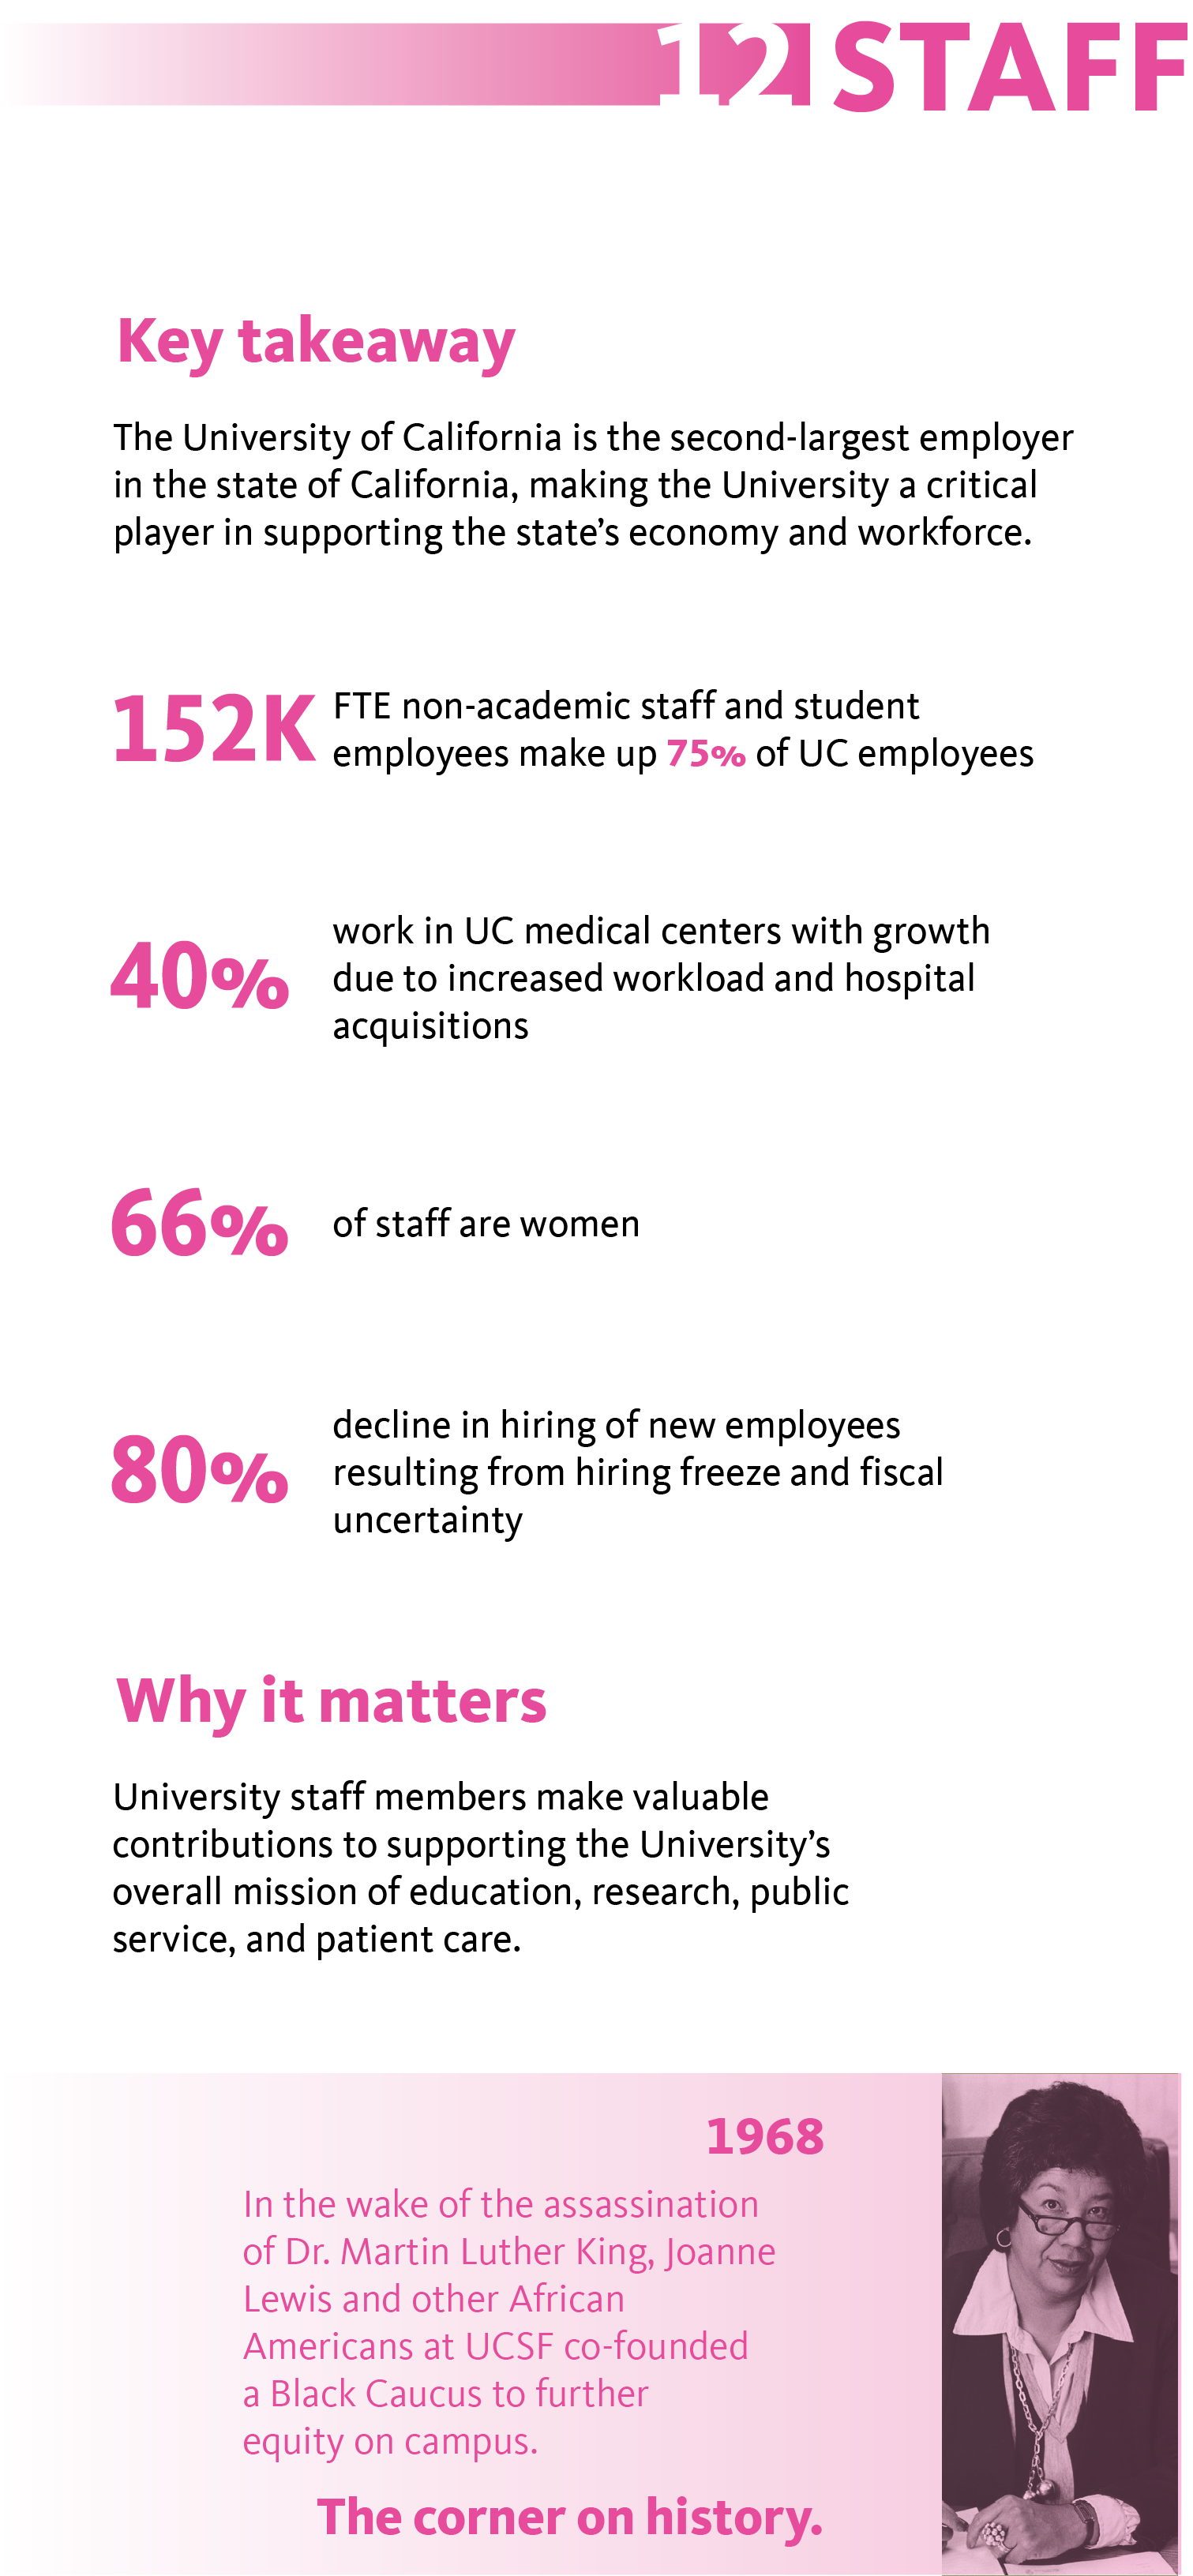
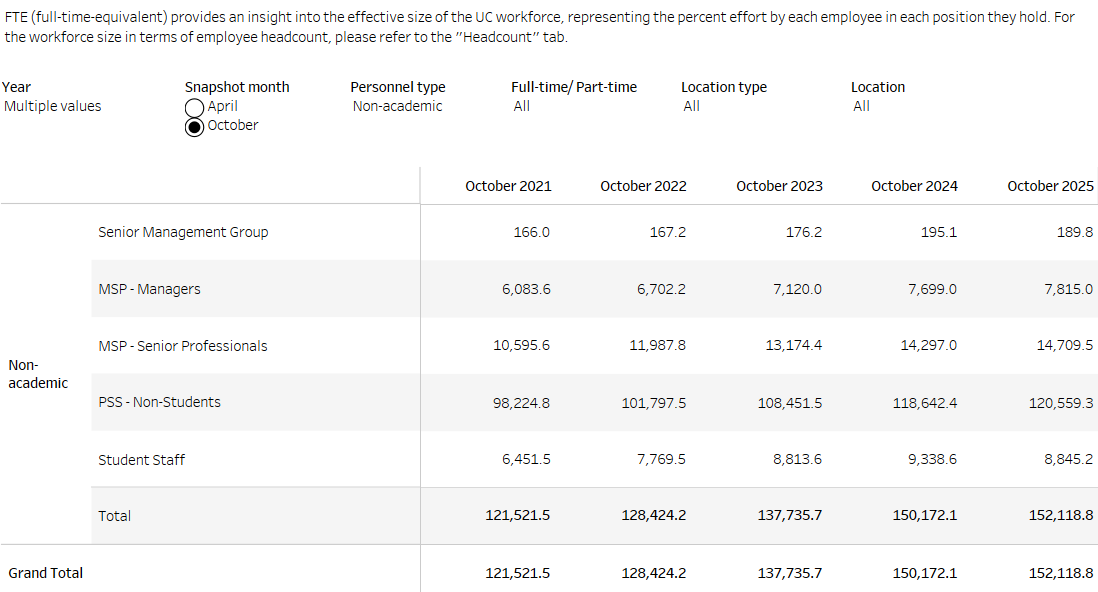
UC is California’s second-largest employer. As of October 2025, UC’s total non-academic staff workforce, including medical centers, reached 152,119 FTE, up 25 percent from October 2021.
12.1.1 Staff Full-time Equivalent (FTE)

UC employees, full-time equivalent (FTE) dashboard
source: UC Information Center
UC’s staff workforce growth is primarily driven by the need for more high-skilled professionals and recent expansions of the health enterprise. Senior Professionals grew from 10,596 to 14,710 FTE in last five years, the fastest-growing staff category. UC Health medical centers (including recent hospital acquisitions that added over 8,000 employees) accounted for a significant share of overall staff growth.
Non-management, non-student staff account for 135,269 FTE out of the total 152,119 FTE systemwide.
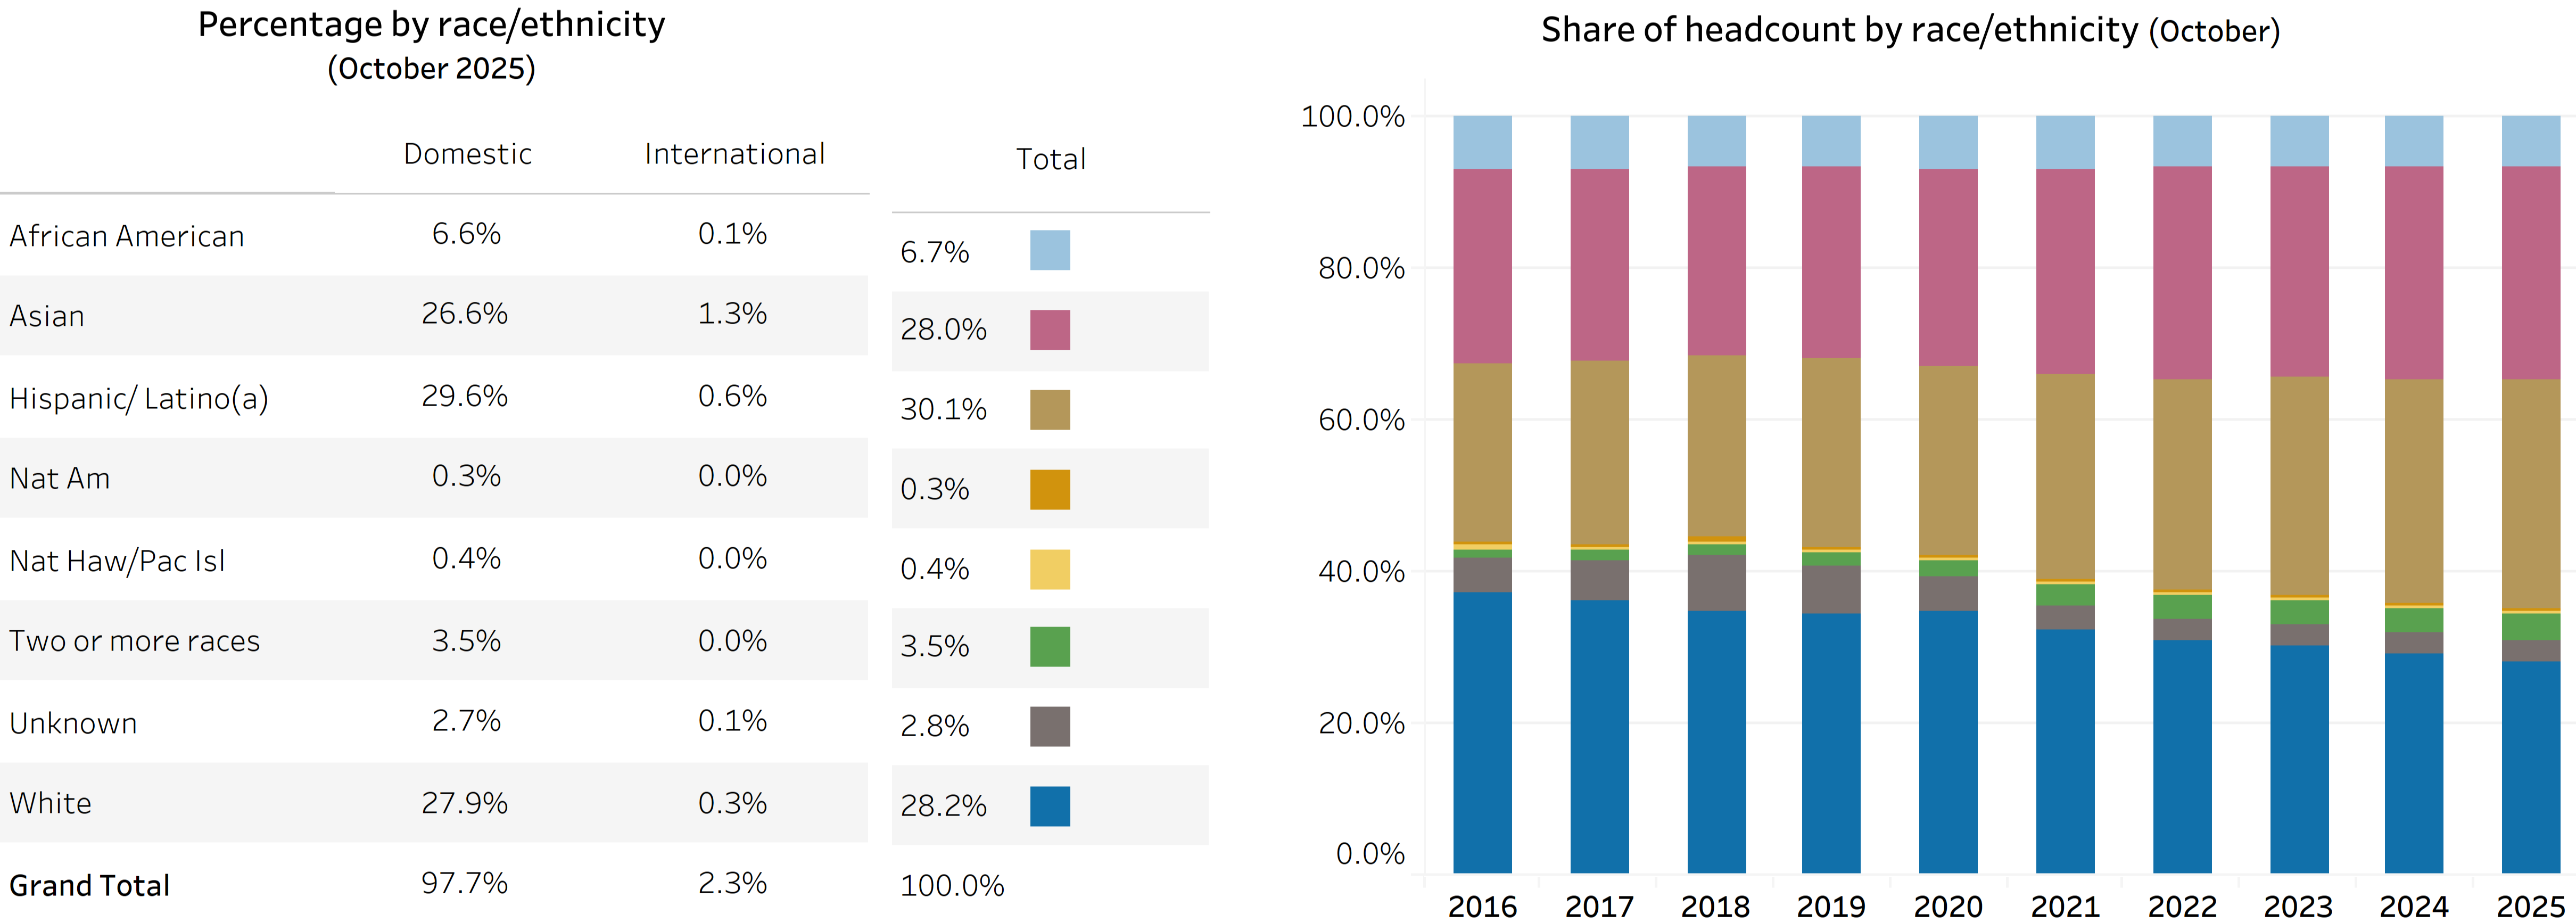
As of October 2025, underrepresented staff make up 37.5 percent of UC’s workforce, up from 31.4 percent a decade ago.
12.1.2 Racial/ethnic diversity of staff
UC workforce diversity dashboard | Academics
source: UC Information Center
A staff workforce that mirrors the communities UC serves strengthens trust, broadens perspectives, and improves outcomes for students and patients alike. Hispanic/Latino(a) staff employees are now the largest group at 30.1 percent, followed by White (28.2 percent) and Asian (28 percent) staff. African American employees represent 6.7 percent of the staff workforce.
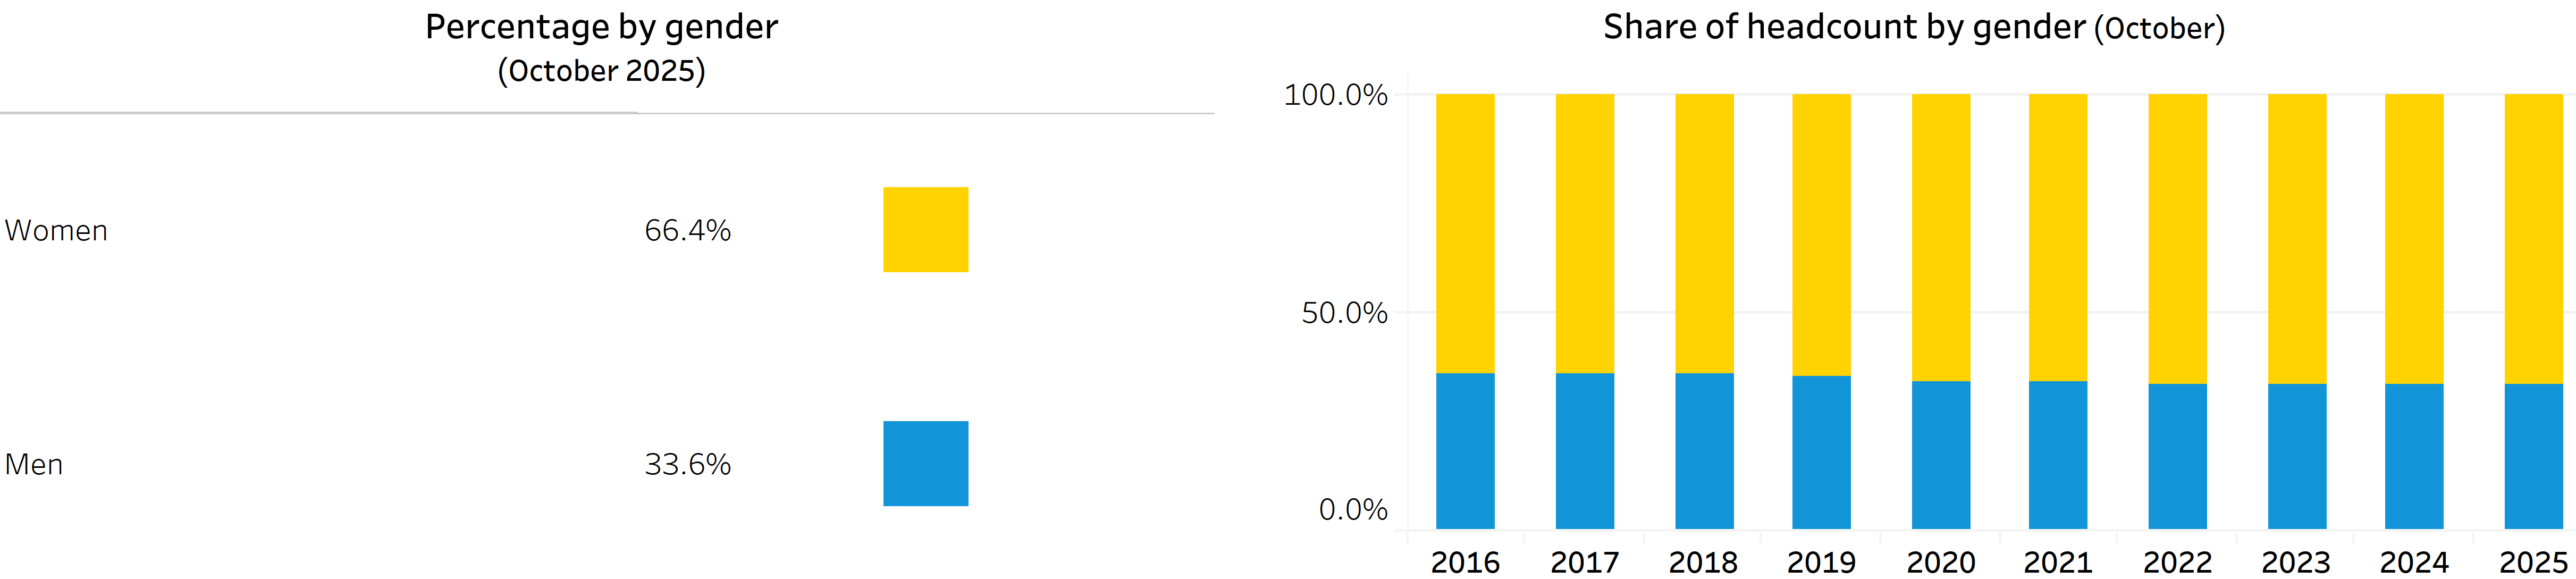
Women now account for 66.4 percent of staff, up from 63.7 percent over the past decade.
12.1.3 Gender diversity of staff
UC workforce diversity dashboard | Academics
source: UC Information Center
The gender split has remained remarkably stable, with women consistently representing roughly two-thirds of UC staff since 2016.
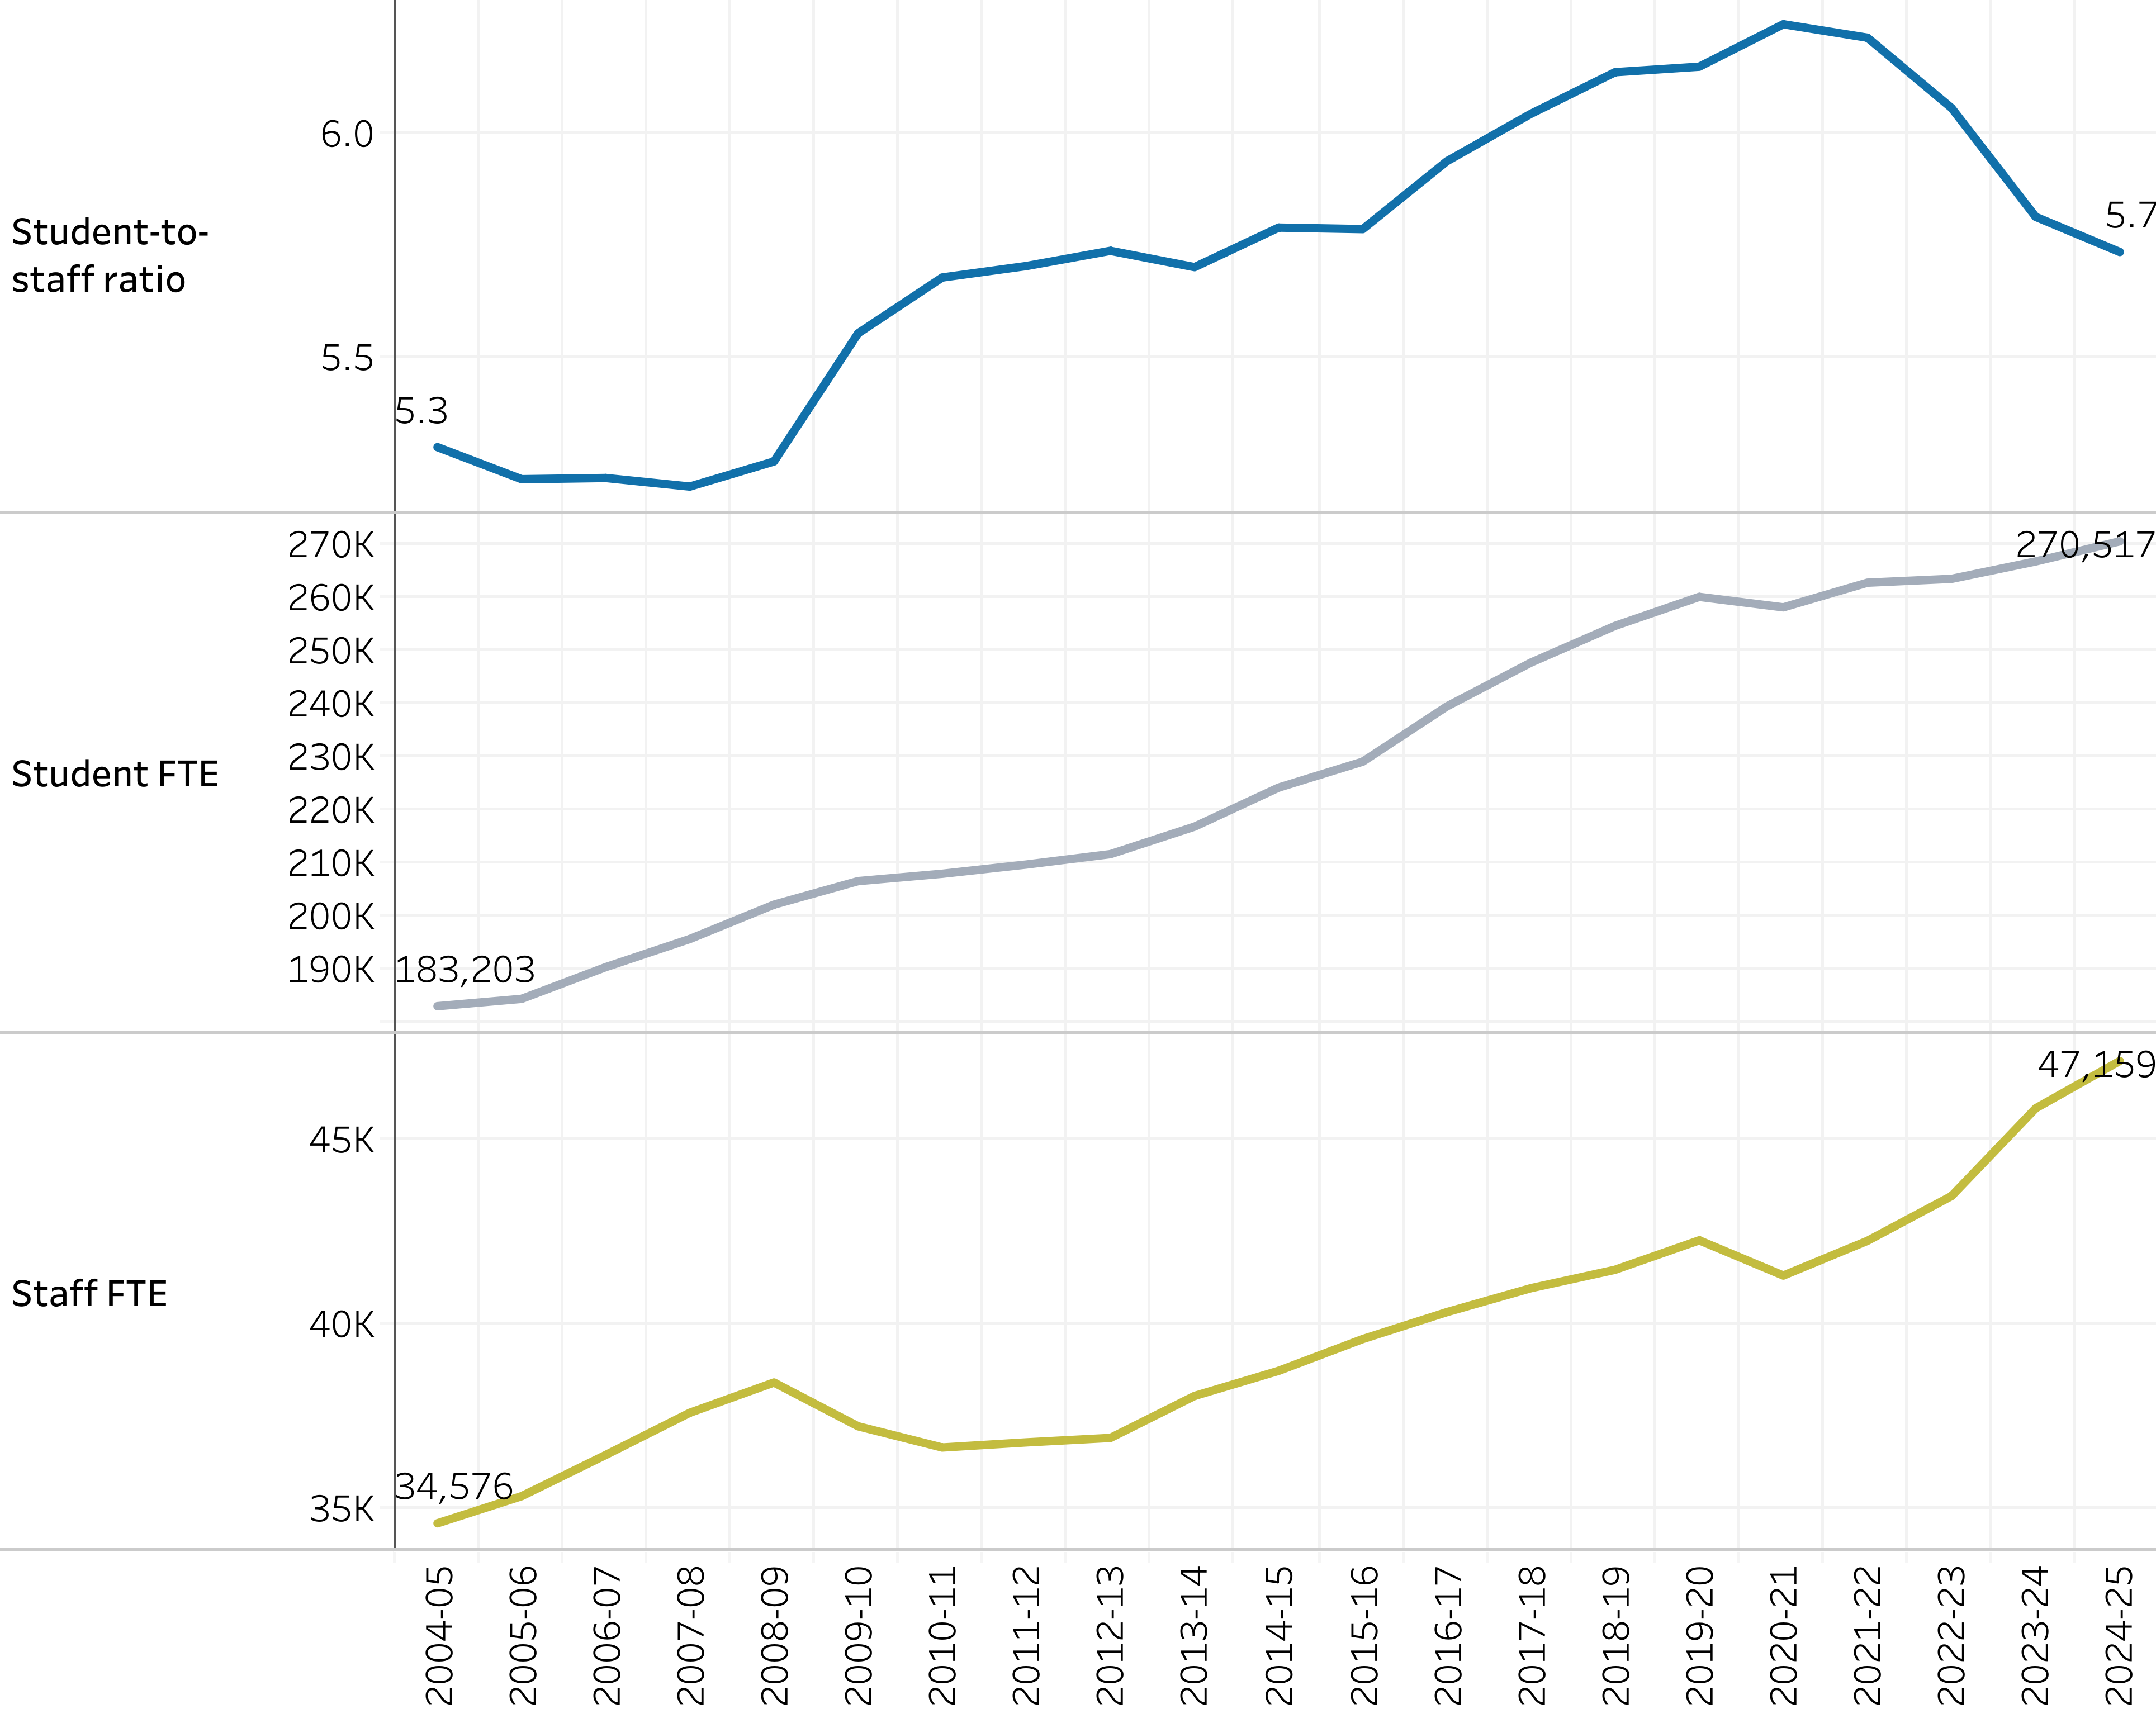
UC’s student-to-staff ratio reached 5.7 in 2024–25 as compared to 5.3 about two decades ago.
12.1.4 Student-staff ratio (ratio of undergraduate and graduate student FTE over all non-academic staff FTE on campuses, excluding medical center staff)
Academic staffing ratios dashboard | Student staff ratio
source: UC Information Center
The student-to-staff ratio reached 5.7 in 2024–25, down from a high point of 6.2 in 2020–21, but up from 5.3 in 2004–05, reflecting enrollment growth without commensurate staff support. Student enrollment has grown 48 percent (from 183,203 to 270,517), while staff FTE has grown at a slower pace of 36 percent (from 34,576 to 47,159).
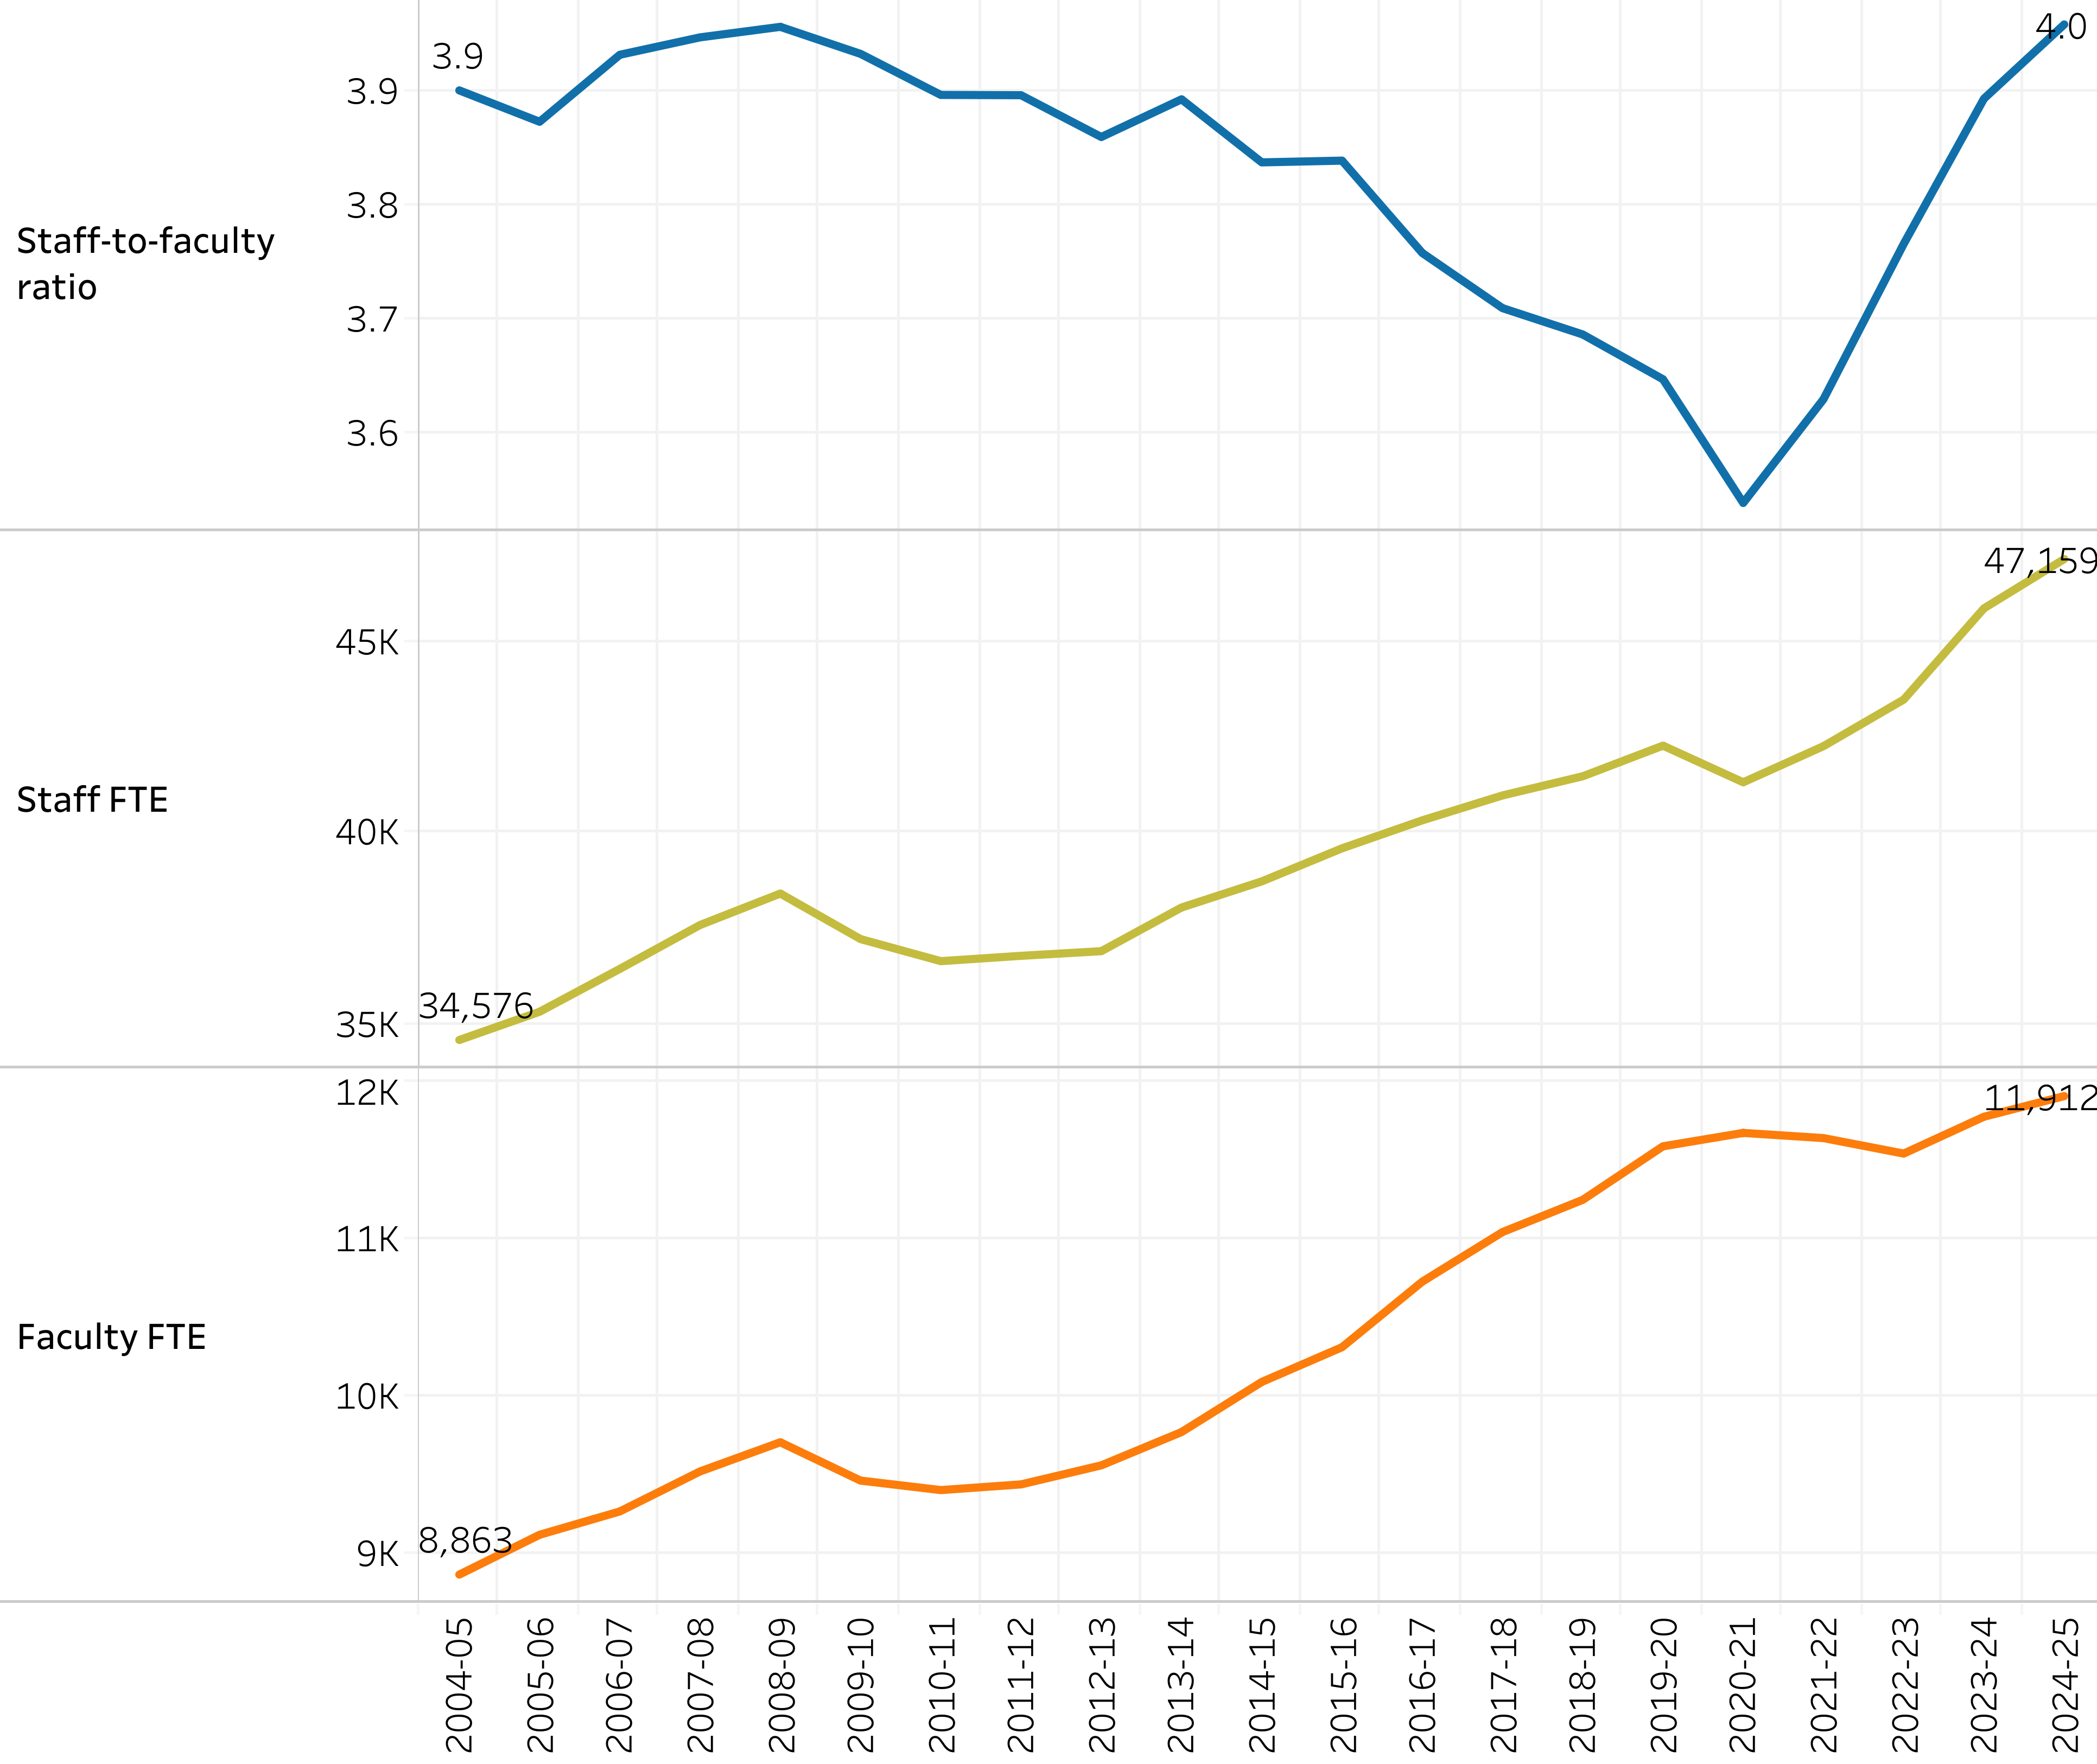
UC’s campus staff-to-faculty ratio was 4.0 in 2024–25 as compared to 3.9 in 2004–05.
12.1.5 Staff-faculty ratio (ratio of non-academic staff FTE on campuses, excluding medical center staff, to faculty FTE)
Academic staffing ratios dashboard | Staff faculty ratio
source: UC Information Center
The staff-to-faculty ratio stands at 4.0 in 2024–25, just above the 3.9 in 2004–05. Over the past two decades, this ratio dropped from a peak near 4.0 around 2008–09 down to a low of roughly 3.5 in 2020–21. The sharp dip around 2020–21 likely reflects COVID-19 pandemic-era hiring freezes and budget pressures impacting staff more than faculty. Broadly speaking, UC campuses have maintained a roughly 4:1 staff-to-faculty ratio.
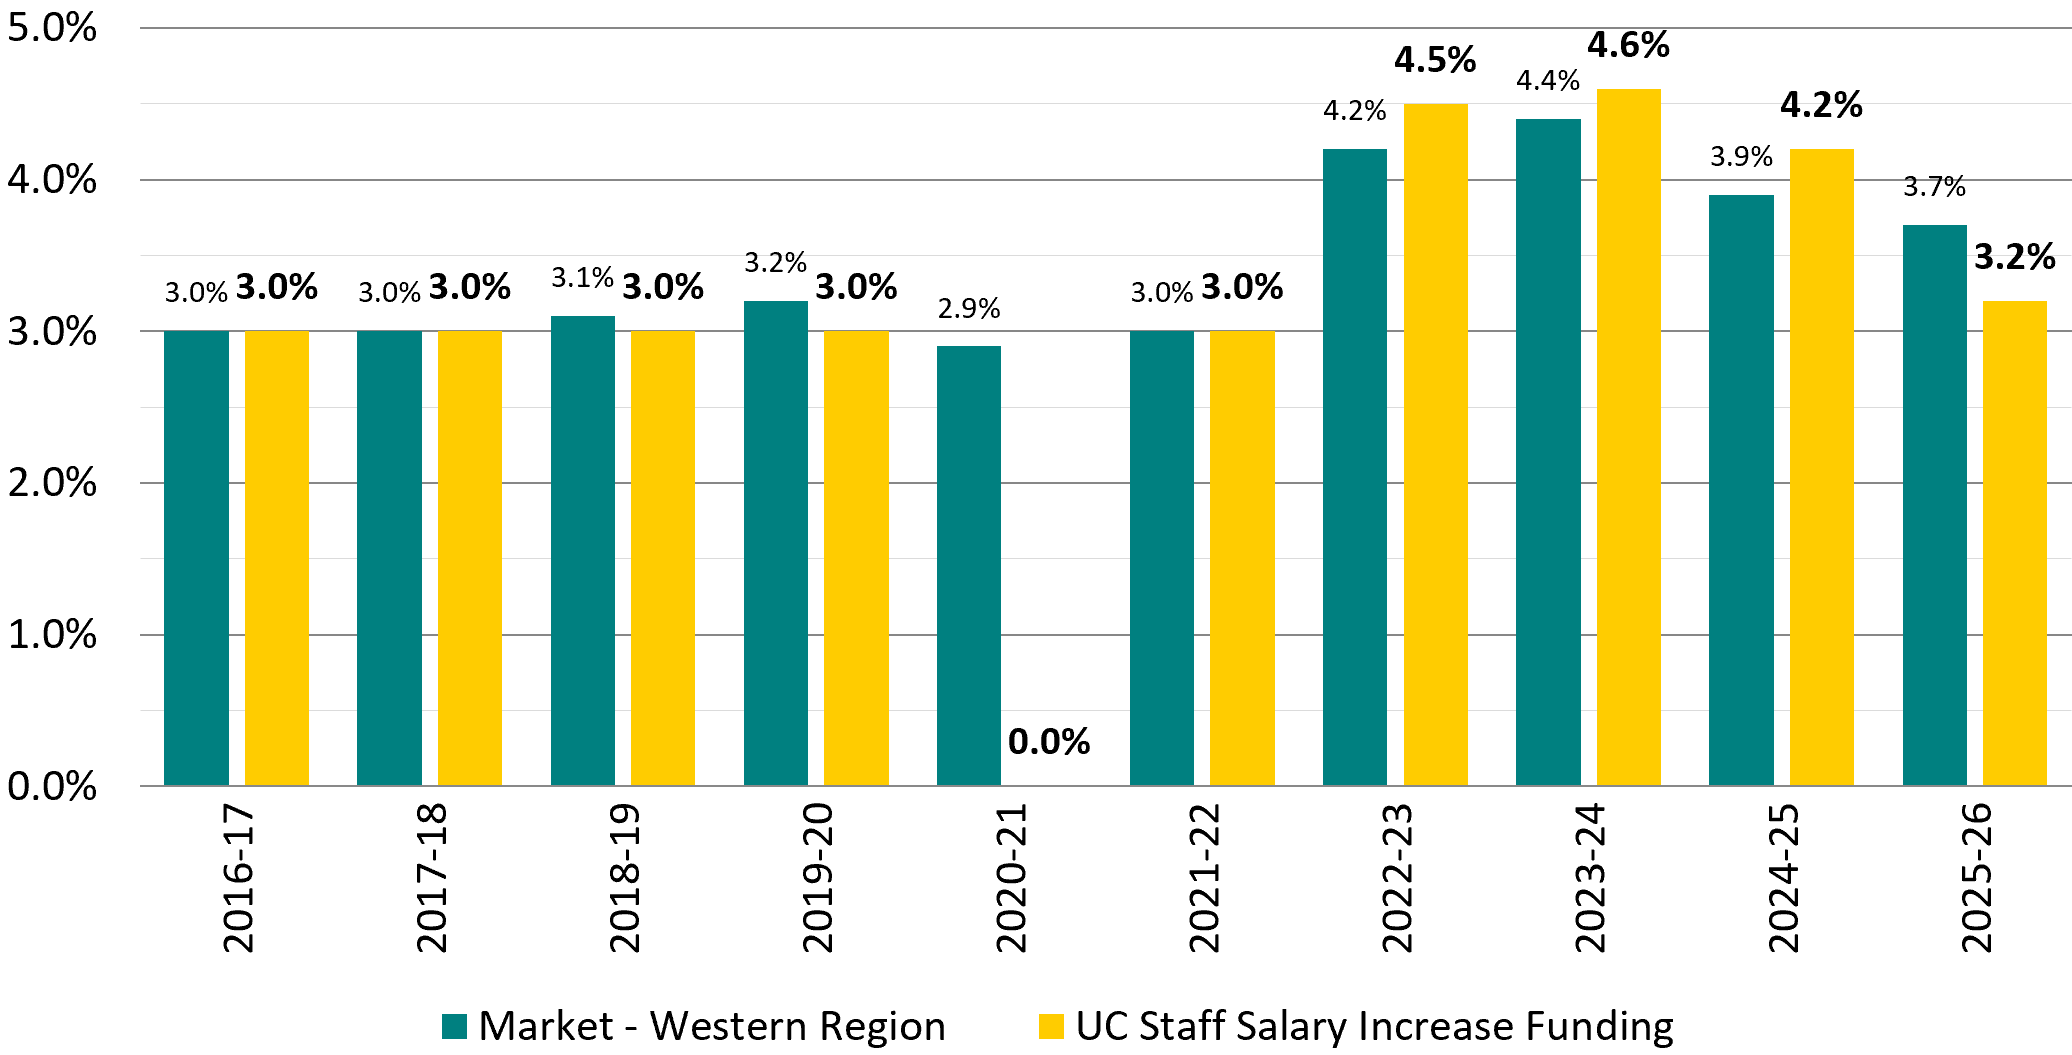
UC staff salaries have consistently kept pace with or outpaced the market.
12.2.1 Increases in funding for staff salaries compared to market

University of California Budget for Current Operations 2026–27 Report | page 159
source: UC Budget for Current Operations 2026–27
Over the past decade, these salary increases have averaged 3.44 percent as compared to the market increase of 3.15 percent. While in 2025–26, UC provided a 3.2 percent increase compared to the 3.7 percent Western Region Market rate. UC salary increases exceeded the market rate the prior three years to make up for no salary increase during the pandemic. A continued salary increase helps UC address rising costs of living adjustments, retain the staff, and maintain parity with labor market adjustments. The market rates are sourced from World at Work Annual Salary Budget survey, which represents data from over 1,000 employers from all sectors in the Western United States.
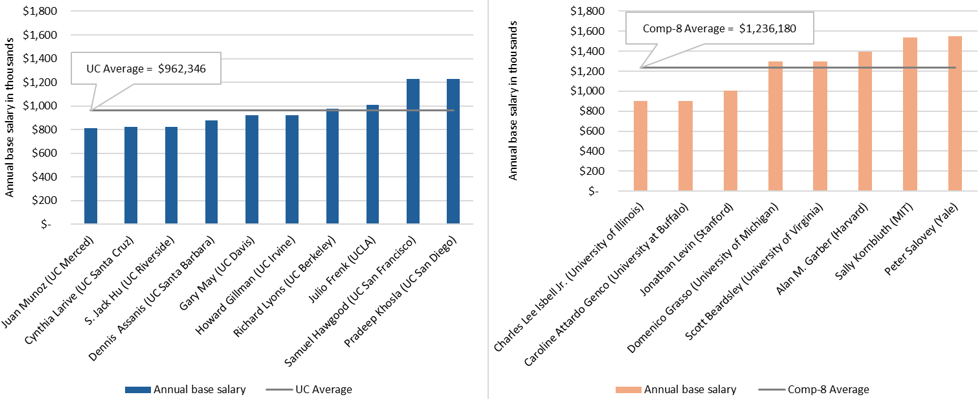
UC chancellor pay still trails their Comp-8 group peers, even after recent raises.
12.2.2 Annual base salary rates* for UC chancellors and comp-8 counterparts
sources: UCPath, Comp-8 campuses, and Propublica
In September 2024, the UC Regents approved market-based salary increases for seven chancellors to bring their pay in line with peer institutions and internal benchmarks. UC chancellor salaries have long lagged behind comparable universities. Even after the adjustments, the UC average sits at $962K, still 22 percent below the average of $1.236M at Comp-8 peer institutions. UC chancellor salaries currently range from $810K (UC Merced) to $1.227M (UC San Diego and UC San Francisco). The pay gap reflects years of below-market compensation for leaders running some of the world’s top-ranked research universities. UC chancellors oversee complex institutions with billions in research funding, tens of thousands of employees, and major public service missions. Competitive pay is key to attracting and keeping that caliber of leadership.
For more information, refer to UC Regents action item: "Approval of market-based salary adjustments for certain UC chancellors as discussed in closed session"
*These numbers represent annualized base salary rates as of May 2026.
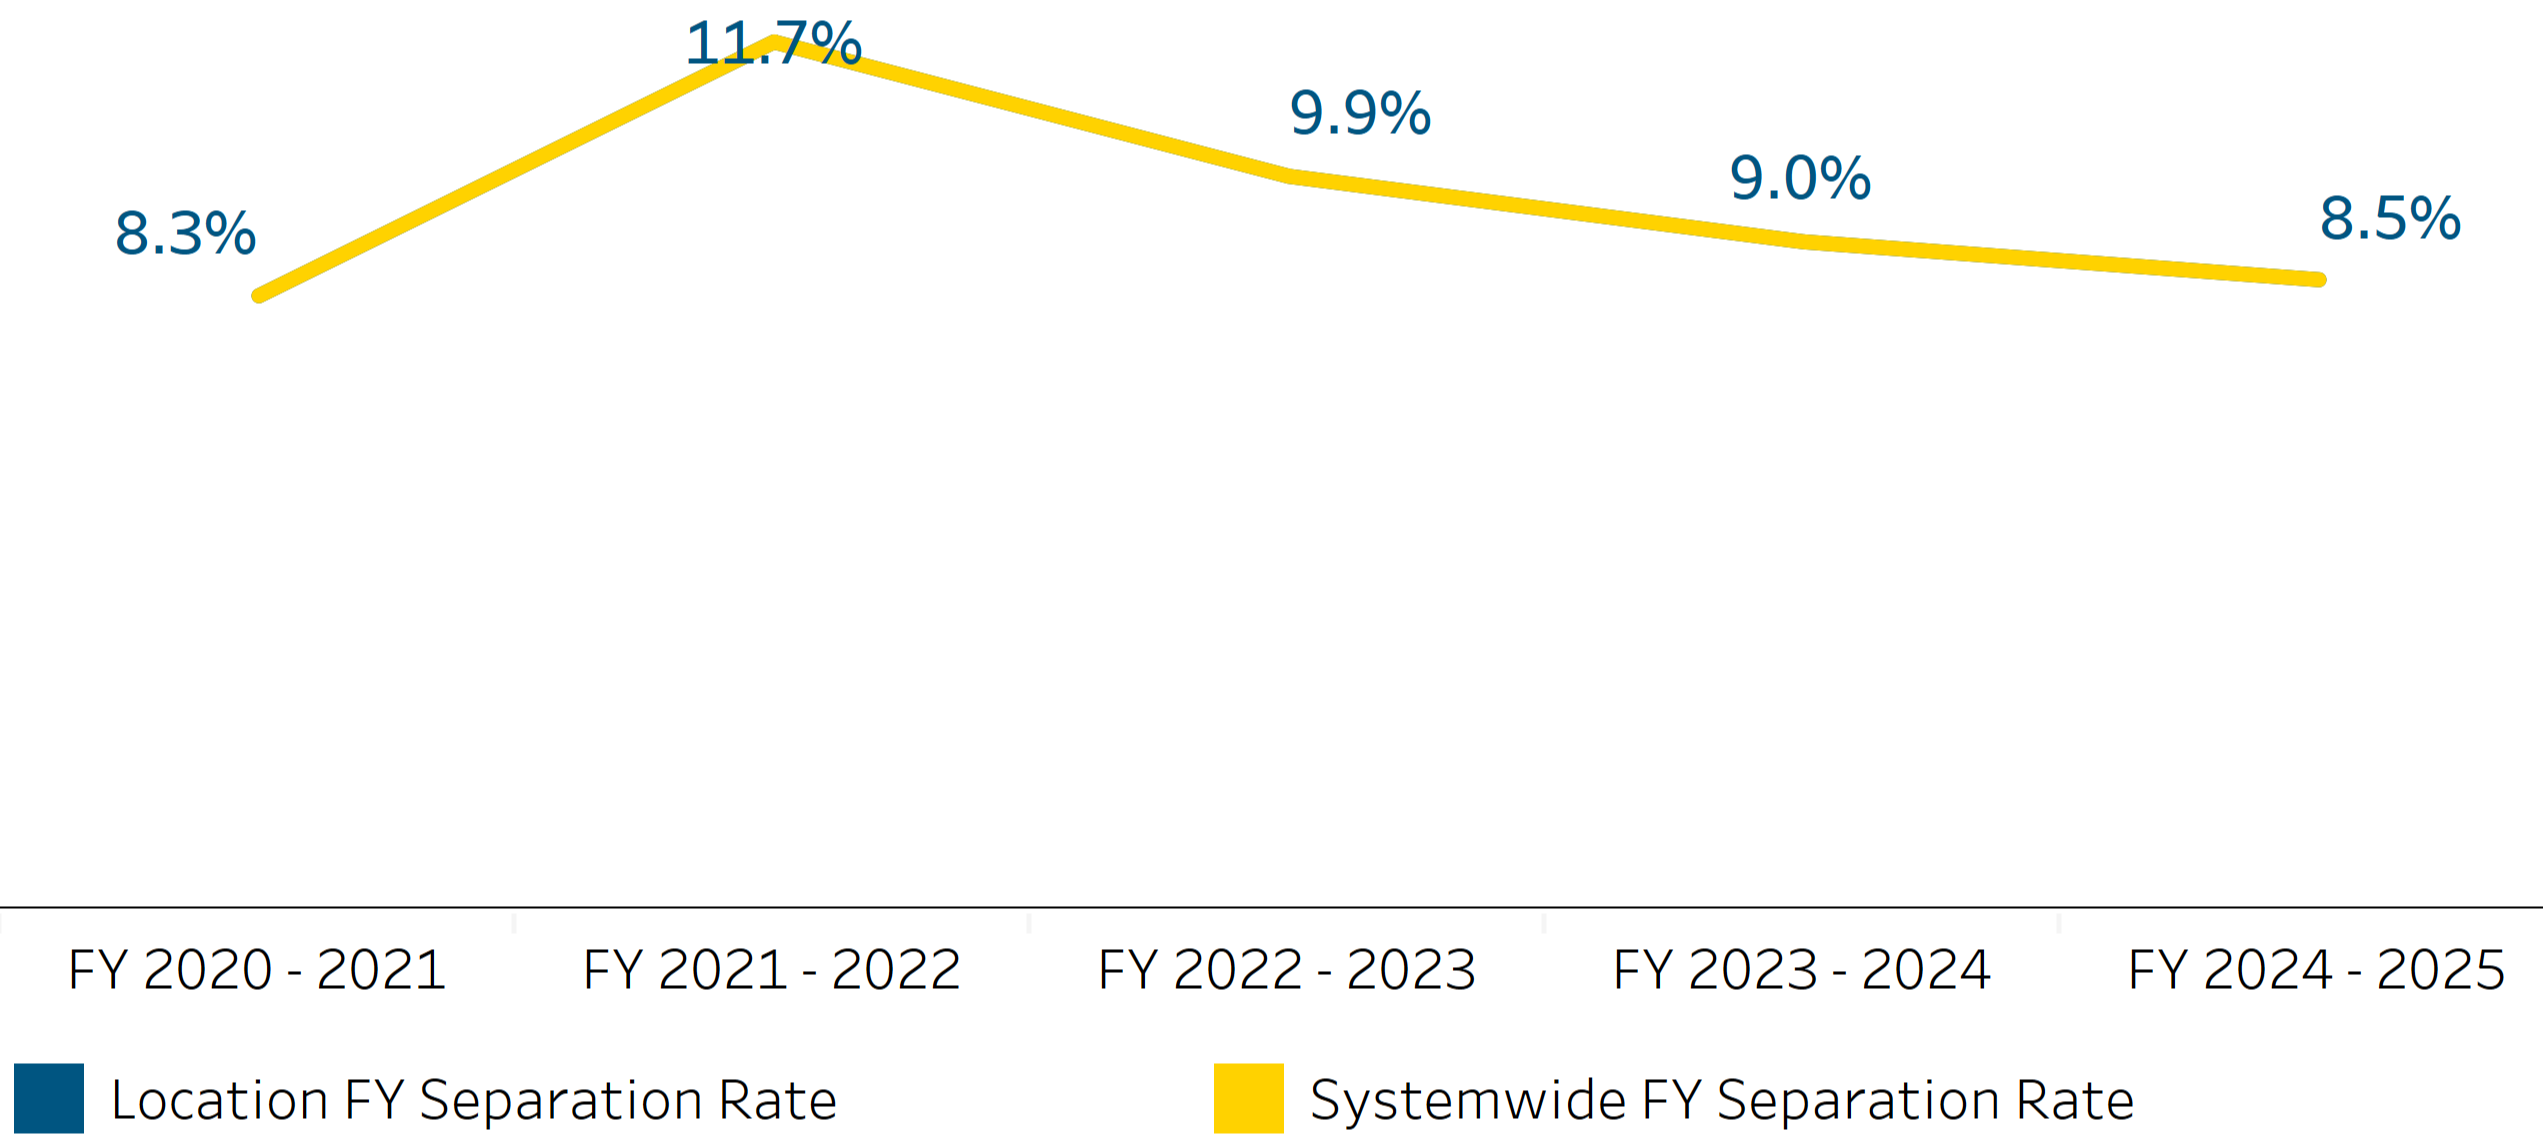
The annual separation rate for non-academic staff is at 8.5 percent, nearly back to pre-pandemic levels.
12.3.1 Fiscal year separation rate for career staff
Staff workforce profile dashboard | Dashboard 2
source: UCPath
UC’s career staff separation rate dropped to 8.5 percent in FY 2024–25, down from nine percent the year before and well below the pandemic-era peak of 11.7 percent in FY 2021–22. At 8.5 percent, the separation rate is now just slightly above the 8.3 percent recorded in FY 2020–21, suggesting that UC has essentially returned to baseline after the COVID-19 pandemic years. Avoiding high turnover supports business continuity and institutional knowledge retention, and minimizes recruitment and onboarding costs.
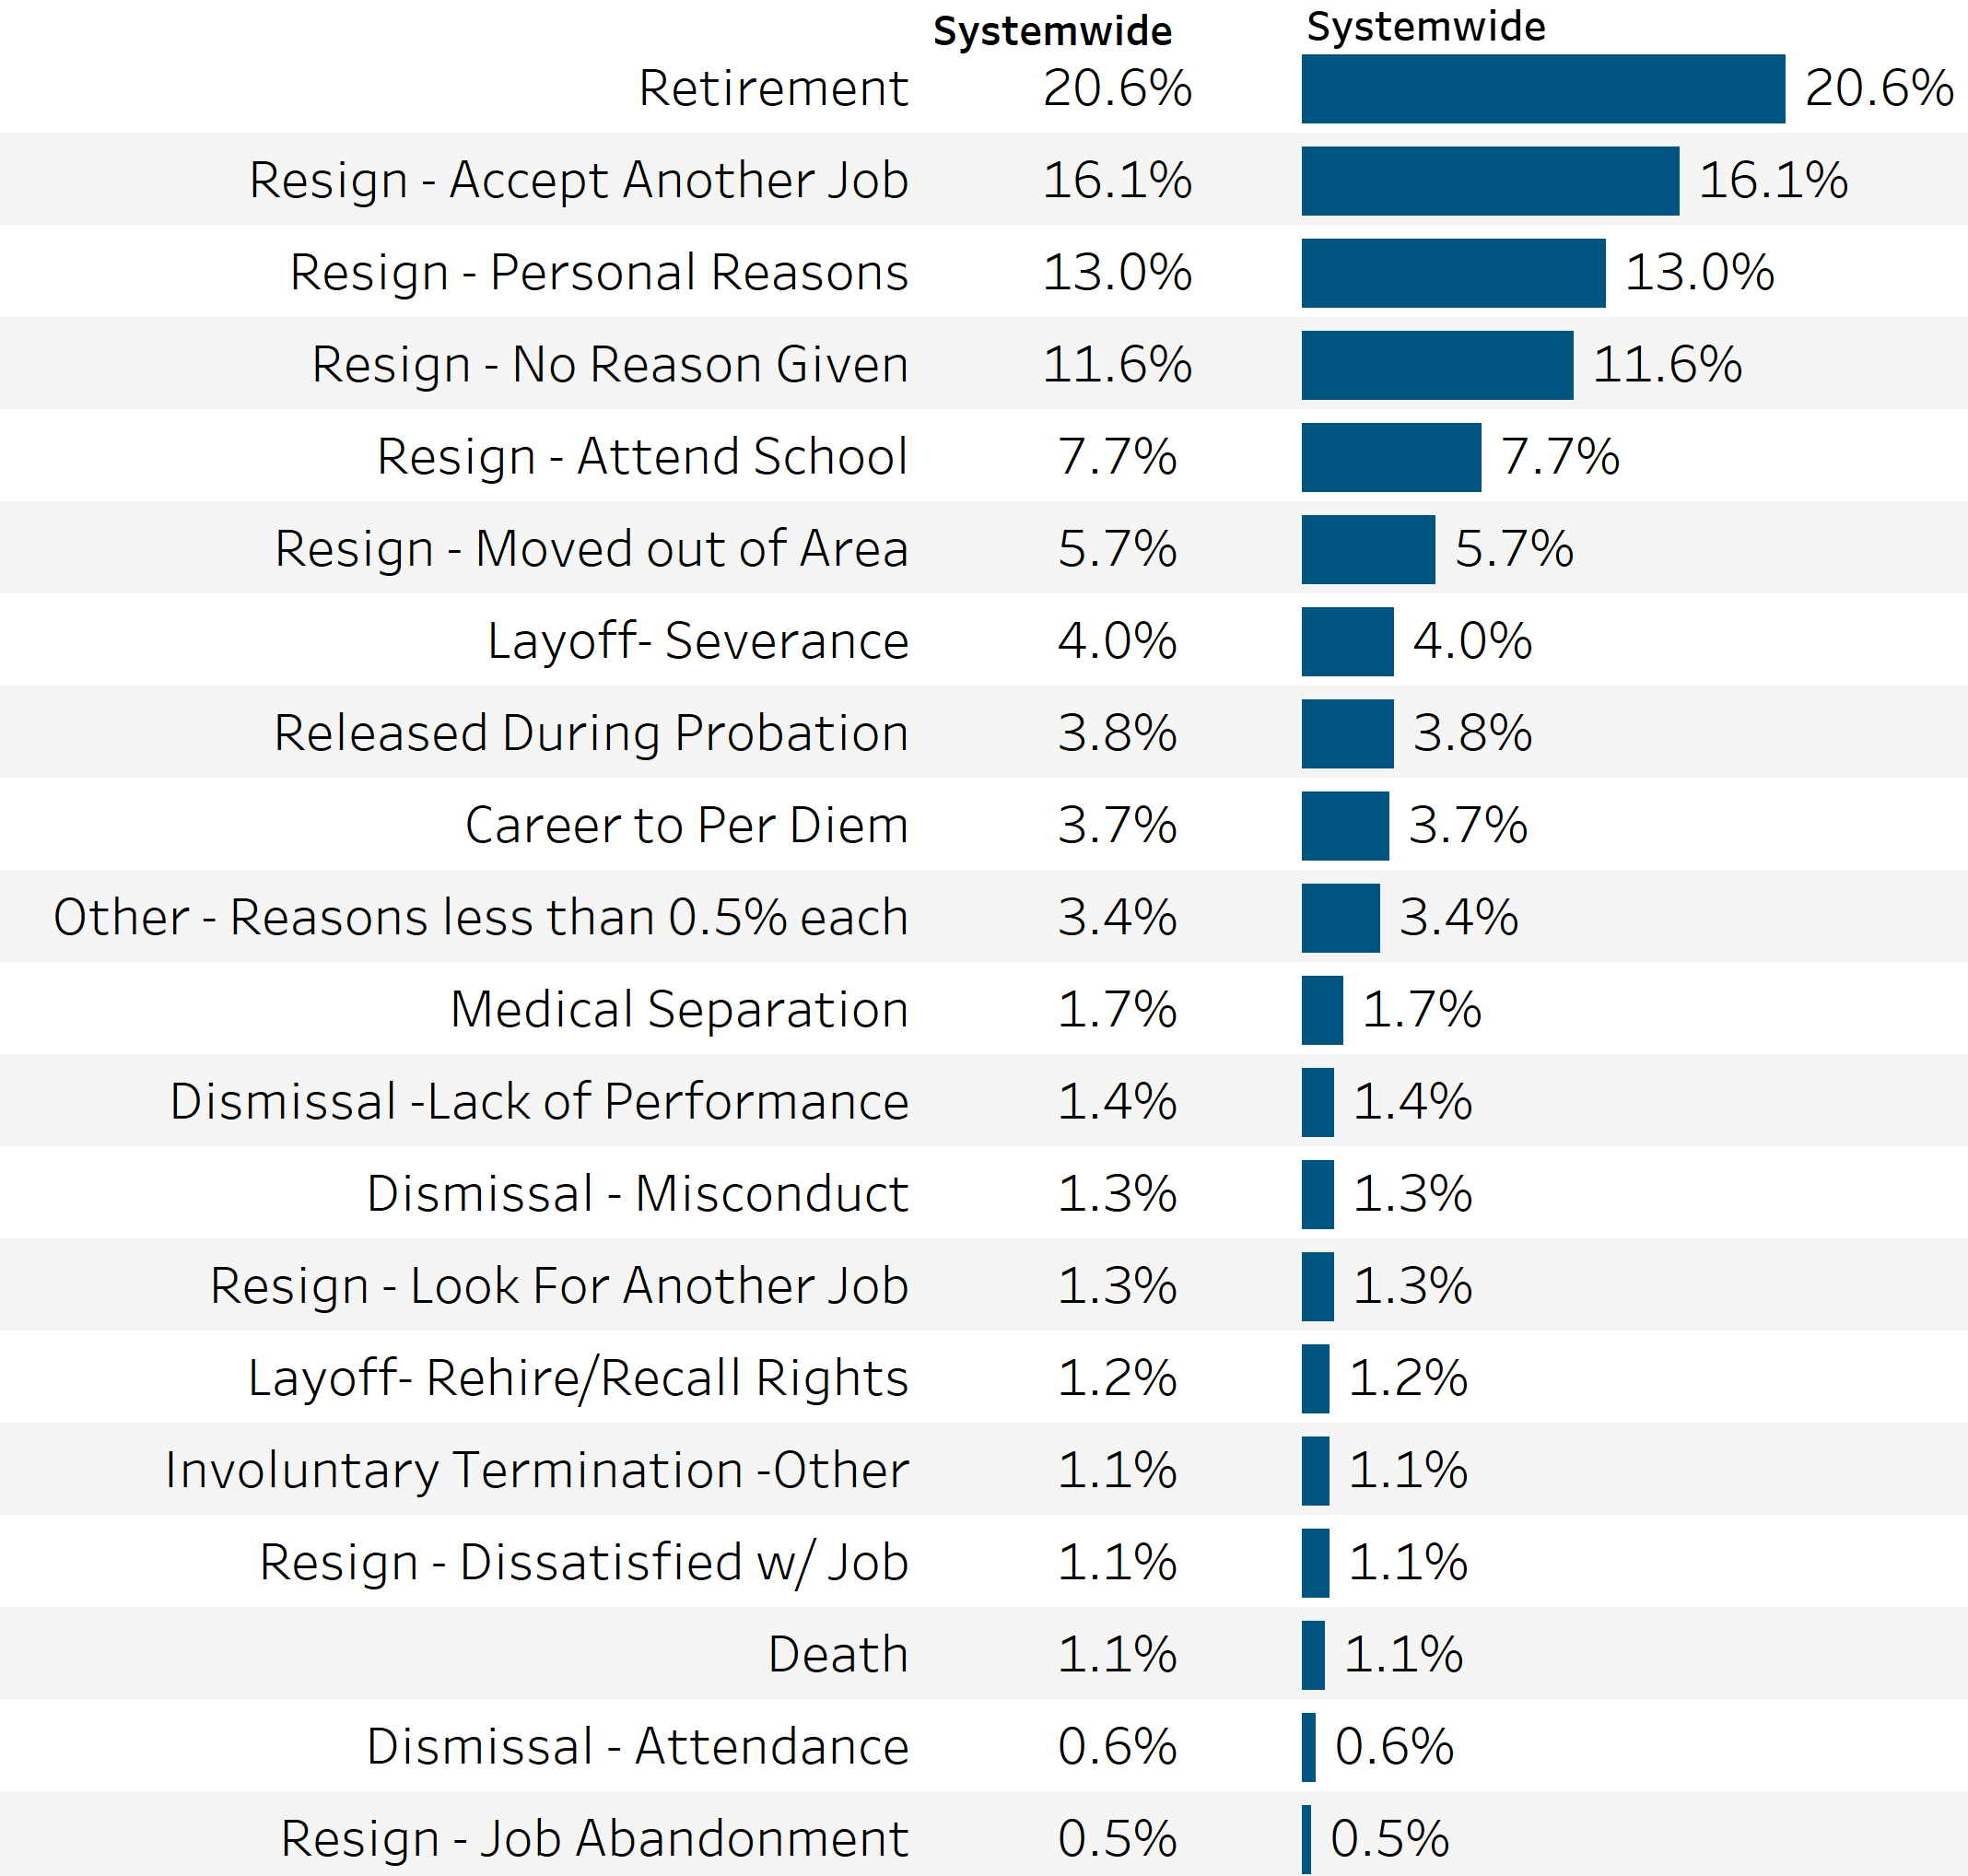
One in five staff employees who leave UC are retiring.
12.3.2 Separation reasons for career staff, FY 2025
Staff workforce profile dashboard | Dashboard 2
source: UCPath
In FY 2024–25, UC had 10,993 career staff separations (8.5 percent separation rate). At UC, “career staff” refers to regular non-academic employees hired into ongoing, non-probationary positions. Retirement was the top reason at 20.6 percent, followed by accepting another job (16.1 percent) and personal reasons (13 percent). Retirements are usually predictable. But resignations indicate a competitive labor market. Voluntary separations are far more common than involuntary exits (terminations, dismissals, and layoffs. This means UC’s retention challenge is about competing with outside offers. Lost productivity, institutional knowledge loss, and the cost of recruitment and onboarding make even a modest separation rate an expensive operational cost at UC’s scale.
In FY 2025, UC career staff hiring dropped by 81 percent.
12.3.3 Fiscal year hires for career staff by personnel program
Staff workforce profile dashboard | Dashboard 2

source: UCPath
Total new career staff hires dropped to 4,528 in FY 2024–25, roughly an 81 percent drop from the 24,007 hired the fiscal year before. The steepest drop was in professional and support staff, which went from 22,245 to just 4,112 hires. Senior Professional hires dropped from 1,338 to 279 and Senior Management Group hiring fell from 16 to 8. This decline is due to a systemwide hiring freeze that UC implemented to address financial pressures, state budget cuts, and broader economic and policy uncertainty.
For more information
Explore the UC Information Center dashboards that provide downloadable data and context on UC’s staff with this subject area-specific url:
universityofcalifornia.edu/about-us/information-center#employees
In addition to those dashboards supporting indicators in this chapter, other examples include:
Other resources
Download data tables for chapter 12 indicators (Excel format)
Chapter Twelve: Staff
Key takeaways:
- The University of California is the second-largest employer in the state of California, making the University a critical player in supporting the state’s economy and workforce.
- Seventy-five percent of UC employees are non-academic staff and student employees, which total 152,000 FTE.
- Forty percent of UC staff work in UC medical centers with growth due to increased workload and hospital acquisitions.
- Sixty-six percent of staff are women.
- There has been an eighty percent decline in hiring of new employees resulting from hiring freeze and fiscal uncertainty.
Why it matters:
University staff members make valuable contributions to supporting the University’s overall mission of education, research, public service, and patient care.
UC’s corner on history:
In 1968, in the wake of the assassination of Dr. Martin Luther King, Joanne Lewis and other African Americans at UCSF co-founded a Black Caucus to further equity on campus.