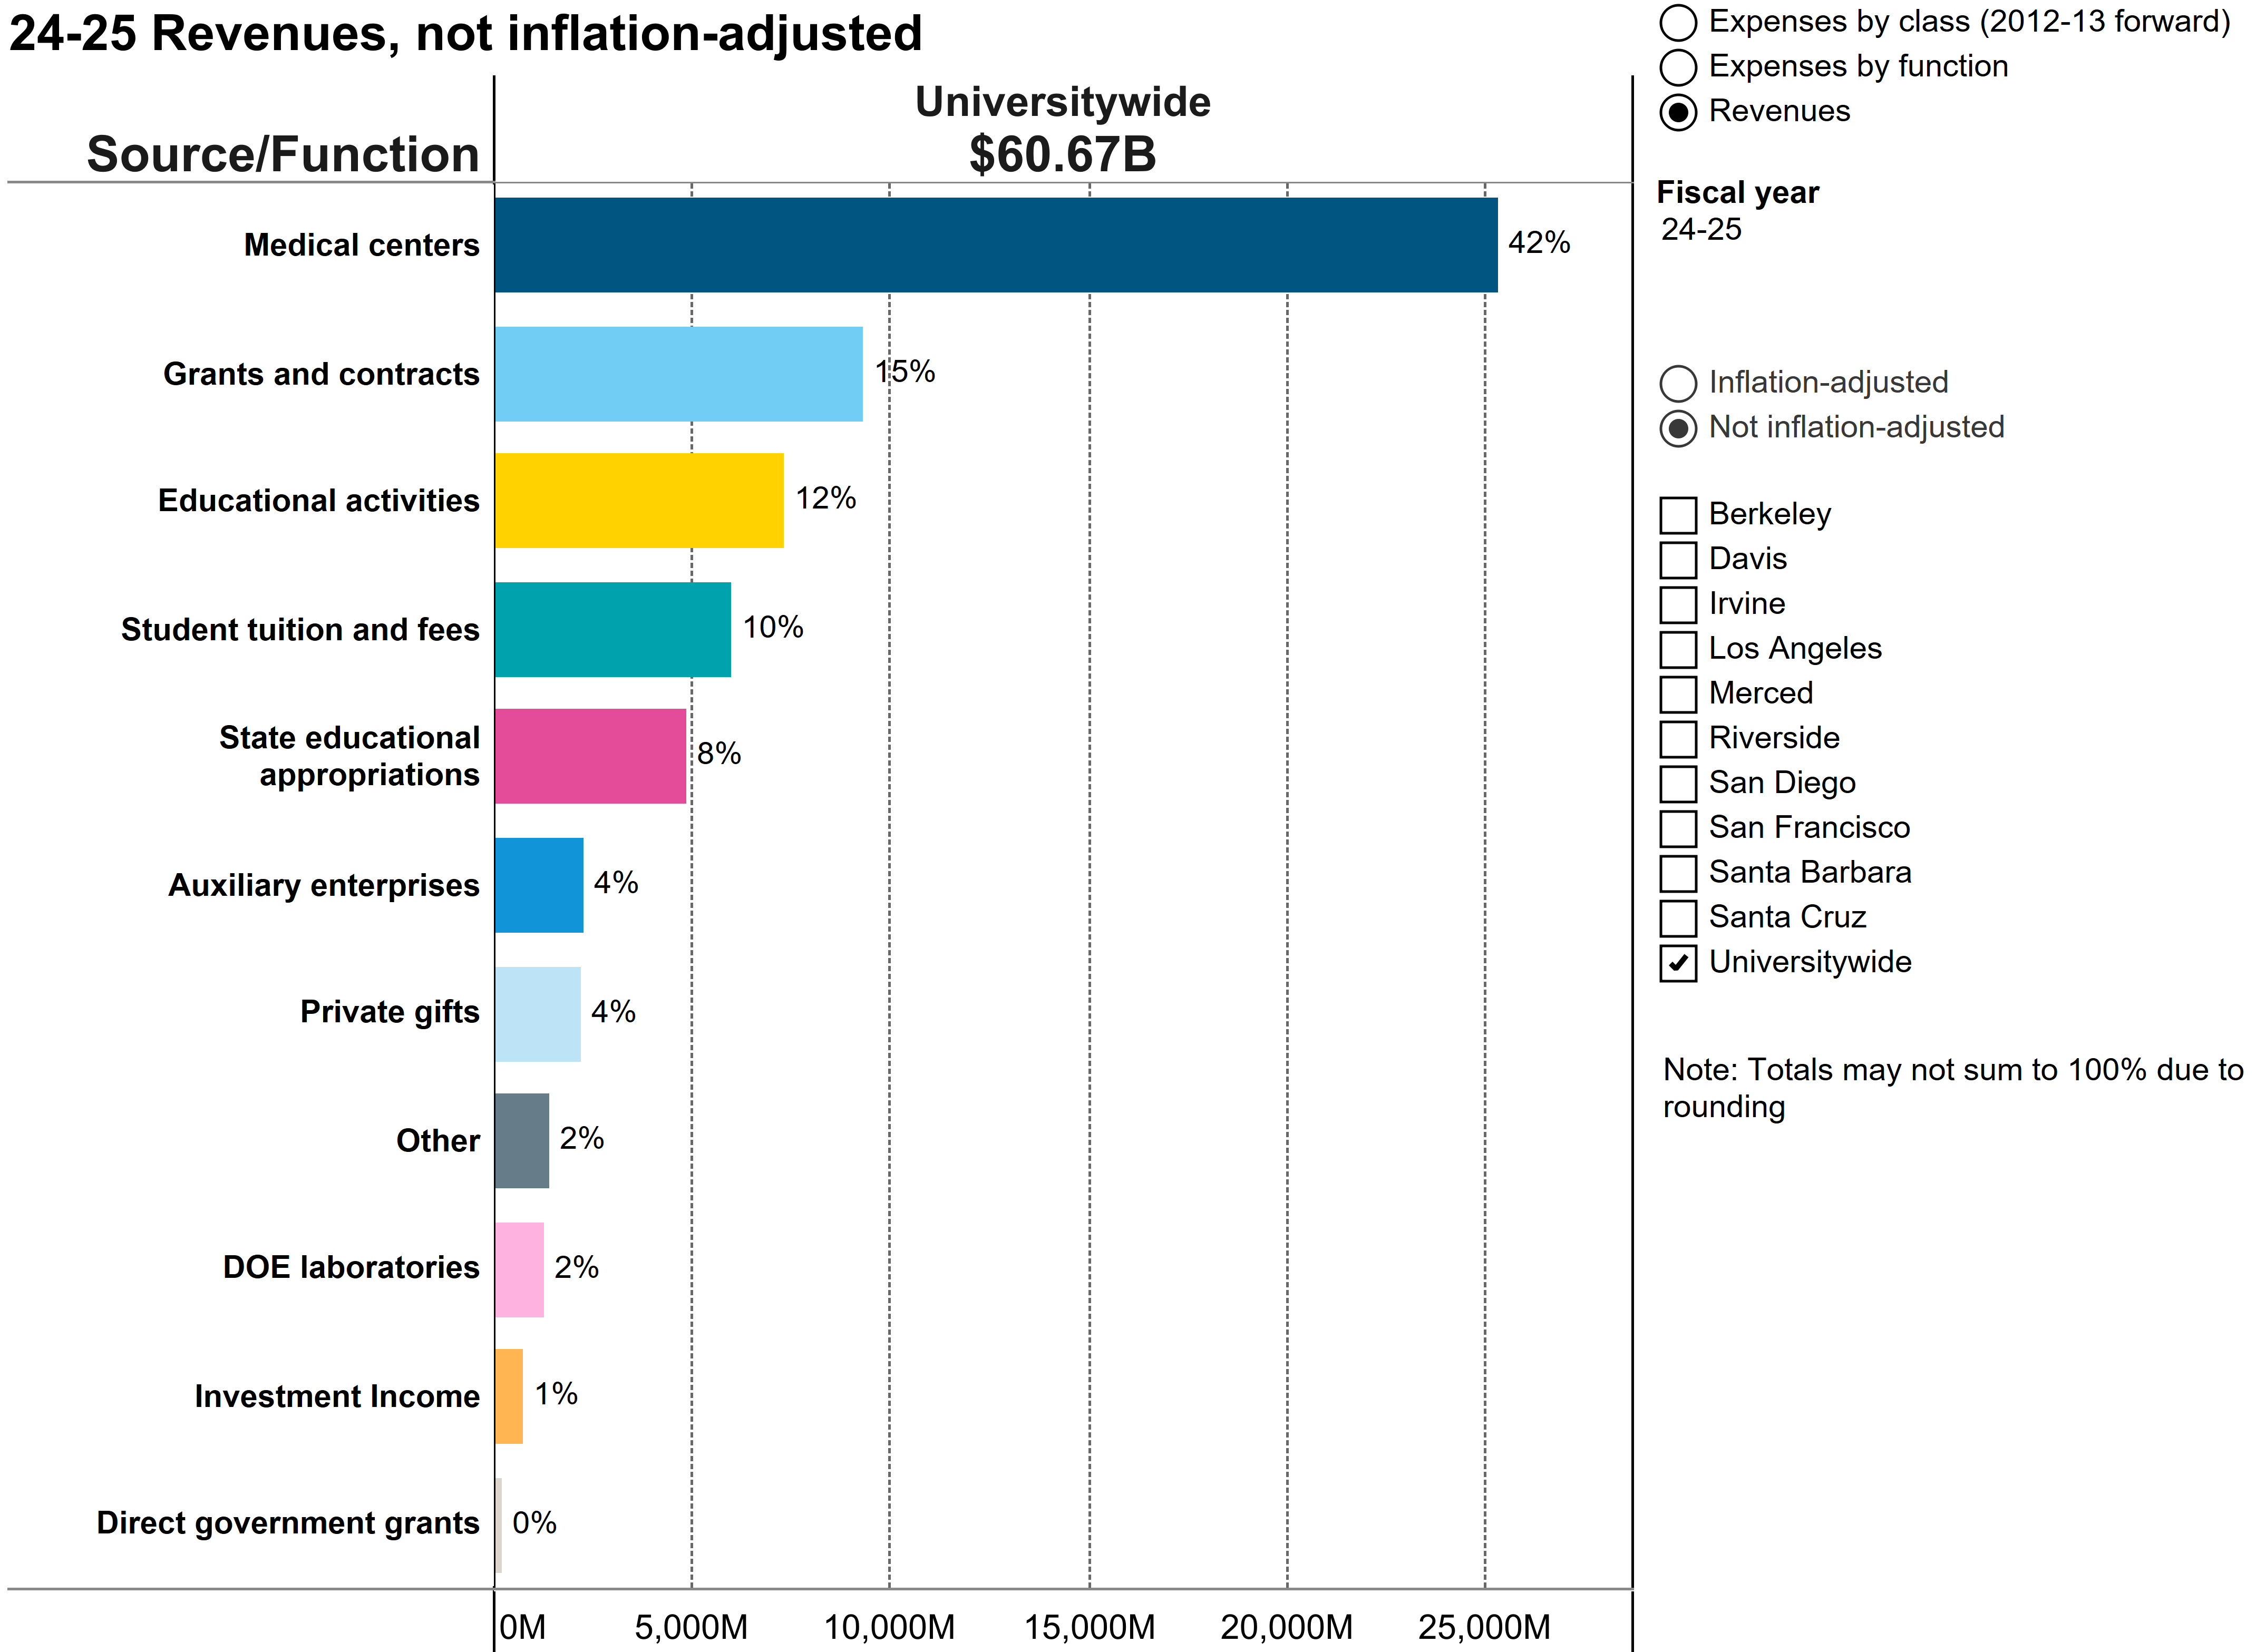
The largest source of UC revenues are medical centers, followed by grants and contracts.
13.1.1 Revenues by source, Universitywide, Fiscal year 2024–25

Revenue and expense data dashboard | Graph
source: UC Information Center
In 2024–25, the University generated $60.7 billion in revenues to support its mission of teaching, research, and public service, double the $31 billion reported ten years ago. Medical centers have driven over half of this growth, increasing their share of total revenues from 33 percent to 42 percent, with revenues rising faster than any other source. Medical center revenues are largely derived from patient fees and public insurance programs, including Medicare and Medi-Cal.
Core funds, which primarily consist of State General Funds and student tuition and fees, are distinct from other, externally controlled revenues and are essential to supporting UC’s core mission, including instruction, student services, financial aid, libraries, institutional support, and campus infrastructure.
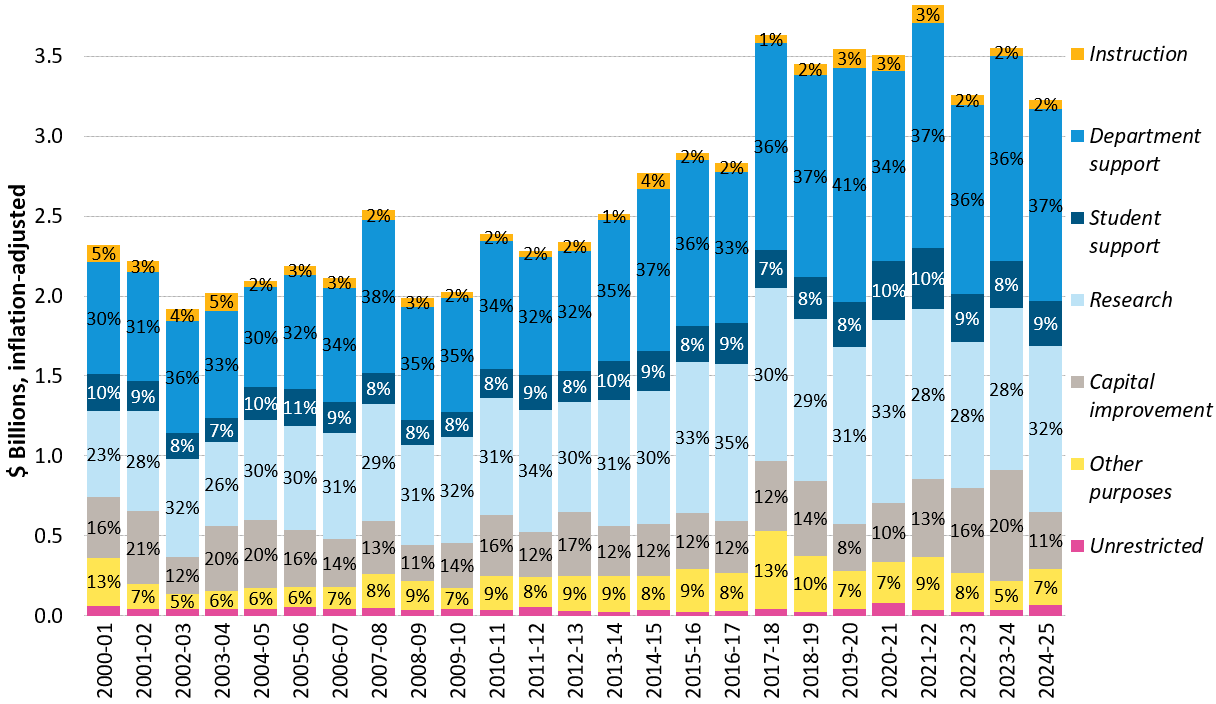
Of the $3.2 billion in gift funds, ninety-eight percent are restricted by donors in how they may be used.
13.1.2 Current giving by purpose, Universitywide, 2000–01 to 2024–25
source: UC Institutional Advancement
Gift funds have become increasingly important to the University as a means to help address budget shortfalls and expand student financial aid. In 2024–25, new gifts to the University totaled over $3.2 billion. However, virtually all of these funds are restricted for specific purposes and are not available to support general operating costs. In addition, $684 million was designated for endowment, where only the income/payout is available for expenditure.
Private giving varies significantly by campus and relates to the campus’ age, number of alumni, and the presence of health science programs. More information about campus giving can be found in the 2024–25 Annual Report on University Private Support, beginning on page 21.
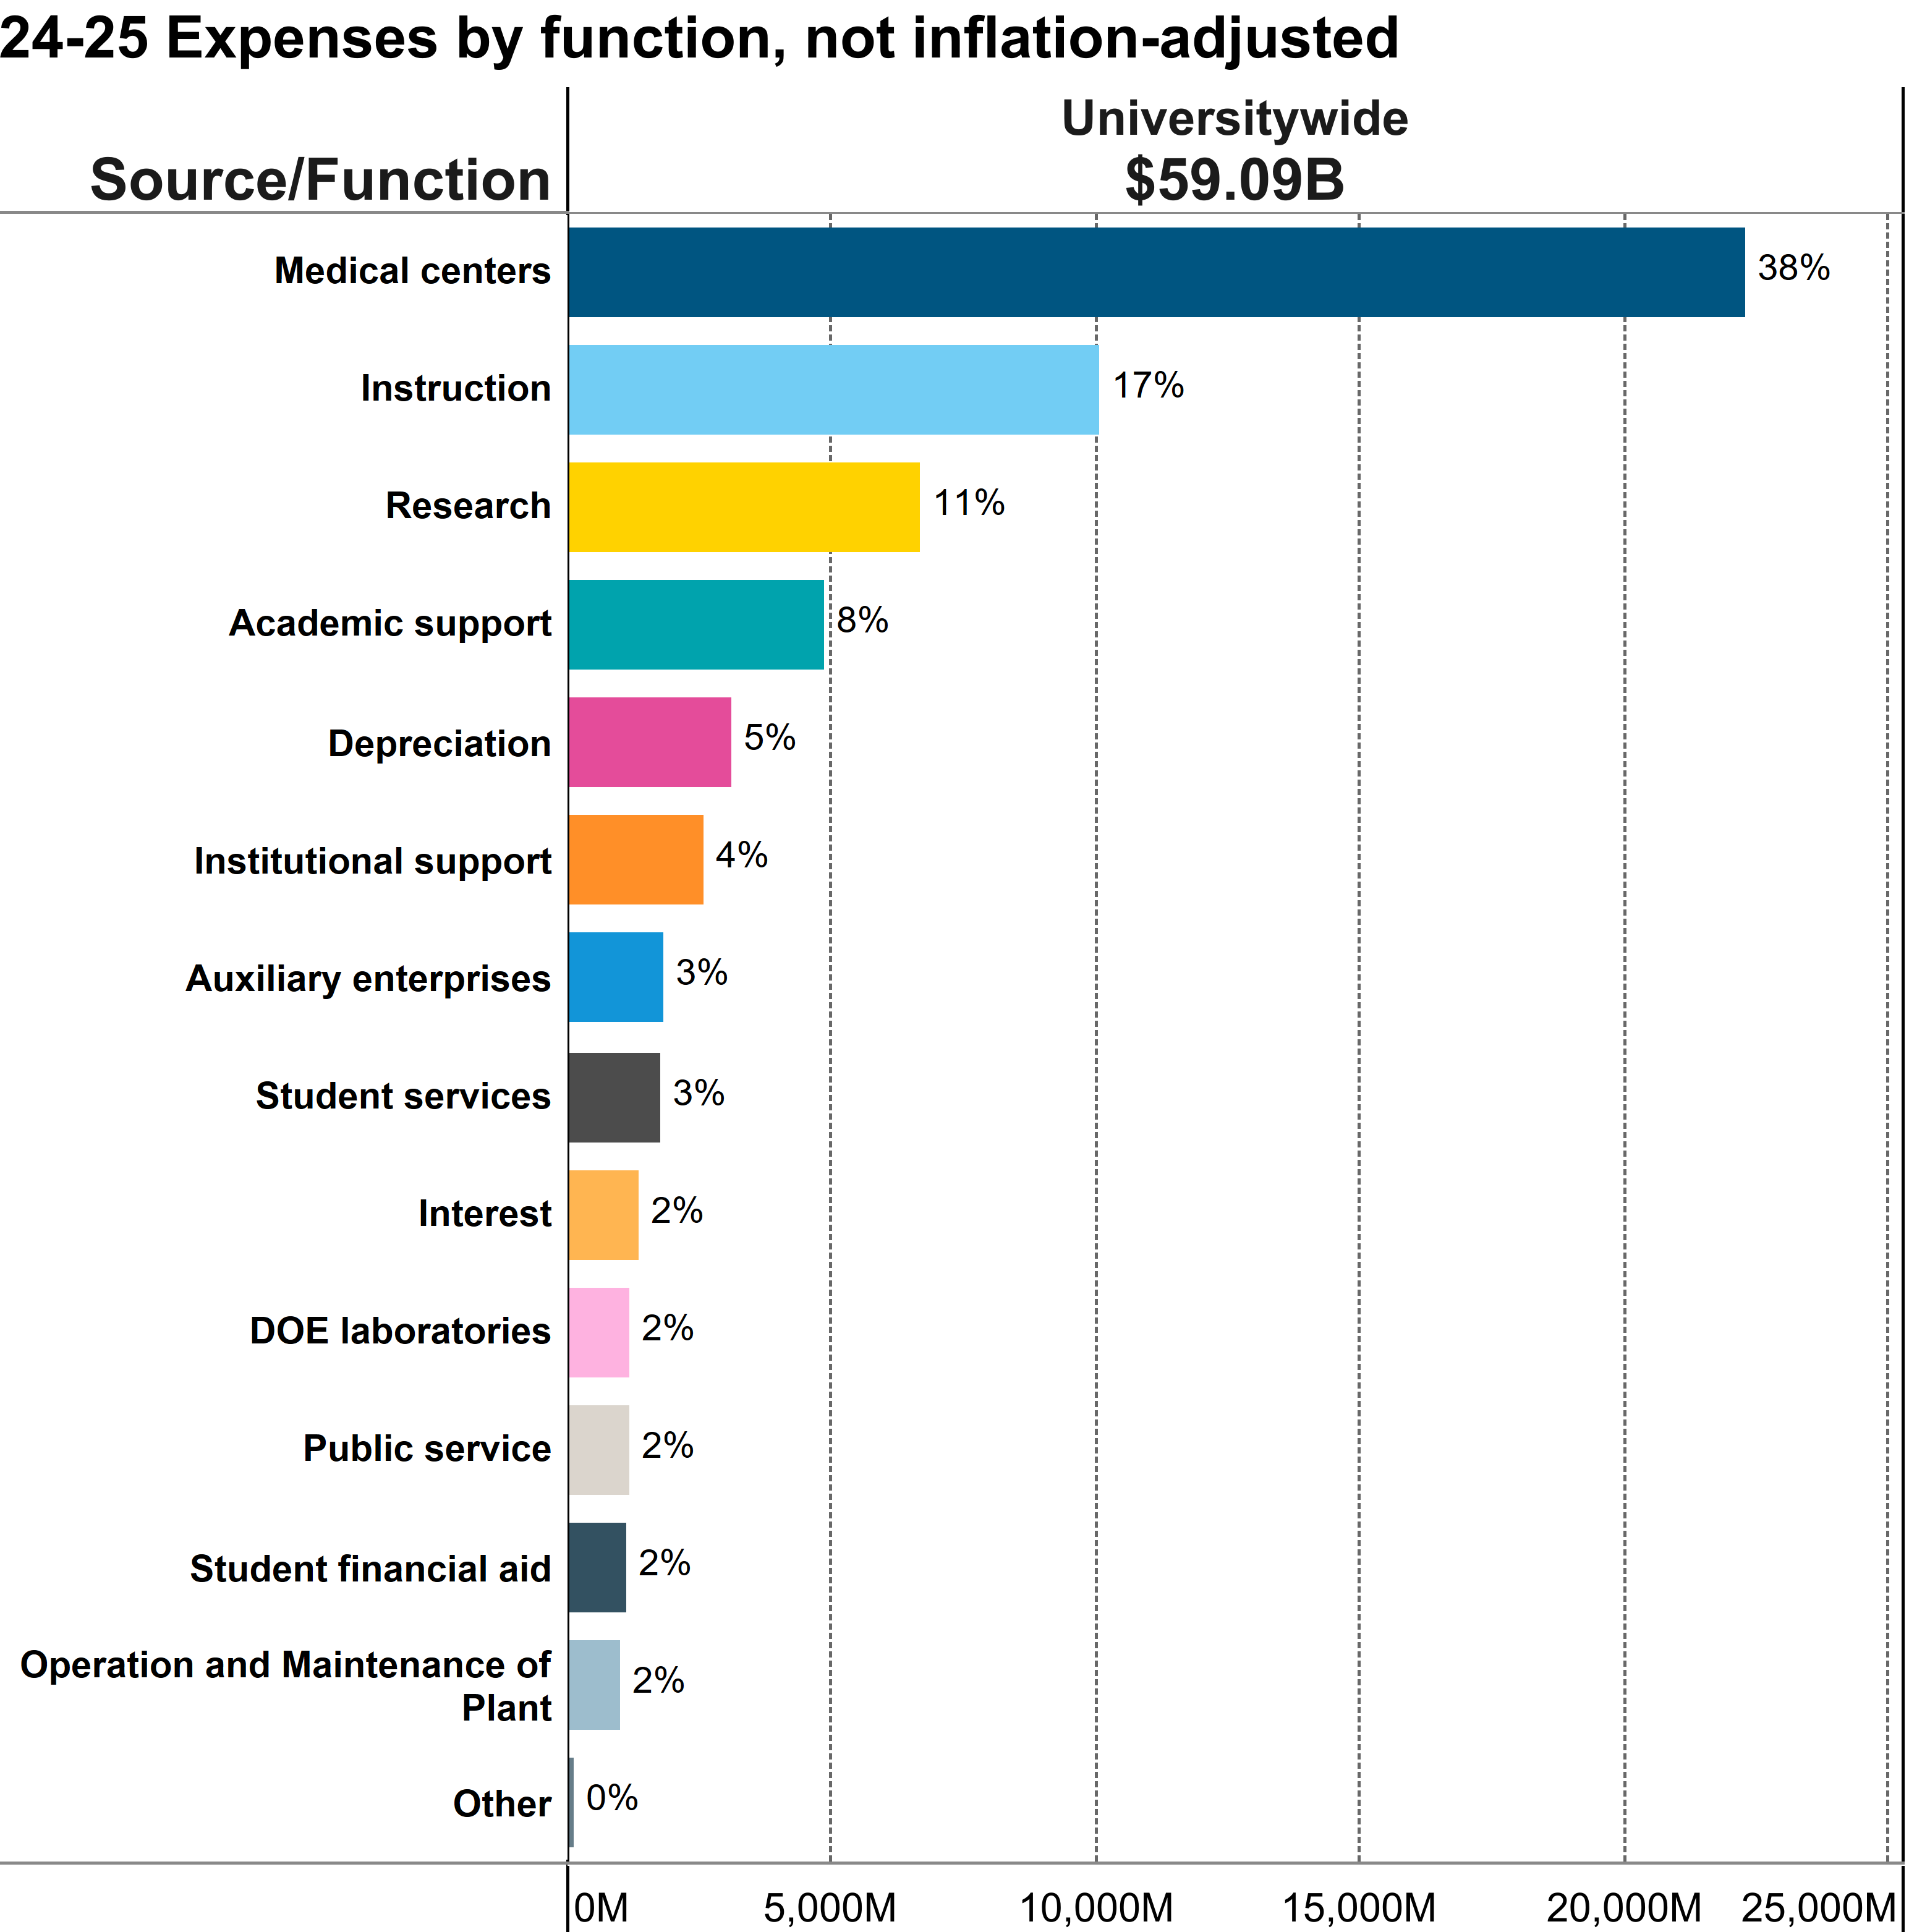
Medical centers are the largest single functional expense, and their share has steadily grown over the last two decades.
13.1.3 Expenditures by function and class, Universitywide, Fiscal year 2024–25
source: UC Information Center
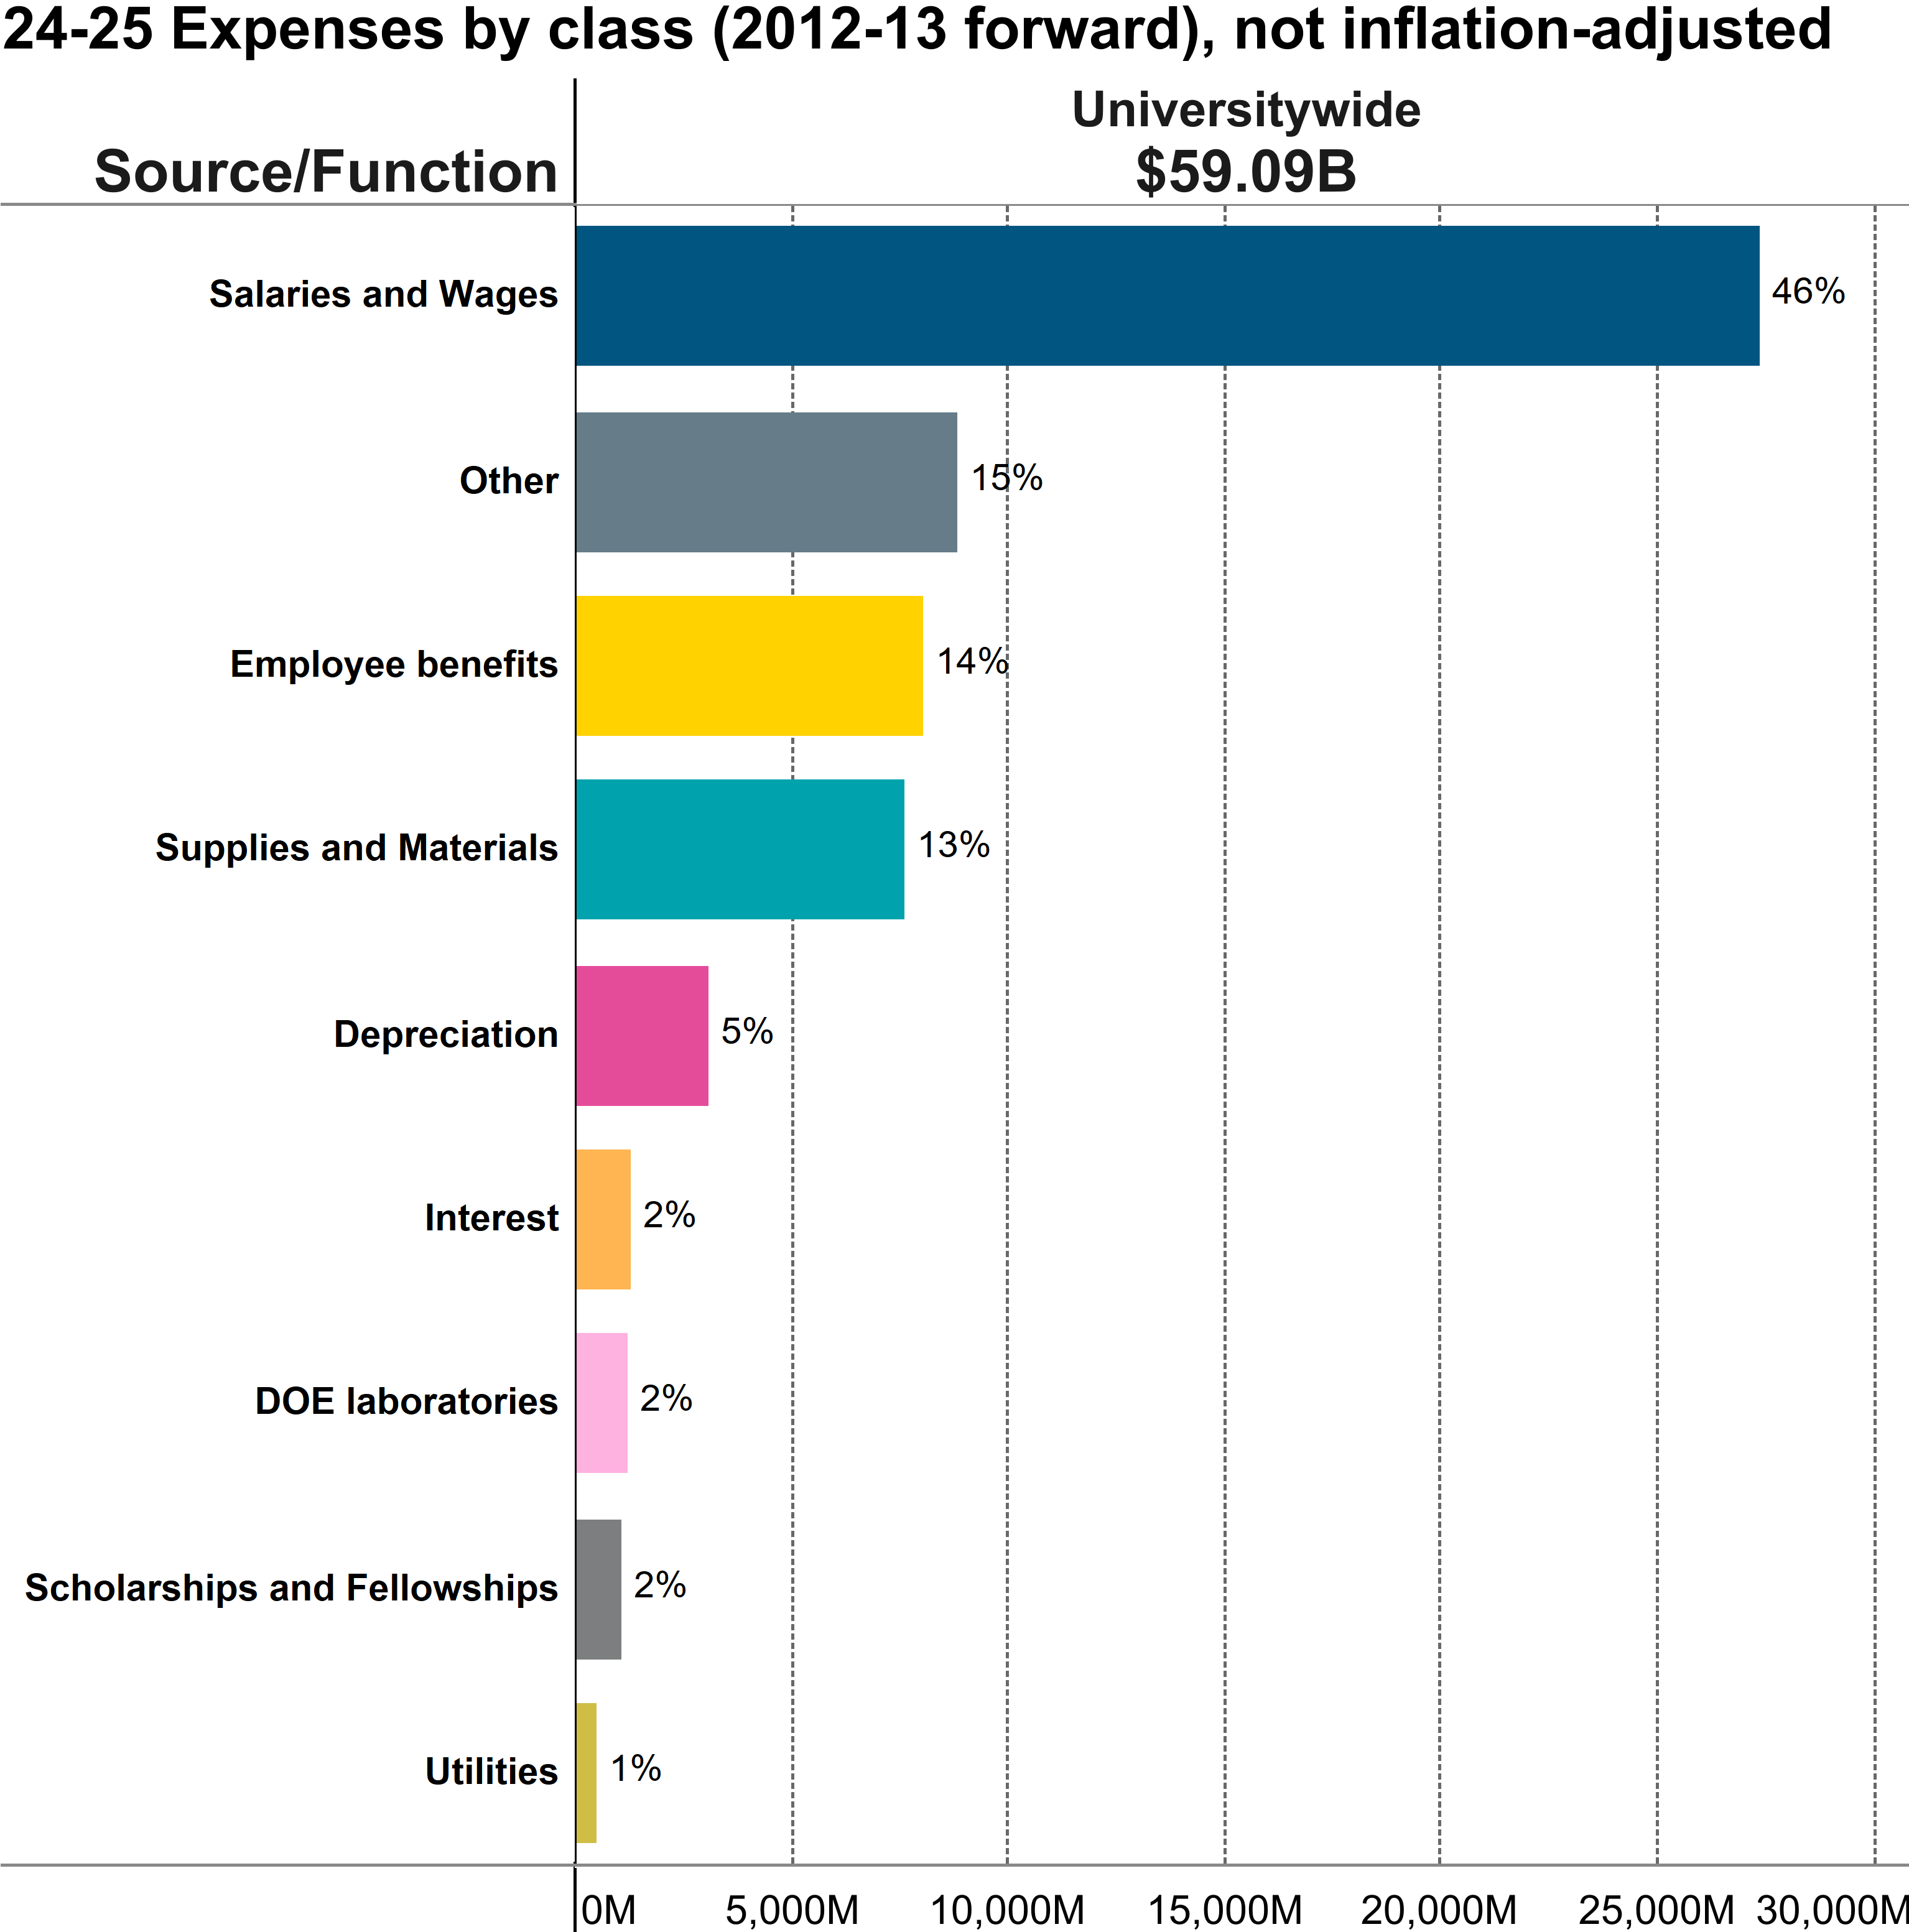
In 2024–25, the University spent $59.1 billion to support its mission of teaching, research, and public service. These expenses fund the University’s fundamental activities of instruction and research; support academic and administrative functions; allow UC to provide public service to the state and its people; and support rich social, cultural, and learning environments on its campuses.
Like revenues, total expenses have almost doubled over the past decade, reflecting growth across nearly all areas of University activity. Medical centers, the top functional expense, have risen faster than any other category, increasing their share of total expenses from 30 percent to 38 percent over the same period.
As the second-largest employer in California, UC’s workforce represents a significant cost driver, with salaries and wages and employee benefits comprising 60 percent of total expenses in 2024–25.
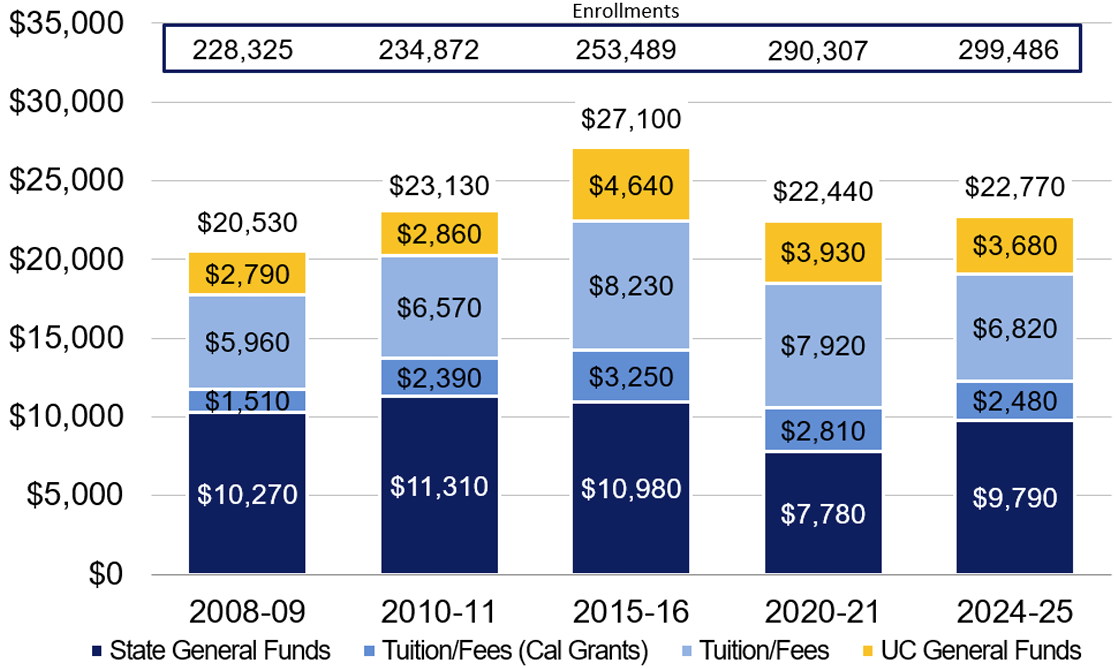
Average expenditures for educating UC students have decreased during periods of recession and as UC has increased enrollments. Educational expenditures per UC student have declined since 2015–16 as recent enrollment growth has outpaced funding growth.
13.1.4 Per-student average expenditures for education (core fund expenditures), 2008–09 to 2024–25, inflation-adjusted

University of California Budget for Current Operations 2026–27 report | page 19
source: UC Budget Analysis and Planning
Expenditures for education, or core fund expenditures, include State General Funds, Cal Grants, tuition and fees, and UC General Funds. Per-student average core fund expenditures have grown 11 percent over the past 16 years. The average core fund expenditure per student increased from $20,530 in 2008–09 to $27,100 in 2015–16 but declined to an estimated $22,770 in 2024–25 due to recent enrollment growth, which has outpaced funding growth.
The share of support provided by the State has been relatively consistent during the past 16 years. State funding for UC, including Cal Grants, totaled $11,780, or 57 percent of per-student expenditures in 2008–09, $13,700 or 59 percent in 2010–11, and has declined slightly to $12,270 or 54 percent in 2024–25.
Revenue derived from tuition and fees, and UC General Funds has grown, driven largely by increases in nonresident supplemental tuition. In 2008–09, tuition and fees represented 29 percent of expenditures for education and increased to 30 percent in 2024–25. The share from UC General Funds grew from 12 percent to 16 percent over the same period.
*These statistics are presented on page 19 of the University of California Budget for Current Operations report.
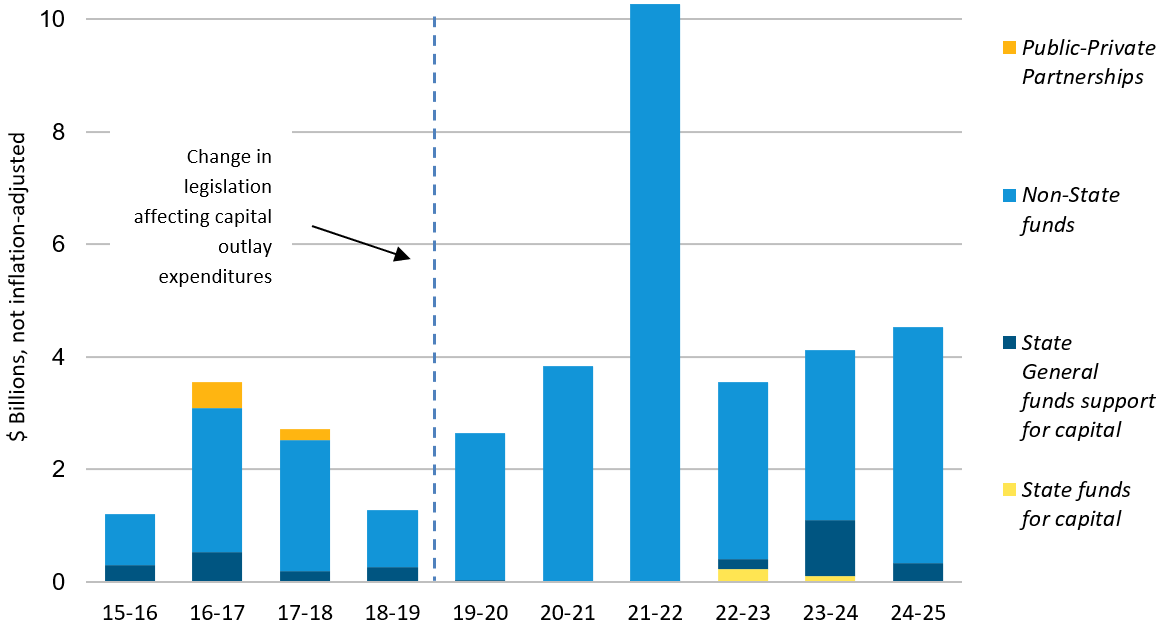
Ninety percent of UC’s capital project funding over the last ten years was derived from non-State fund sources.
13.2.1 Sources of capital project funding by year of approval, Universitywide, 2015–16 to 2024–25
source: UC Capital Asset Strategies
The University’s capital program is driven by the campuses’ and medical centers’ strategic plans. UC’s capital program is funded by a combination of State and non-State funds, with non-State sources funding most of UC’s State-eligible capital needs and self-supporting enterprises, such as housing, parking, athletics, and medical centers. To the extent that non-State funds are used to support core academic capital needs, less funding is available to support other high-priority needs such as deferred maintenance, seismic, and enrollment growth.
Note that the spike in capital project funding in 2021–22 was largely to support two medical center projects — UCD Health’s California Hospital Tower and a new hospital at UCSF (Helen Diller Medical Center at Parnassus). Most of the increase in State support in 2023–24 is largely attributable to the California Higher Education Student Housing Grant Program.
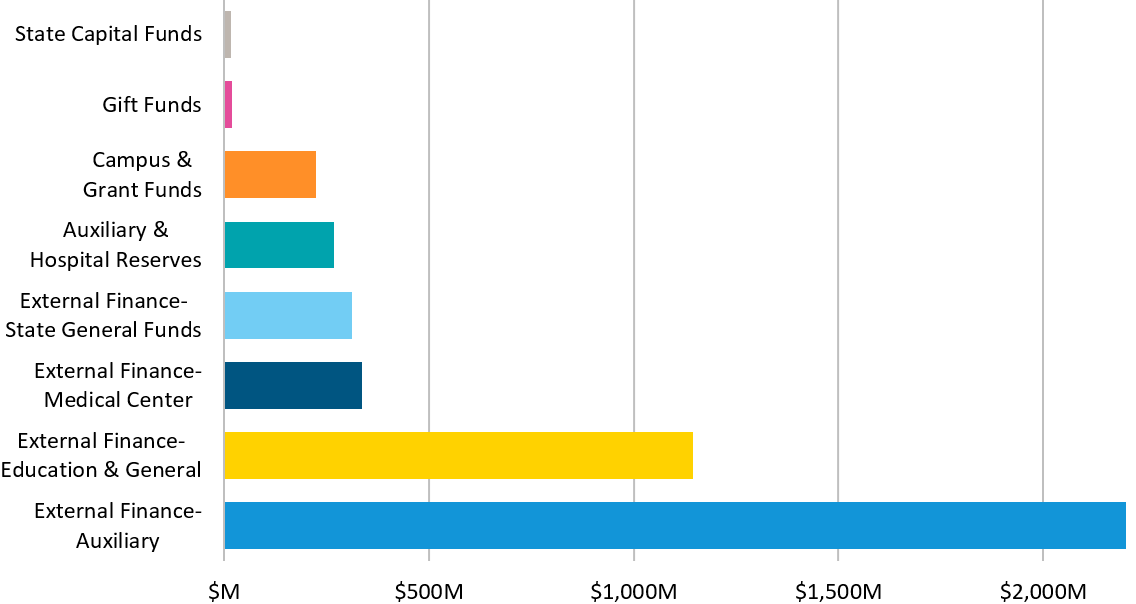
The 2024–25 capital project program is heavily supported by external financing.
13.2.2 Sources of capital project spending detail, Universitywide, Project budgets approved in 2024–25
source: UC Capital Asset Strategies
External financing is a crucial component in supporting UC’s capital outlay. In 2024–25, seven percent of the program was sourced from external financing supported by State resources and 81 percent of the funding was sourced from non-State supported external financing. Approximately 98 percent of the financing for auxiliary enterprises supported increasing the University’s housing supply. The non-State financing also included medical center as well as renewal and modernization of instructional and research space and program improvements (education and general).
The remainder of UC’s capital program is funded by gift funds, campus funds, and other non-State sources. These campus funds are derived from various sources, including indirect cost recovery and investment earnings.
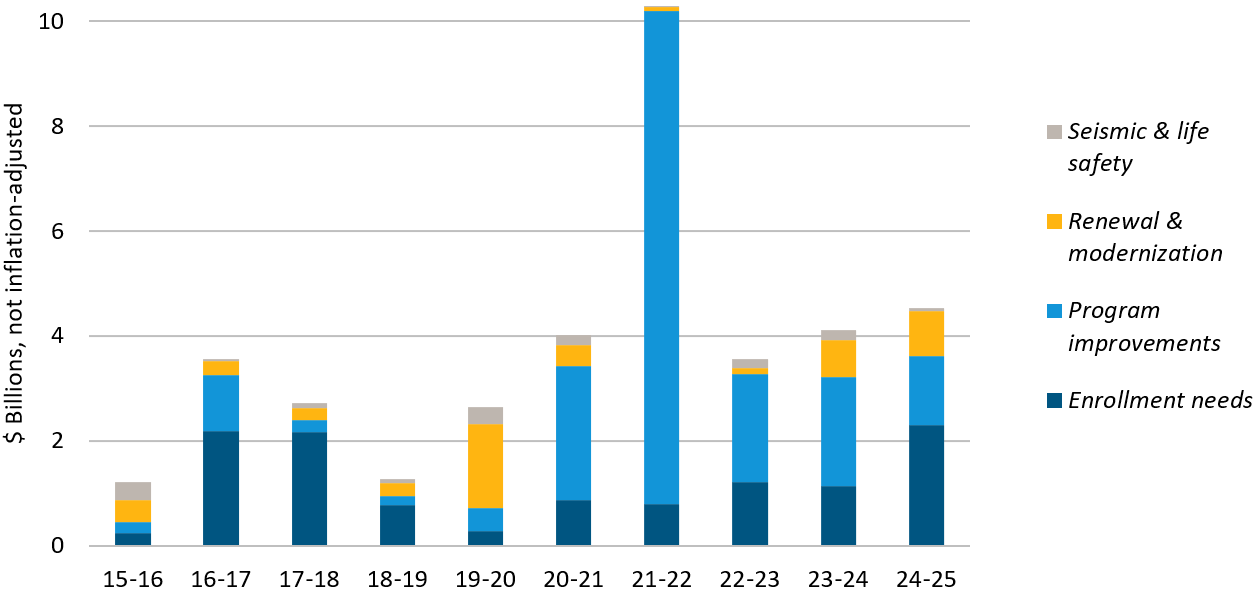
Eighty percent of capital funds approved for expenditure in 2024–25 supported program improvements and projects addressing enrollment growth.
13.2.3 Types of capital projects, based on budgets approved by year, Universitywide, 2015–16 to 2024–25
source: UC Capital Asset Strategies
Program improvements and modern program initiatives require state-of-the-art space, often necessitating the repurposing of existing facilities or new construction. During 2024–25, UC approved capital project budgets totaling $4.5 billion.
The capital outlay supported a variety of projects with $1.3 billion for program improvements. A significant portion of the program improvements investment (83 percent) supported two campus projects — UCSF’s Acquisition of Life Science Buildings, and improvements at UCLA’s recently acquired life sciences building in unincorporated Los Angeles County which will be used to establish a Sports Medicine Institute.
Additionally, UC approved $2.3 billion for projects focused on meeting the demands of increasing enrollments, with the majority directed towards expanding student housing. Notably, 90 percent of these funds supported housing projects at Berkeley, Los Angeles, Merced, and Santa Barbara (UCB Bancroft Fulton Campus Housing Development; UCLA 901 Levering Student Housing; UCM Promise Housing, fully funded by State resources; UCSB San Benito Student Housing; and UCSB East Campus Student Housing, partially funded by State resources).
The remaining $900 million supported projects that addressed renewal and modernization as well as seismic and life safety.
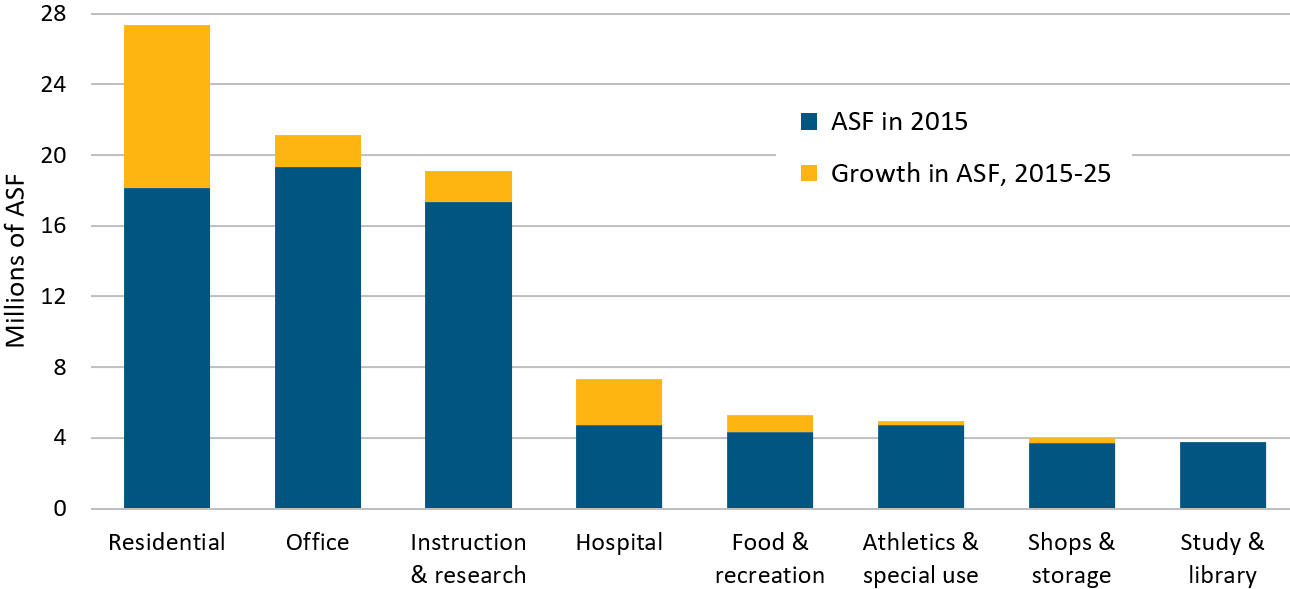
UC space has increased by twenty-two percent in the past decade, with over half of the growth targeted for residential use.
13.2.4 Assignable square footage (ASF), Universitywide, 2015–2025
source: UC Capital Asset Strategies
Assignable square footage (ASF) is the space available for programs or assigned to specific uses. It does not include corridors, bathrooms, or building infrastructure. Indicator 13.2.4 illustrates the growth in space over the last decade, according to categories for assignable space. Since 2015, space has increased by 16.7 million ASF to 92.9 million ASF.
In the past decade, instructional and research space increased by about 1.7 million ASF, office space by 1.8 million ASF, and residential space by 9.2 million ASF. Residential space has grown as campuses strive for more on-campus student housing to improve student life in living/learning communities and to reduce environmental impacts from commuting. Increases in the student population have also required additional athletic, recreational, and food service space.
The lack of affordable housing is a problem in California and the nation. The University of California is working diligently to identify ways to support students with their housing. The University continues to access sources of funding to support the development of housing to serve UC’s student population.
Hospital space has also grown in the past decade. All five medical centers experienced growth, but most of the growth in hospital space can be attributed to recent acquisitions by UC Irvine Health of four community hospitals with their associated outpatient locations (2024) and completion of the Irvine Campus Medical Complex (2025), UCSF Health’s Medical Center at Mission Bay (2015) and Bayfront Medical Building (2024), and UC San Diego Health’s Jacobs Medical Center (2016).
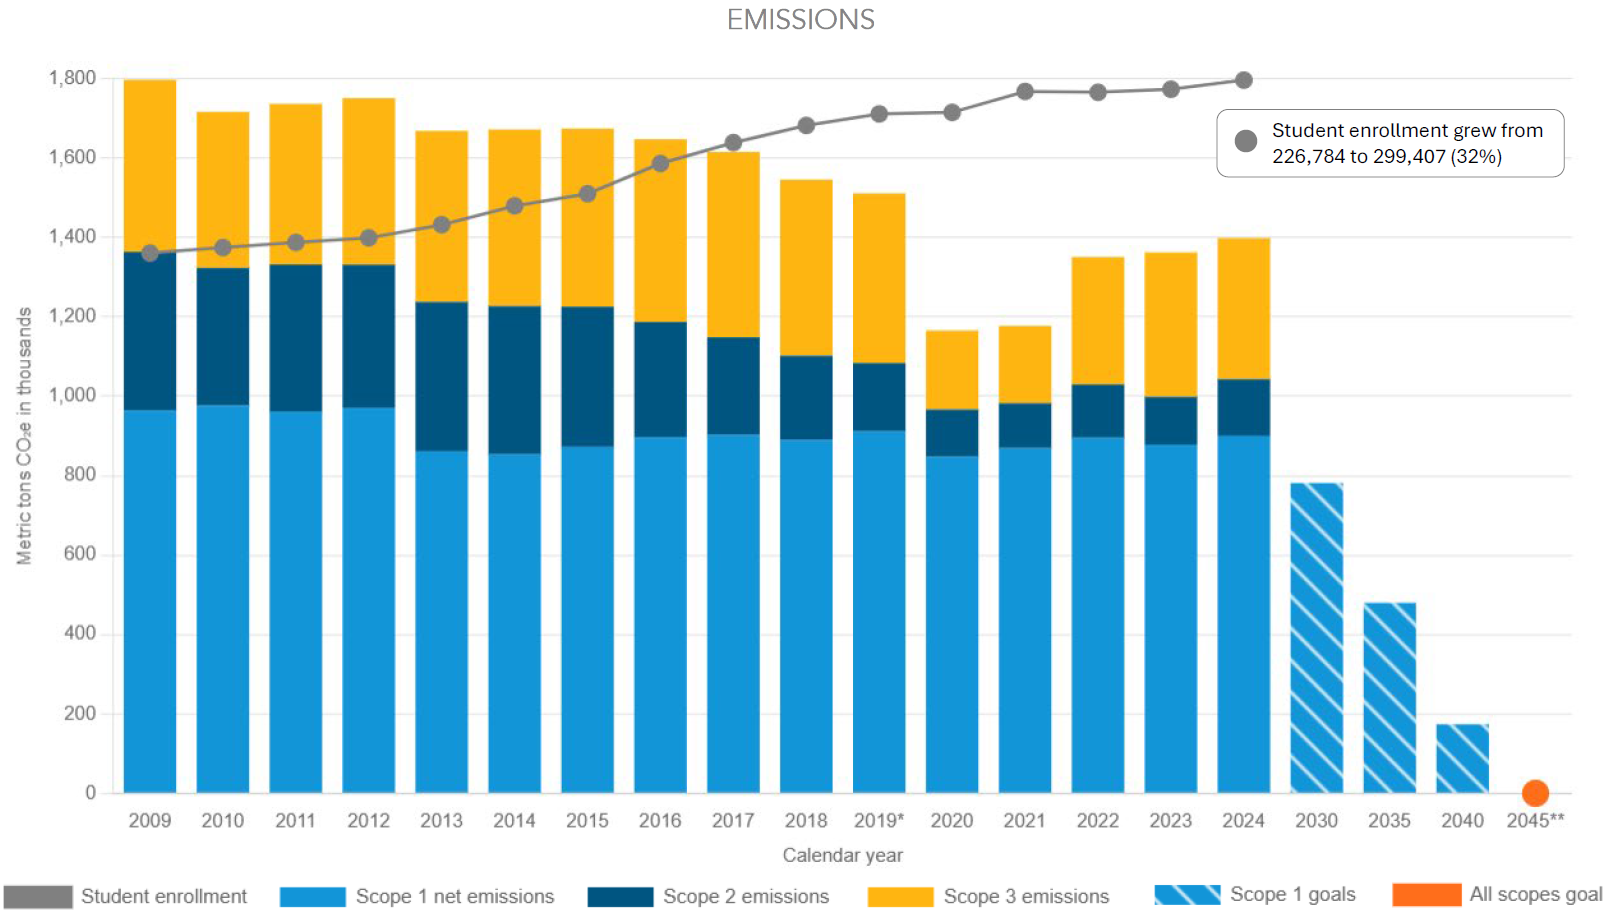
The University’s total greenhouse gas emissions increased by approximately three percent in 2024 but remained down eight percent from pre-pandemic levels despite steadily increasing enrollment over the same period.
13.3.1 Greenhouse gas emissions compared to climate goals, Universitywide, 2009–2024

2025 Annual Sustainability Report – Policy progress: Climate
source: 2025 Annual Sustainability Report
* Methodological changes in scope 3 accounting introduced beginning in 2019.
** 90 percent direct reduction of total emissions from 2019 levels with residual emissions negated by carbon removal.
Note: Systemwide GHG emissions are based on campuses’ and academic health centers’ reported emissions, which will be verified by a third party by early 2026.
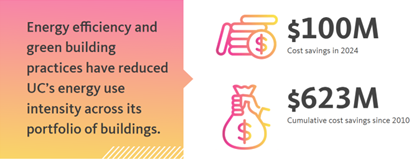
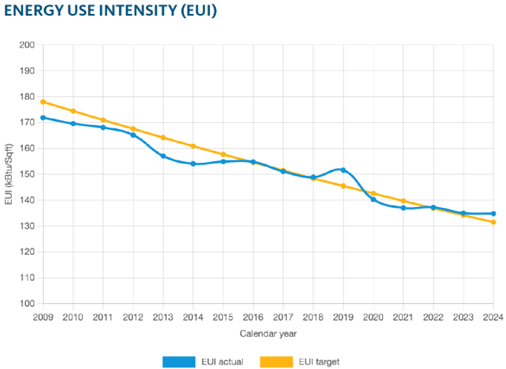
In 2024, UC locations sustained pandemic-era savings while accommodating increased occupancy and campus activity, reducing energy use by nearly two percent systemwide.
13.3.2 Energy costs savings and energy use intensity, Universitywide, 2009–2024
2025 Annual Sustainability Report – Policy Progress: Energy
source: 2025 Annual Sustainability Report
As a metric for relative efficiency, energy use intensity (EUI) is calculated by totaling all of the energy used by a location and dividing the sum by the associated square footage. Despite achieving just under a two percent annual reduction in EUI in 2024, the University needs to drive additional efficiency increases over the next two performance years to meet UC’s cumulative goal.
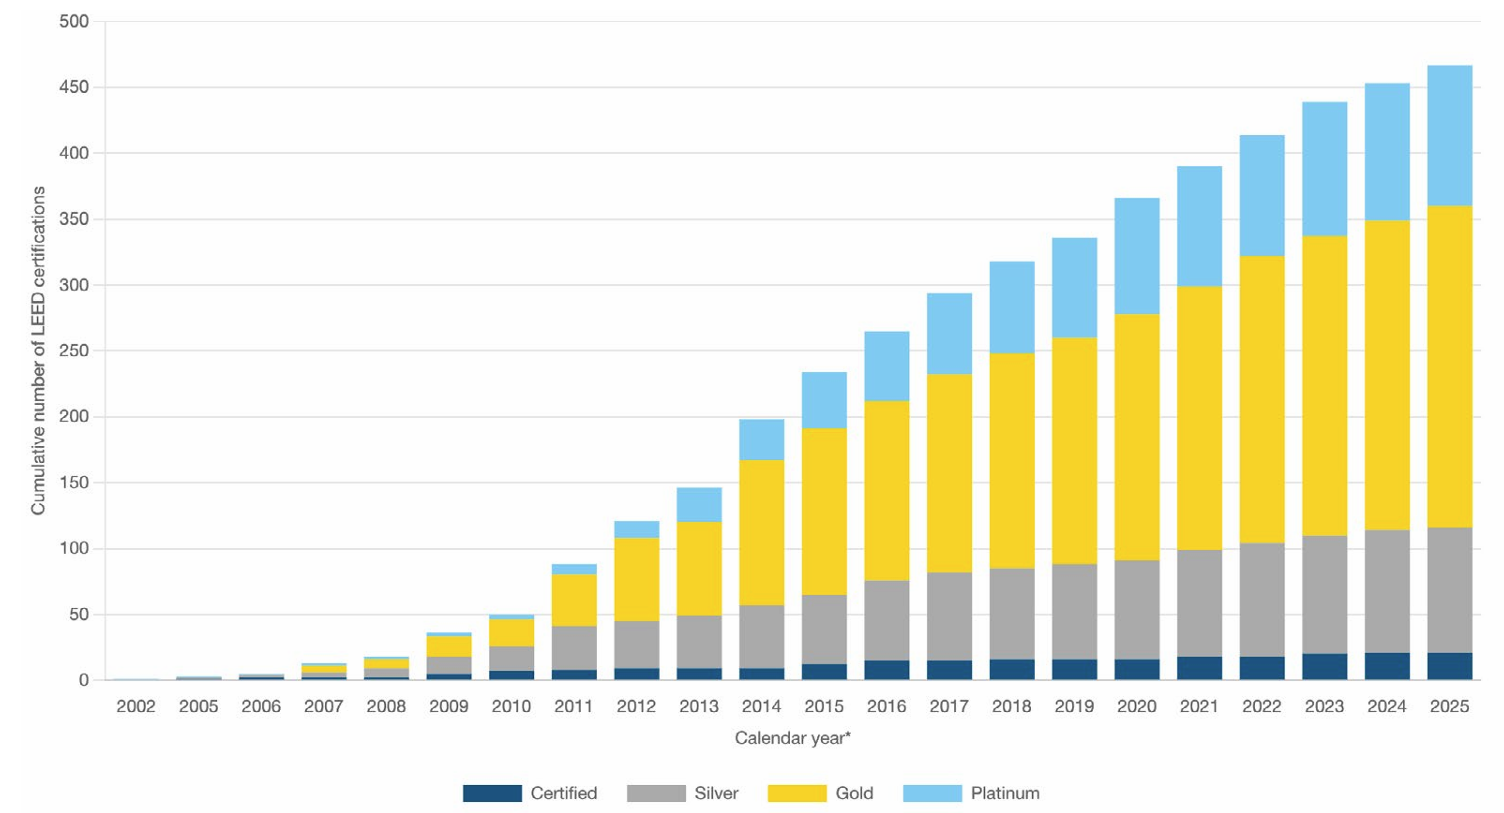
By mid-2025, UC had achieved 467 LEED® certifications.
13.3.3 LEED® certifications, Universitywide, 2002–2025 (cumulative)
2025 Annual Sustainability Report – Policy Progress: Green Building
source: 2025 Annual Sustainability Report
In the past fiscal year, UC locations reported 14 new LEED-certified green building projects: three Platinum, nine Gold, and two Silver certifications. UC’s total LEED certifications now include 467 projects, representing approximately 41 million square feet. The past year saw an increase in the University’s all-electric building portfolio, which now comprises 45 buildings, exceeding 4.5 million square feet of occupied space. An additional six facilities (one million square feet) use only electricity for space and water heating. UC campuses continue to add to this total, with another 50 all-electric buildings in planning, design, and construction phases, totaling almost 11 million square feet. UC locations are pursuing Parksmart certification for nine new parking projects, adding to the University’s five existing certified facilities.
* Data reported only accounts for buildings certified through the first half of 2025.
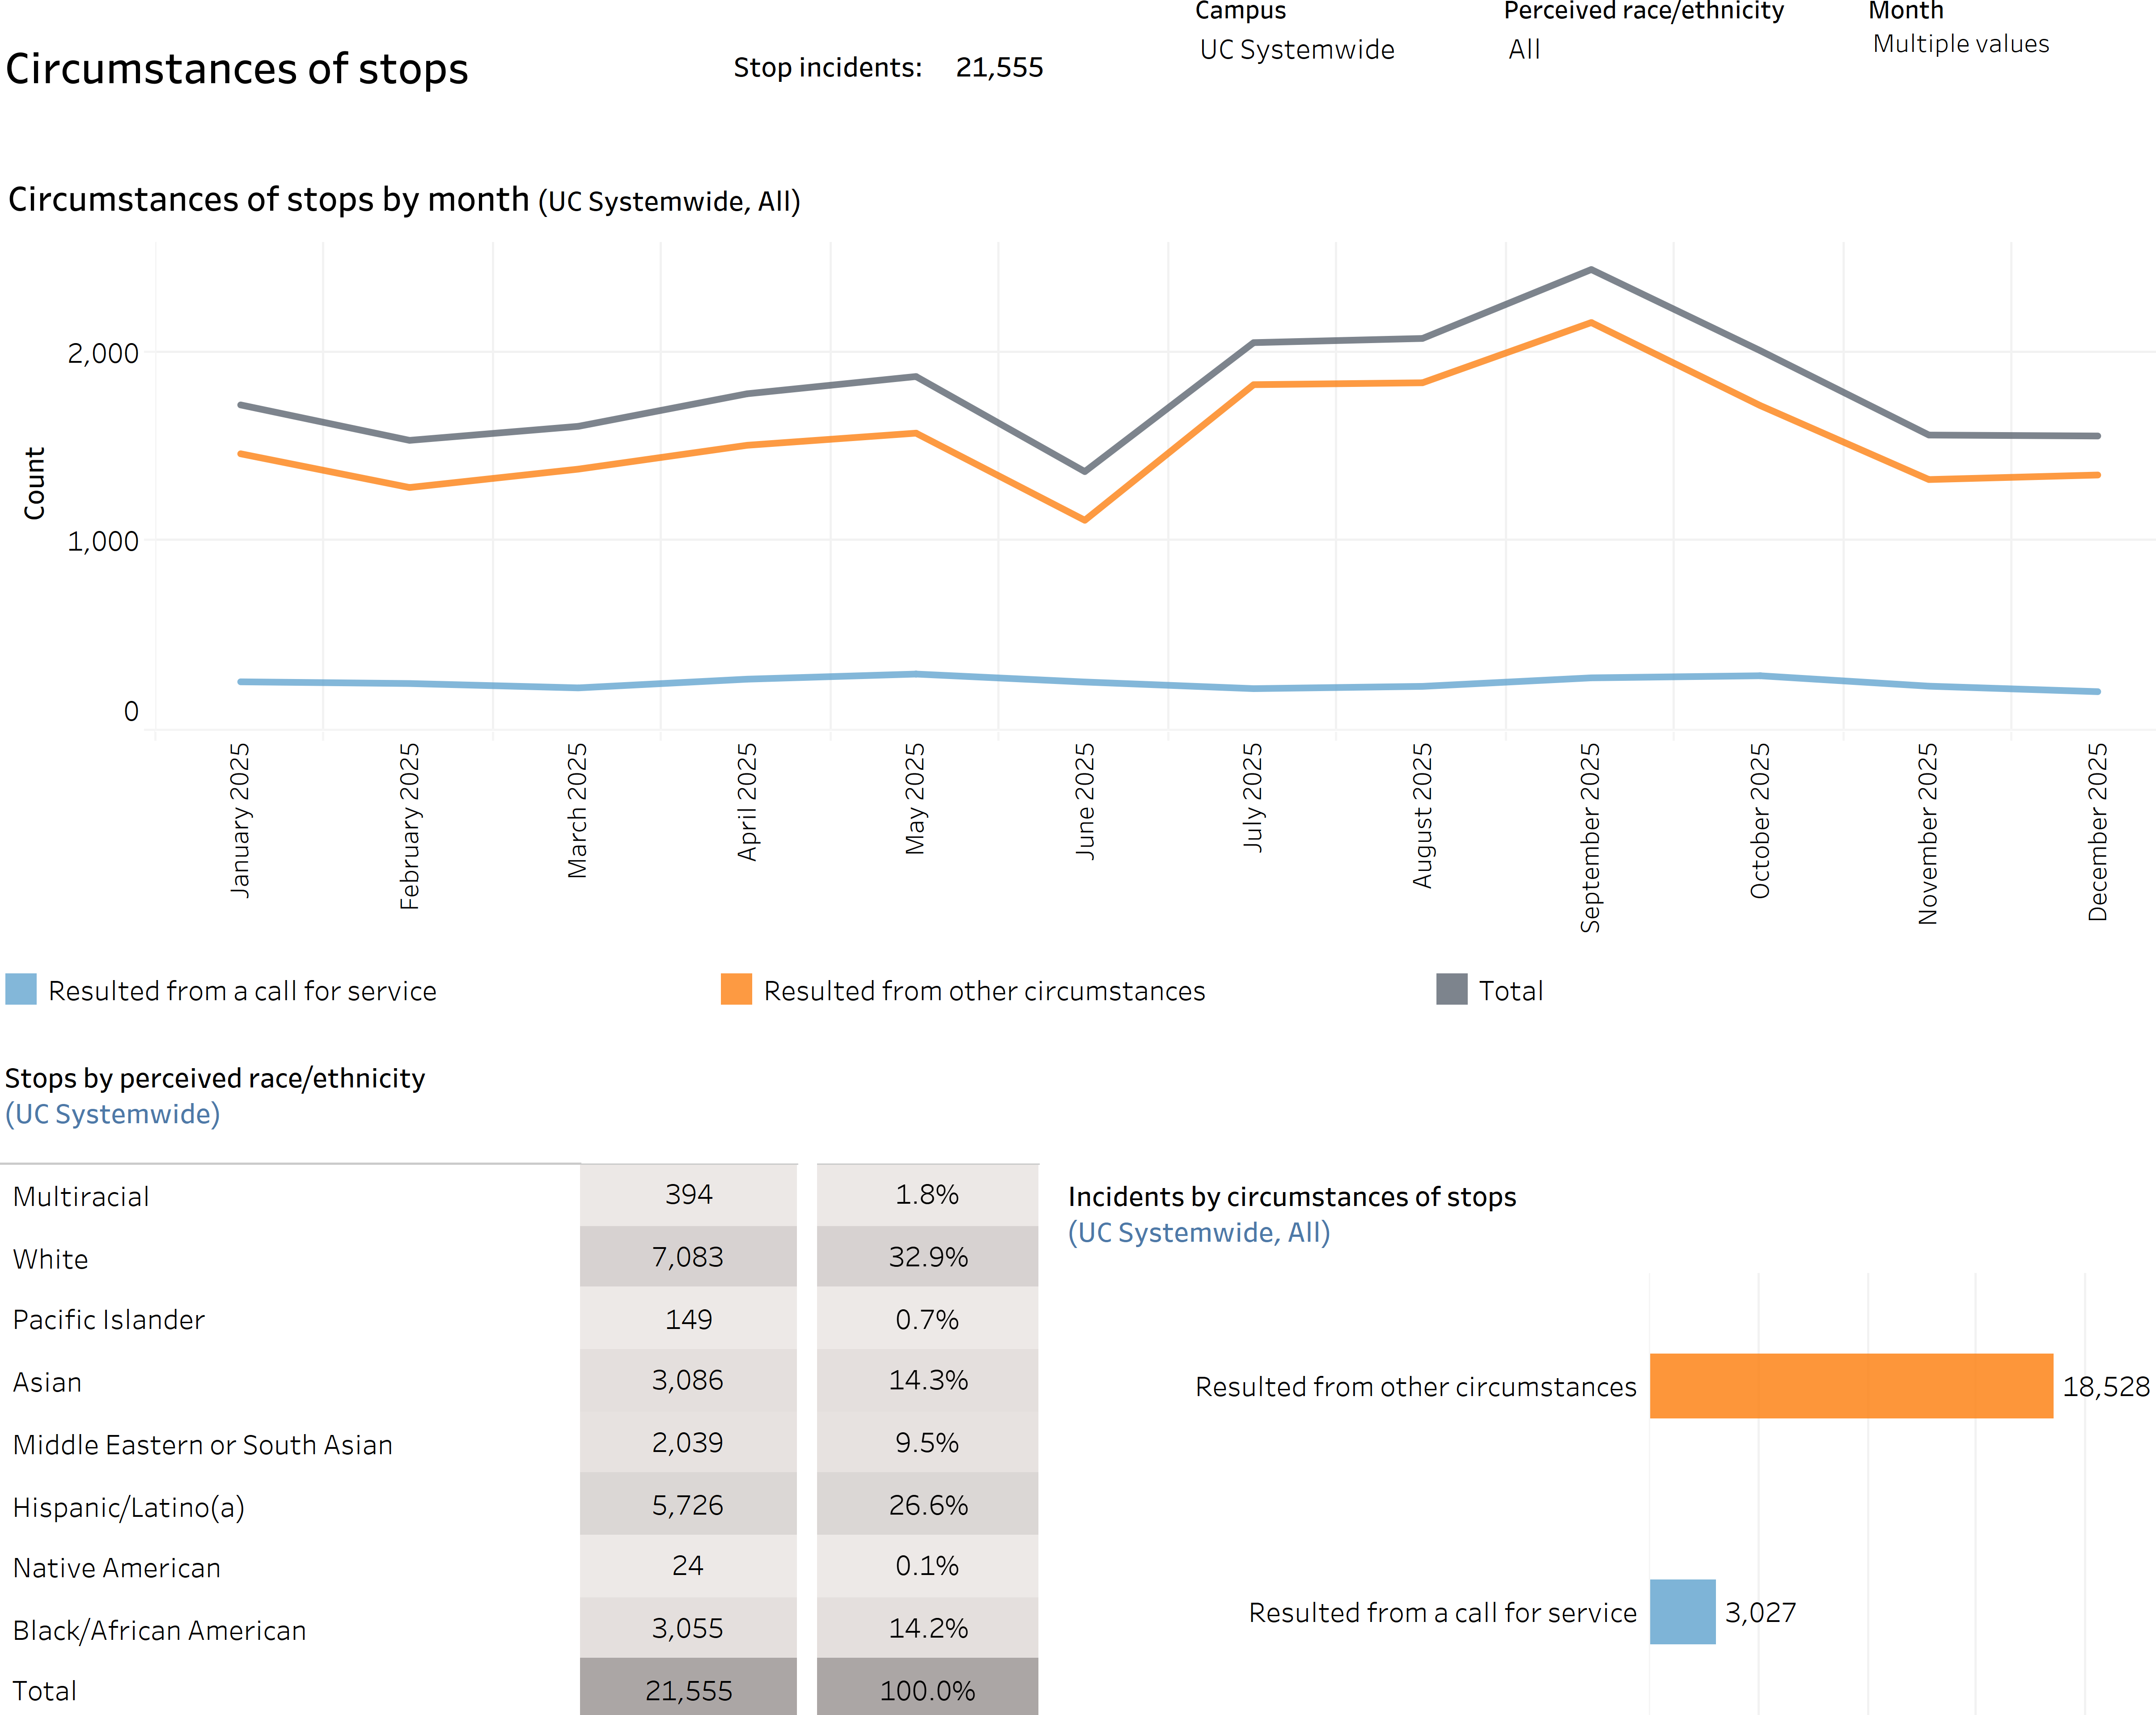
UC campus police made 21,555 stops in 2025, twelve percent more than the prior year.
13.4.1 Number and circumstances of UCPD stops by month, Universitywide, 2025
Community safety: Stops dashboard
source: Quarterly data submissions from UC police departments
The vast majority (about 86 percent) were officer-initiated stops, mostly for traffic violations, and most ended with just a warning. About 3,027 stops resulted from a call for service, 13.6 percent fewer than in the prior year. In 2025, stops peaked in September (aligned with fall season) and dipped sharply in June (aligned with summer slowdown). Hispanic/Latino(a) individuals accounted for 26.6 percent of stops, the second-largest group. White individuals made up 32.9 percent, the largest share. Most UC police stops are proactive and they are growing. That raises fair questions about who is being stopped, why, and whether warnings are the right outcome when stops do not involve a safety concern.
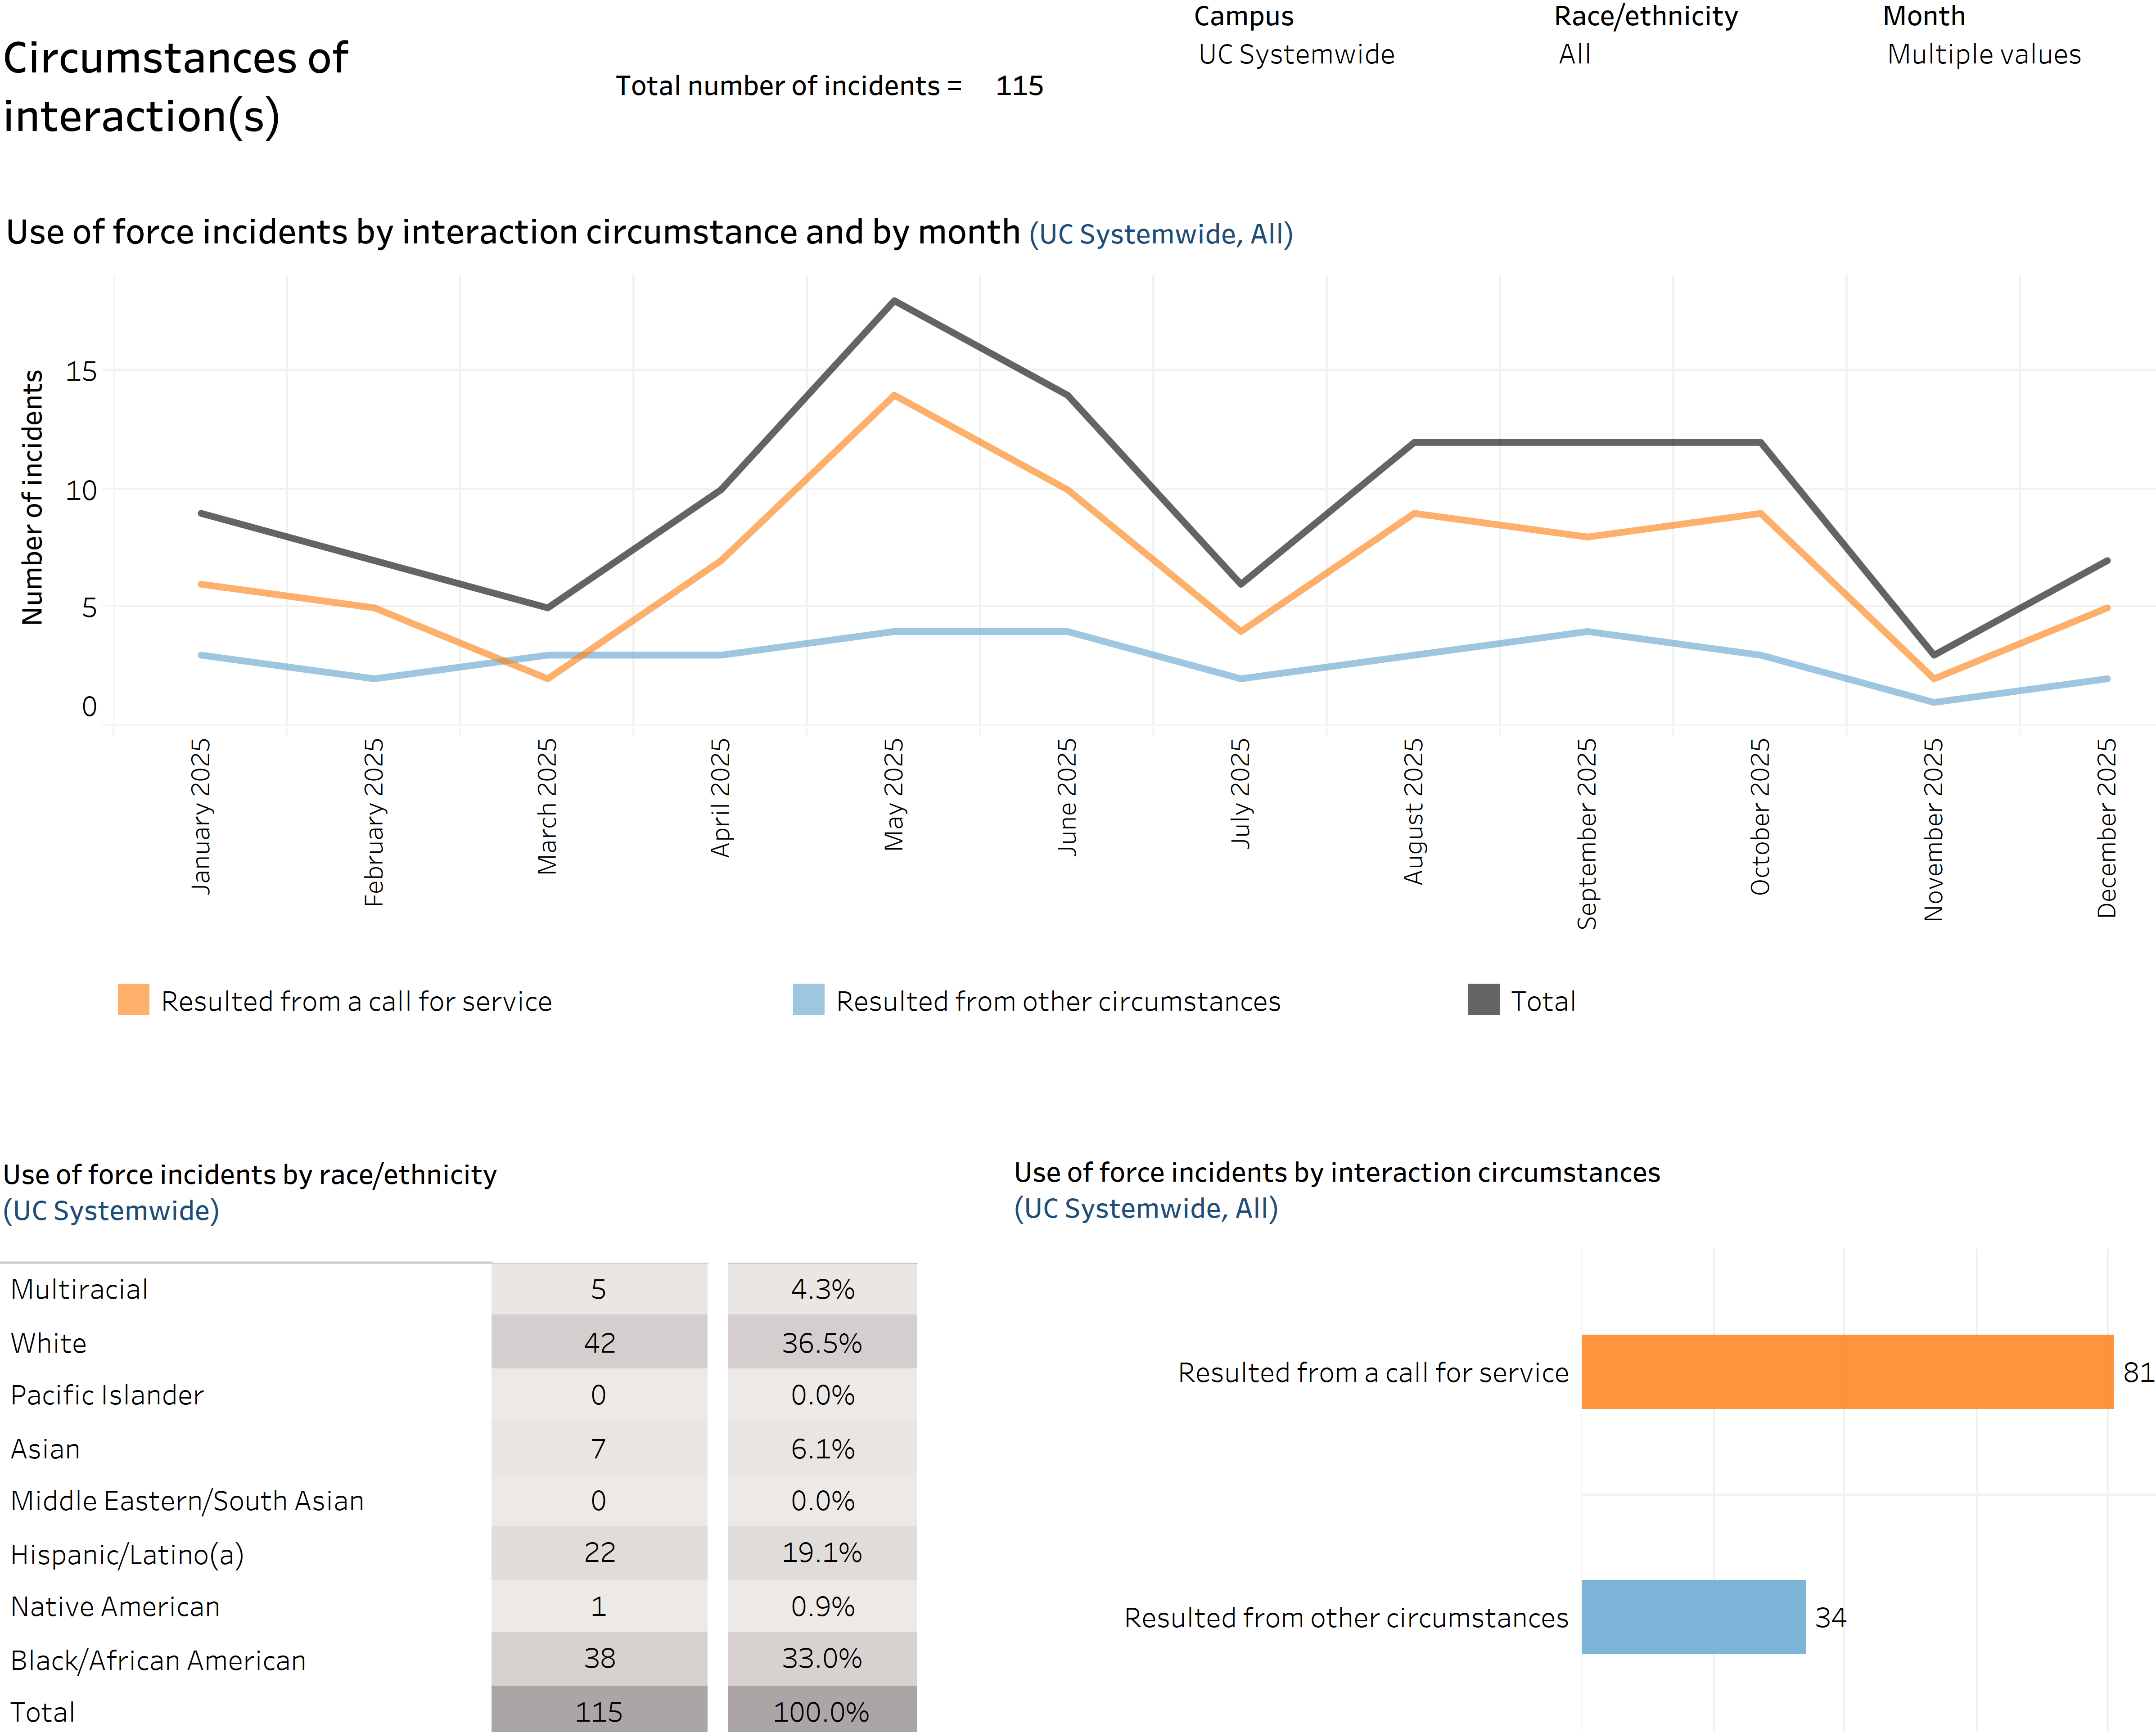
UC campus police reported 115 use of force incidents in 2025, mostly during emergency calls, down from 129 the year before.
13.4.2 Number of UCPD use of force incidents by month, Universitywide, 2025
UCPD use of force data dashboard
source: Quarterly data submissions from UC police departments
Force was used in 115 incidents: 81 of them (over 70 percent) were triggered by calls for service, meaning someone asked for help and force followed, and 34 were officer-initiated stops or encounters. May 2025 was a high point with nearly 17 incidents. Black/African American individuals were involved in 38 incidents (33 percent), while Hispanic/Latino(a) individuals accounted for 22 incidents (19 percent). The most common use of force was a physical technique, not a weapon. The use of force reporting varies across UC campuses. UC police chiefs are working to standardize how these use of force incidents get logged. Use of force is declining; however, who bears the brunt of it, and whether every incident is being recorded, are still open questions.
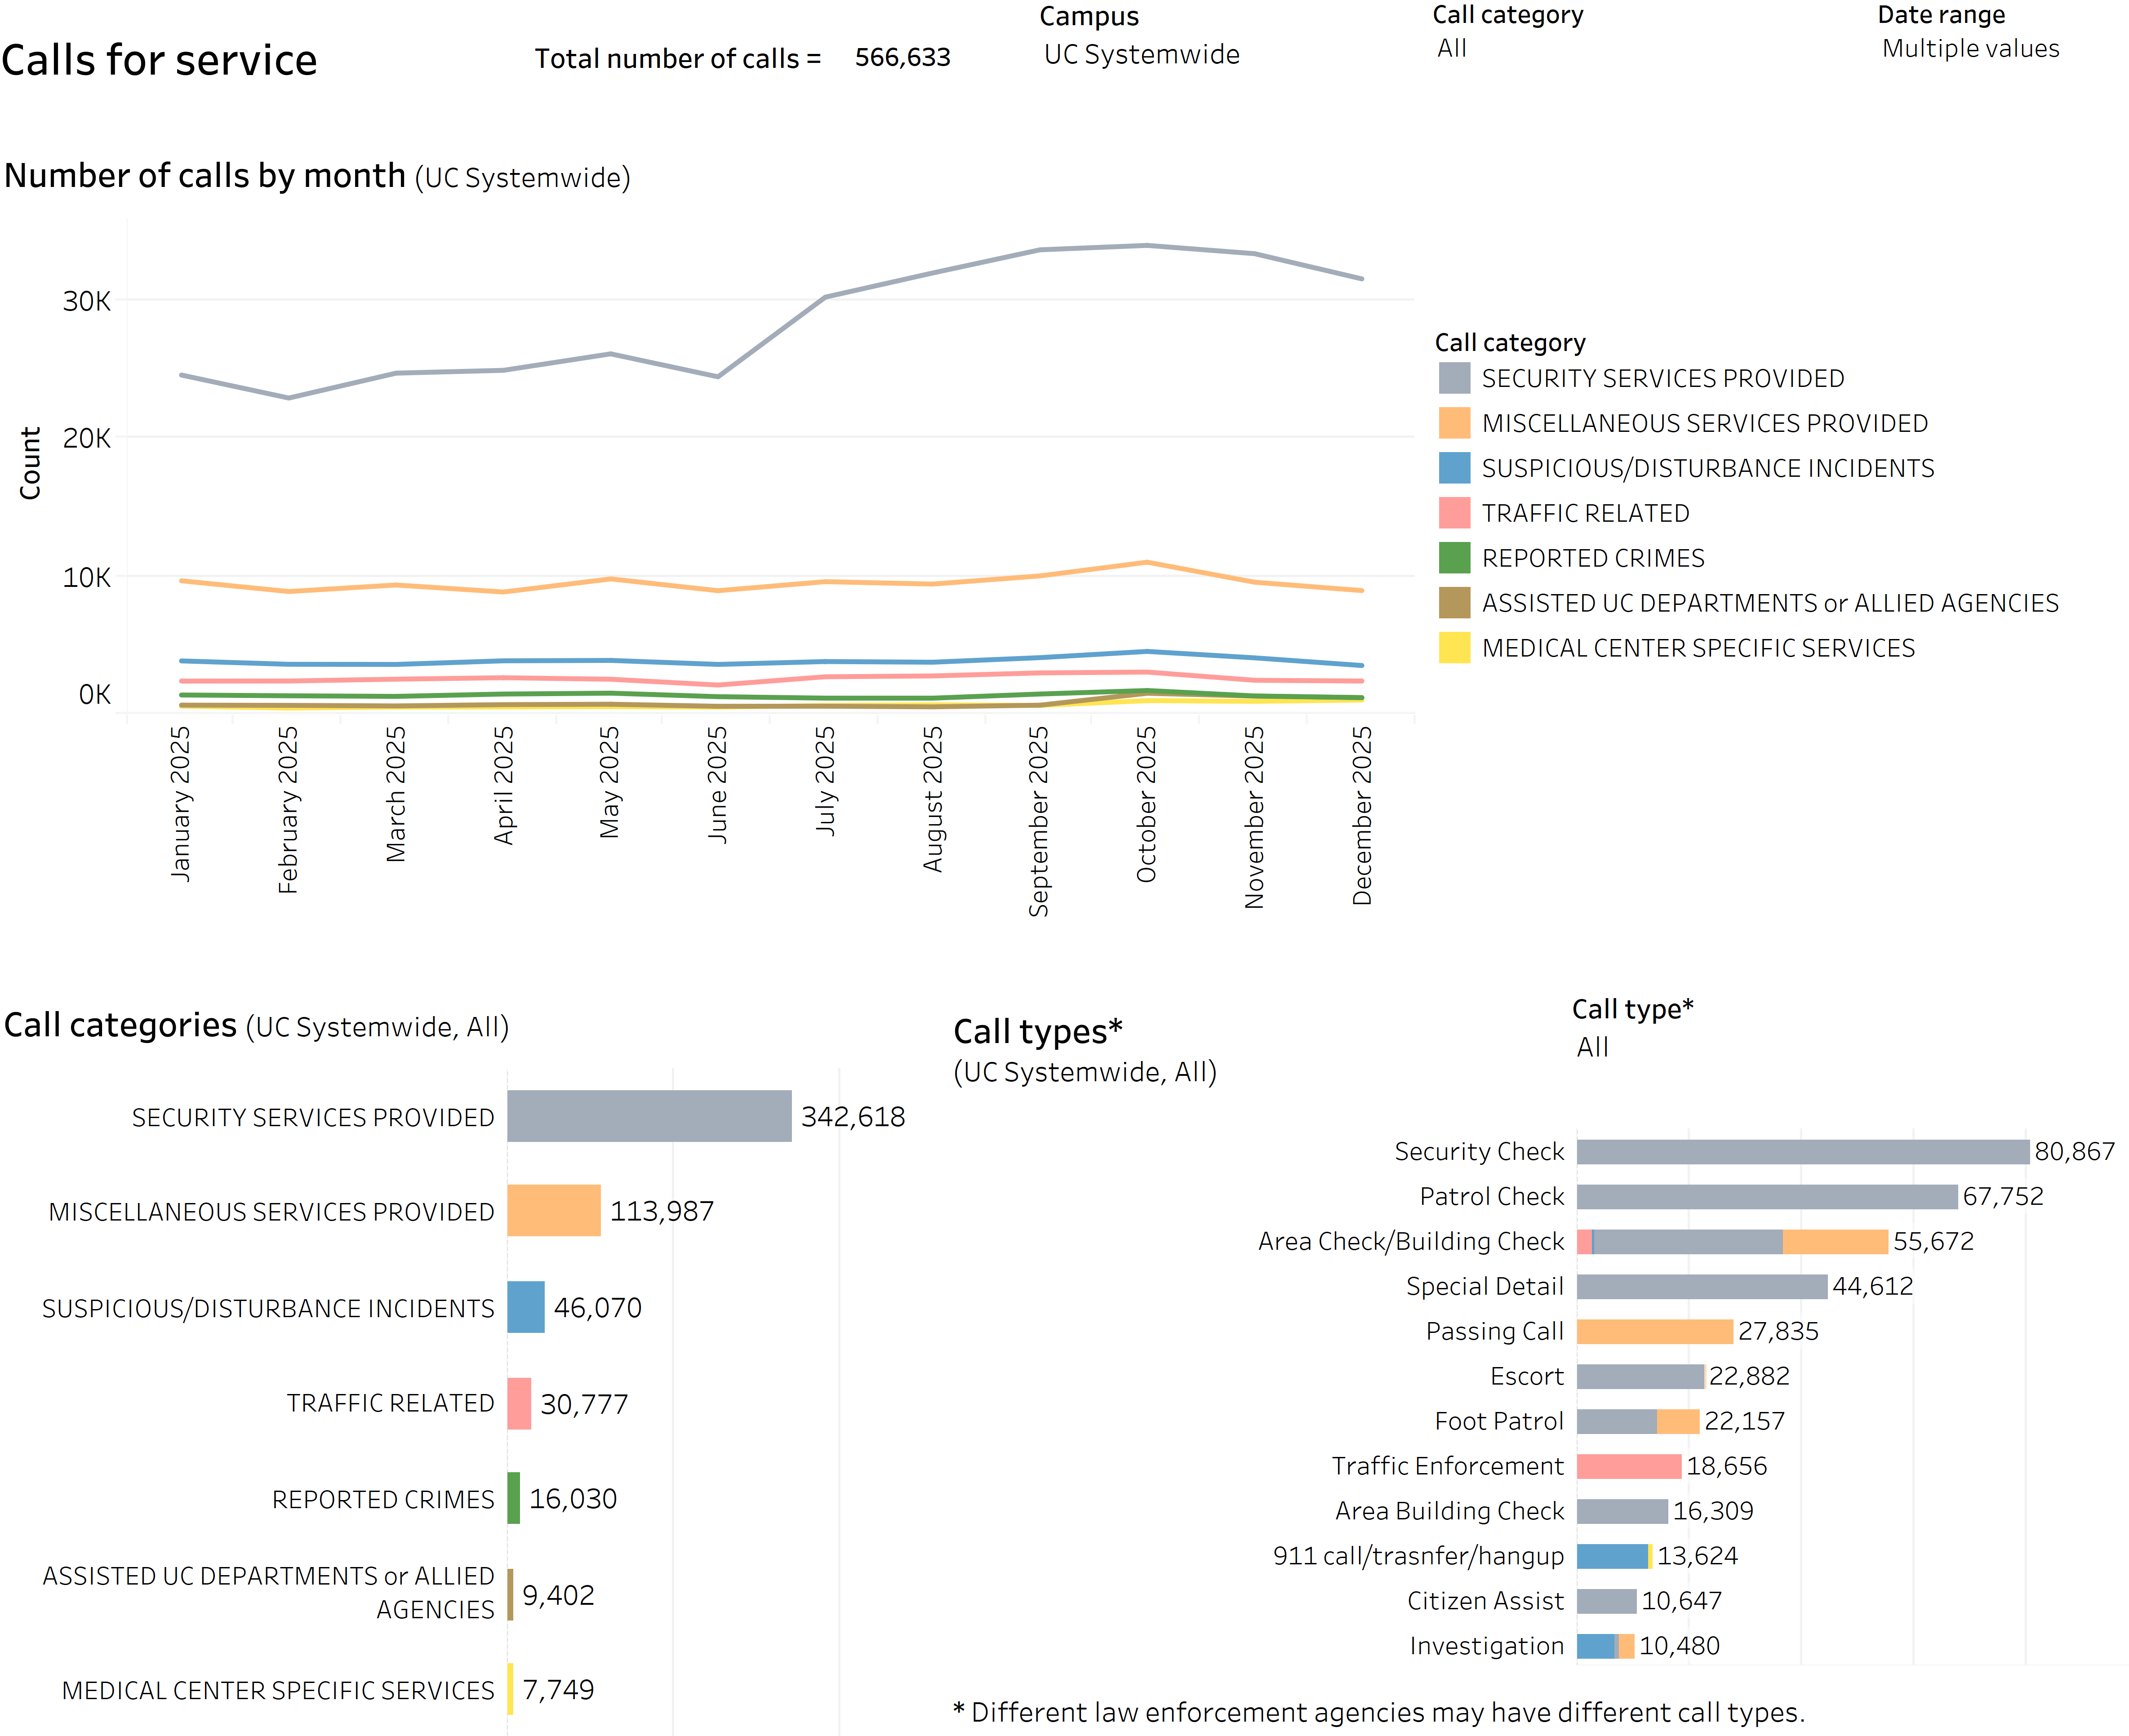
Calls to UC police jumped twenty percent in 2025, totaling more than 566,600 calls across the system, resulting in a significant surge from the prior year. Most were security checks, not emergencies or crime reports.
13.4.3 Number of UCPD calls for service by call category, Universitywide, 2025
UCPD calls for service data dashboard
source: Quarterly data submissions from UC police departments
The majority of calls for service were for routine security tasks, such as checking buildings, running patrols, and escorting people. 342,618 calls (60 percent) were for security services i.e., the single largest category. 46,070 (eight percent) involved suspicious activity or disturbances, 30,777 (5.4 percent) were traffic-related, and 16,030 (only 2.8 percent) were reported crimes. 80,867 individual callouts were security checks alone, which makes it the most common call type.
Call volume climbed steadily from January through October 2025, then leveled off. That upward trend, combined with a 20 percent year-over-year increase, suggests growing demand on UC police departments. The dashboard linked above provides additional information about calls for service by campus.
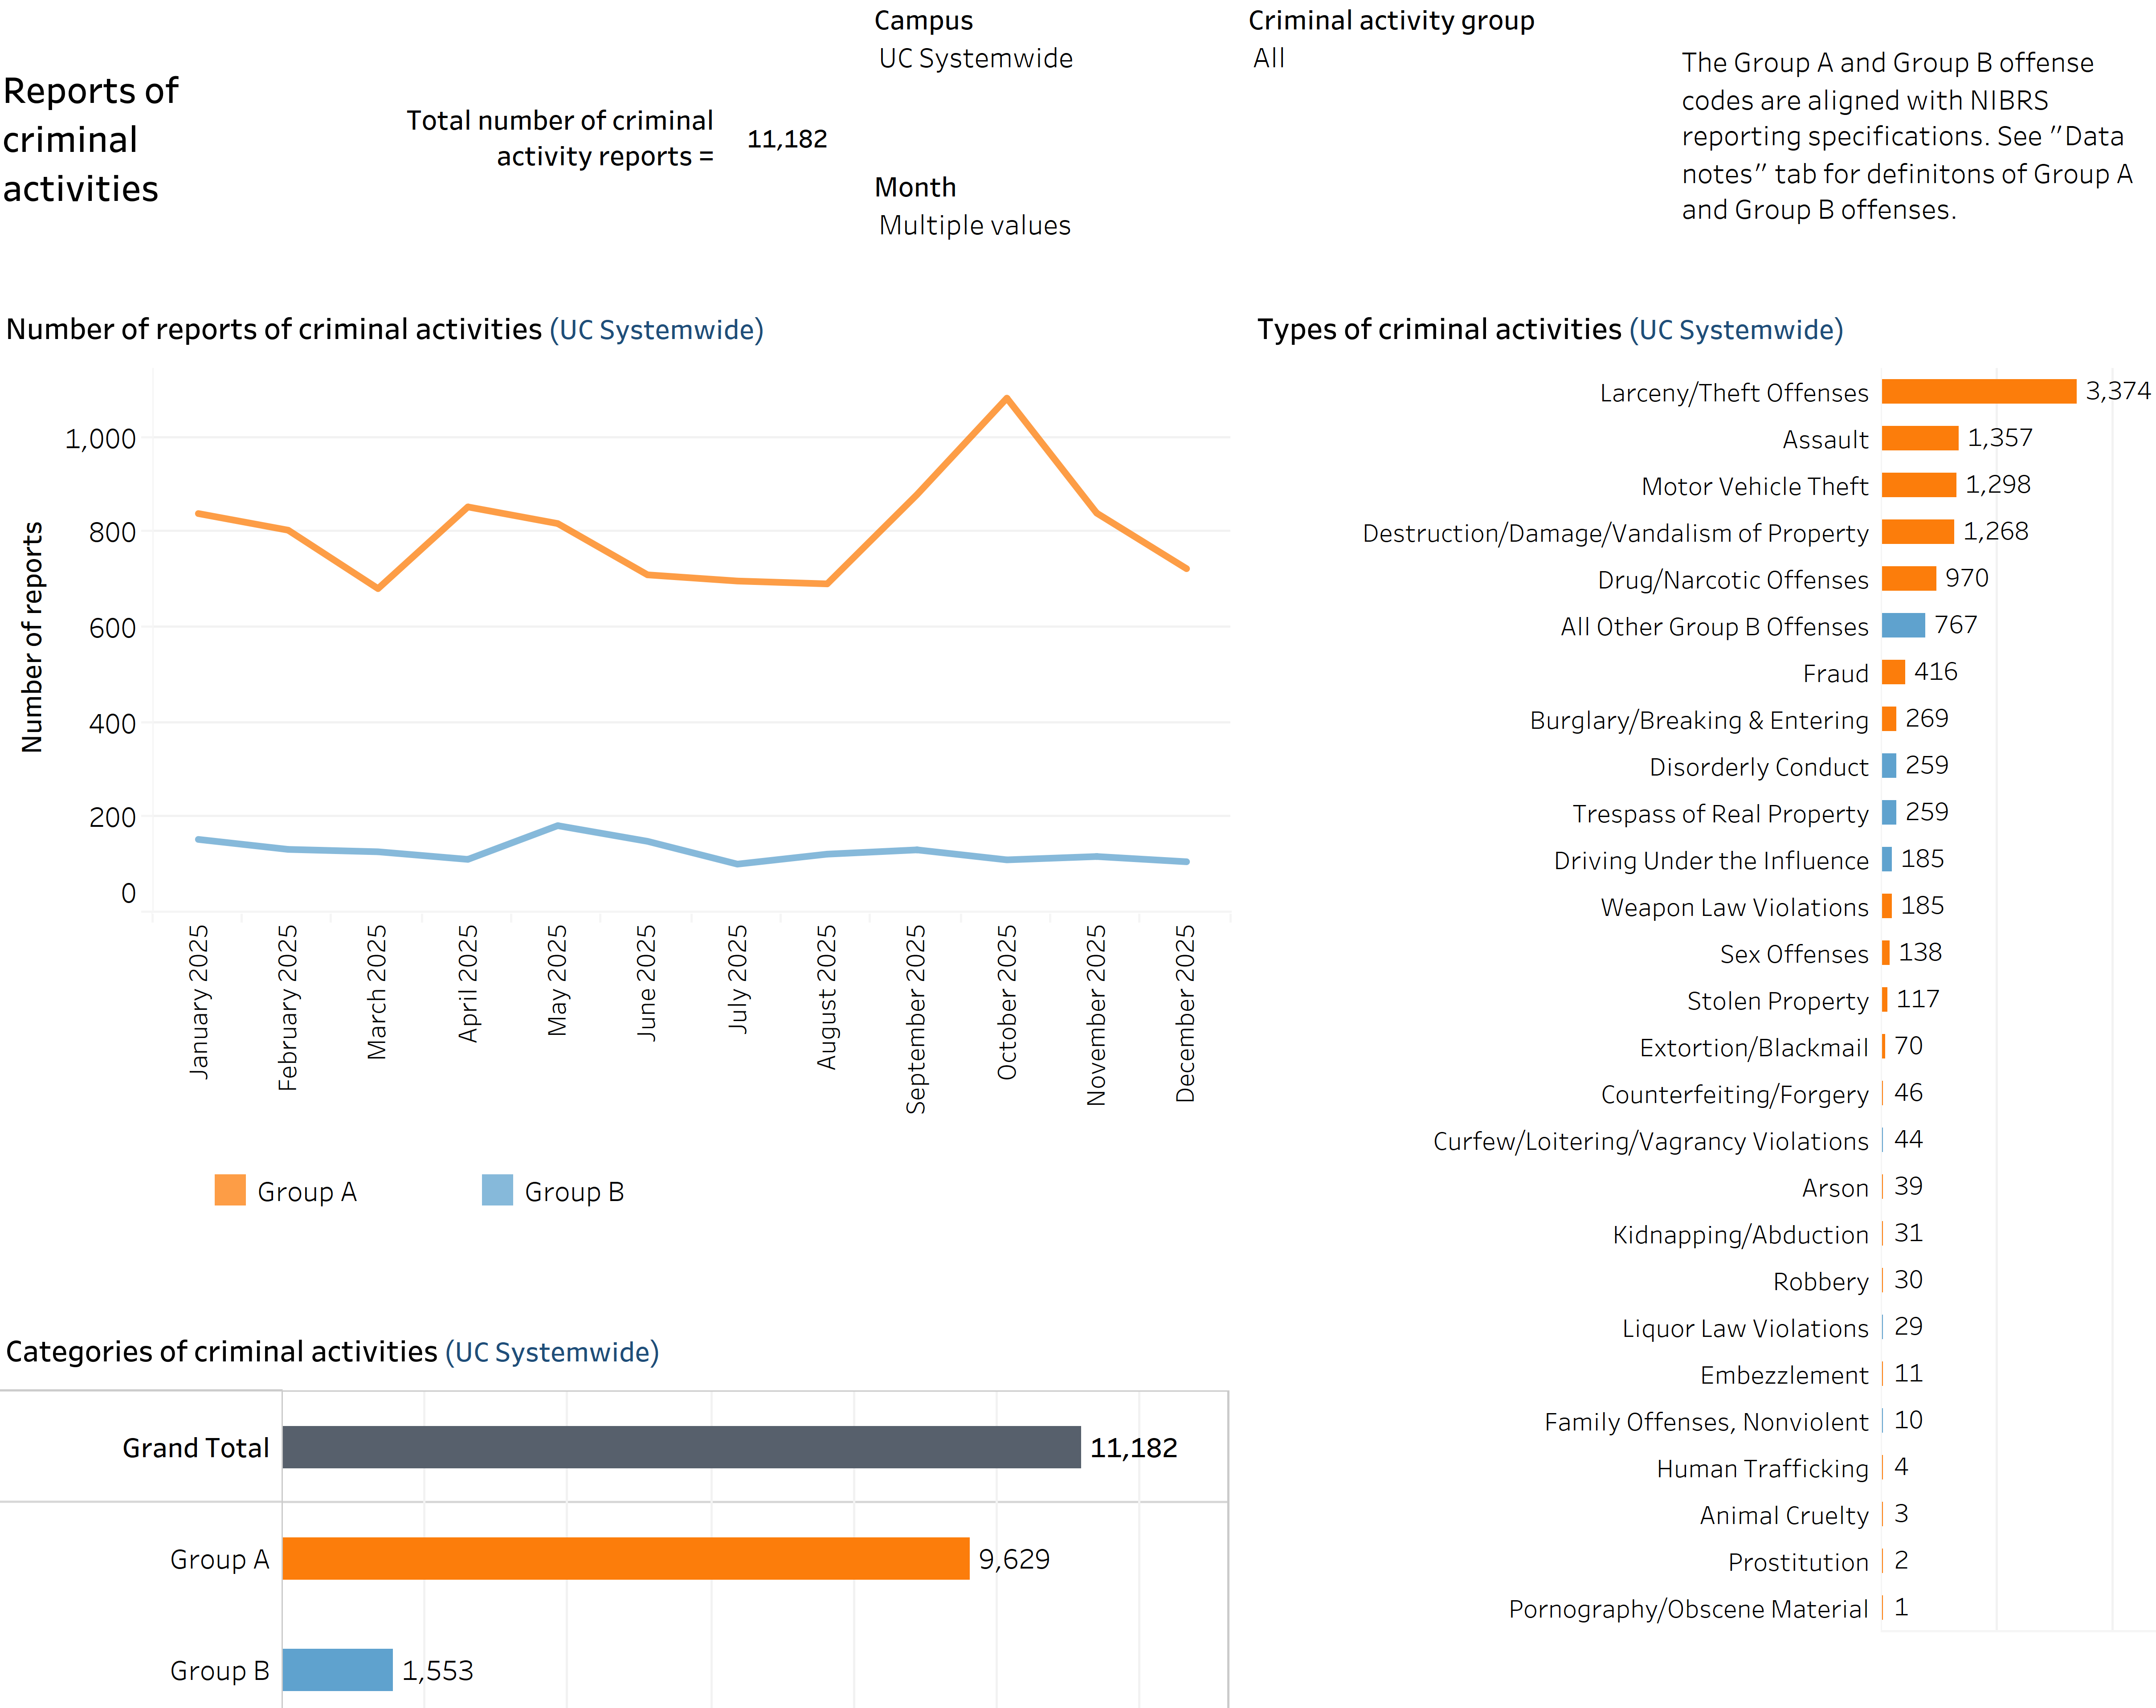
Crime on UC campuses dropped six percent in 2025, but larceny/theft remains the top problem.
13.4.4 Number of UCPD criminal activity reports/offenses by month, Universitywide, 2025
UCPD crimes data dashboard
source: Quarterly data submissions from UC police departments
UC police departments recorded 11,182 criminal incidents and made 3,005 arrests in 2025, down six percent from the prior year on both counts. While the decline is a positive indicator, nearly one in three reported crimes was a larceny or theft, affecting students, staff, and visitors.
Criminal reports spiked sharply in October 2025 (reaching over 1,000 incidents in a single month) before falling back. The dashboard linked above includes additional data on criminal activity reports by type of criminal activity and campus.
Group A: Under the National Incident-Based Reporting System (NIBRS), Group A offenses include, but are not limited to: human trafficking, homicide, assault, larceny/theft, bribery, burglary/B&E, destruction/damage/vandalism of property, drug/narcotic offenses, pornography/obscene material offenses, embezzlement, prostitution offenses, extortion/blackmail, fraud, robbery, gambling offenses, stolen property, etc.
Group B: Under NIBRS, Group B offenses include, but are not limited to: bad checks, curfew/loitering/vagrancy violations, disorderly conduct, driving under the influence, drunkenness, nonviolent family offenses, liquor law violations, peeping tom, trespassing, etc.
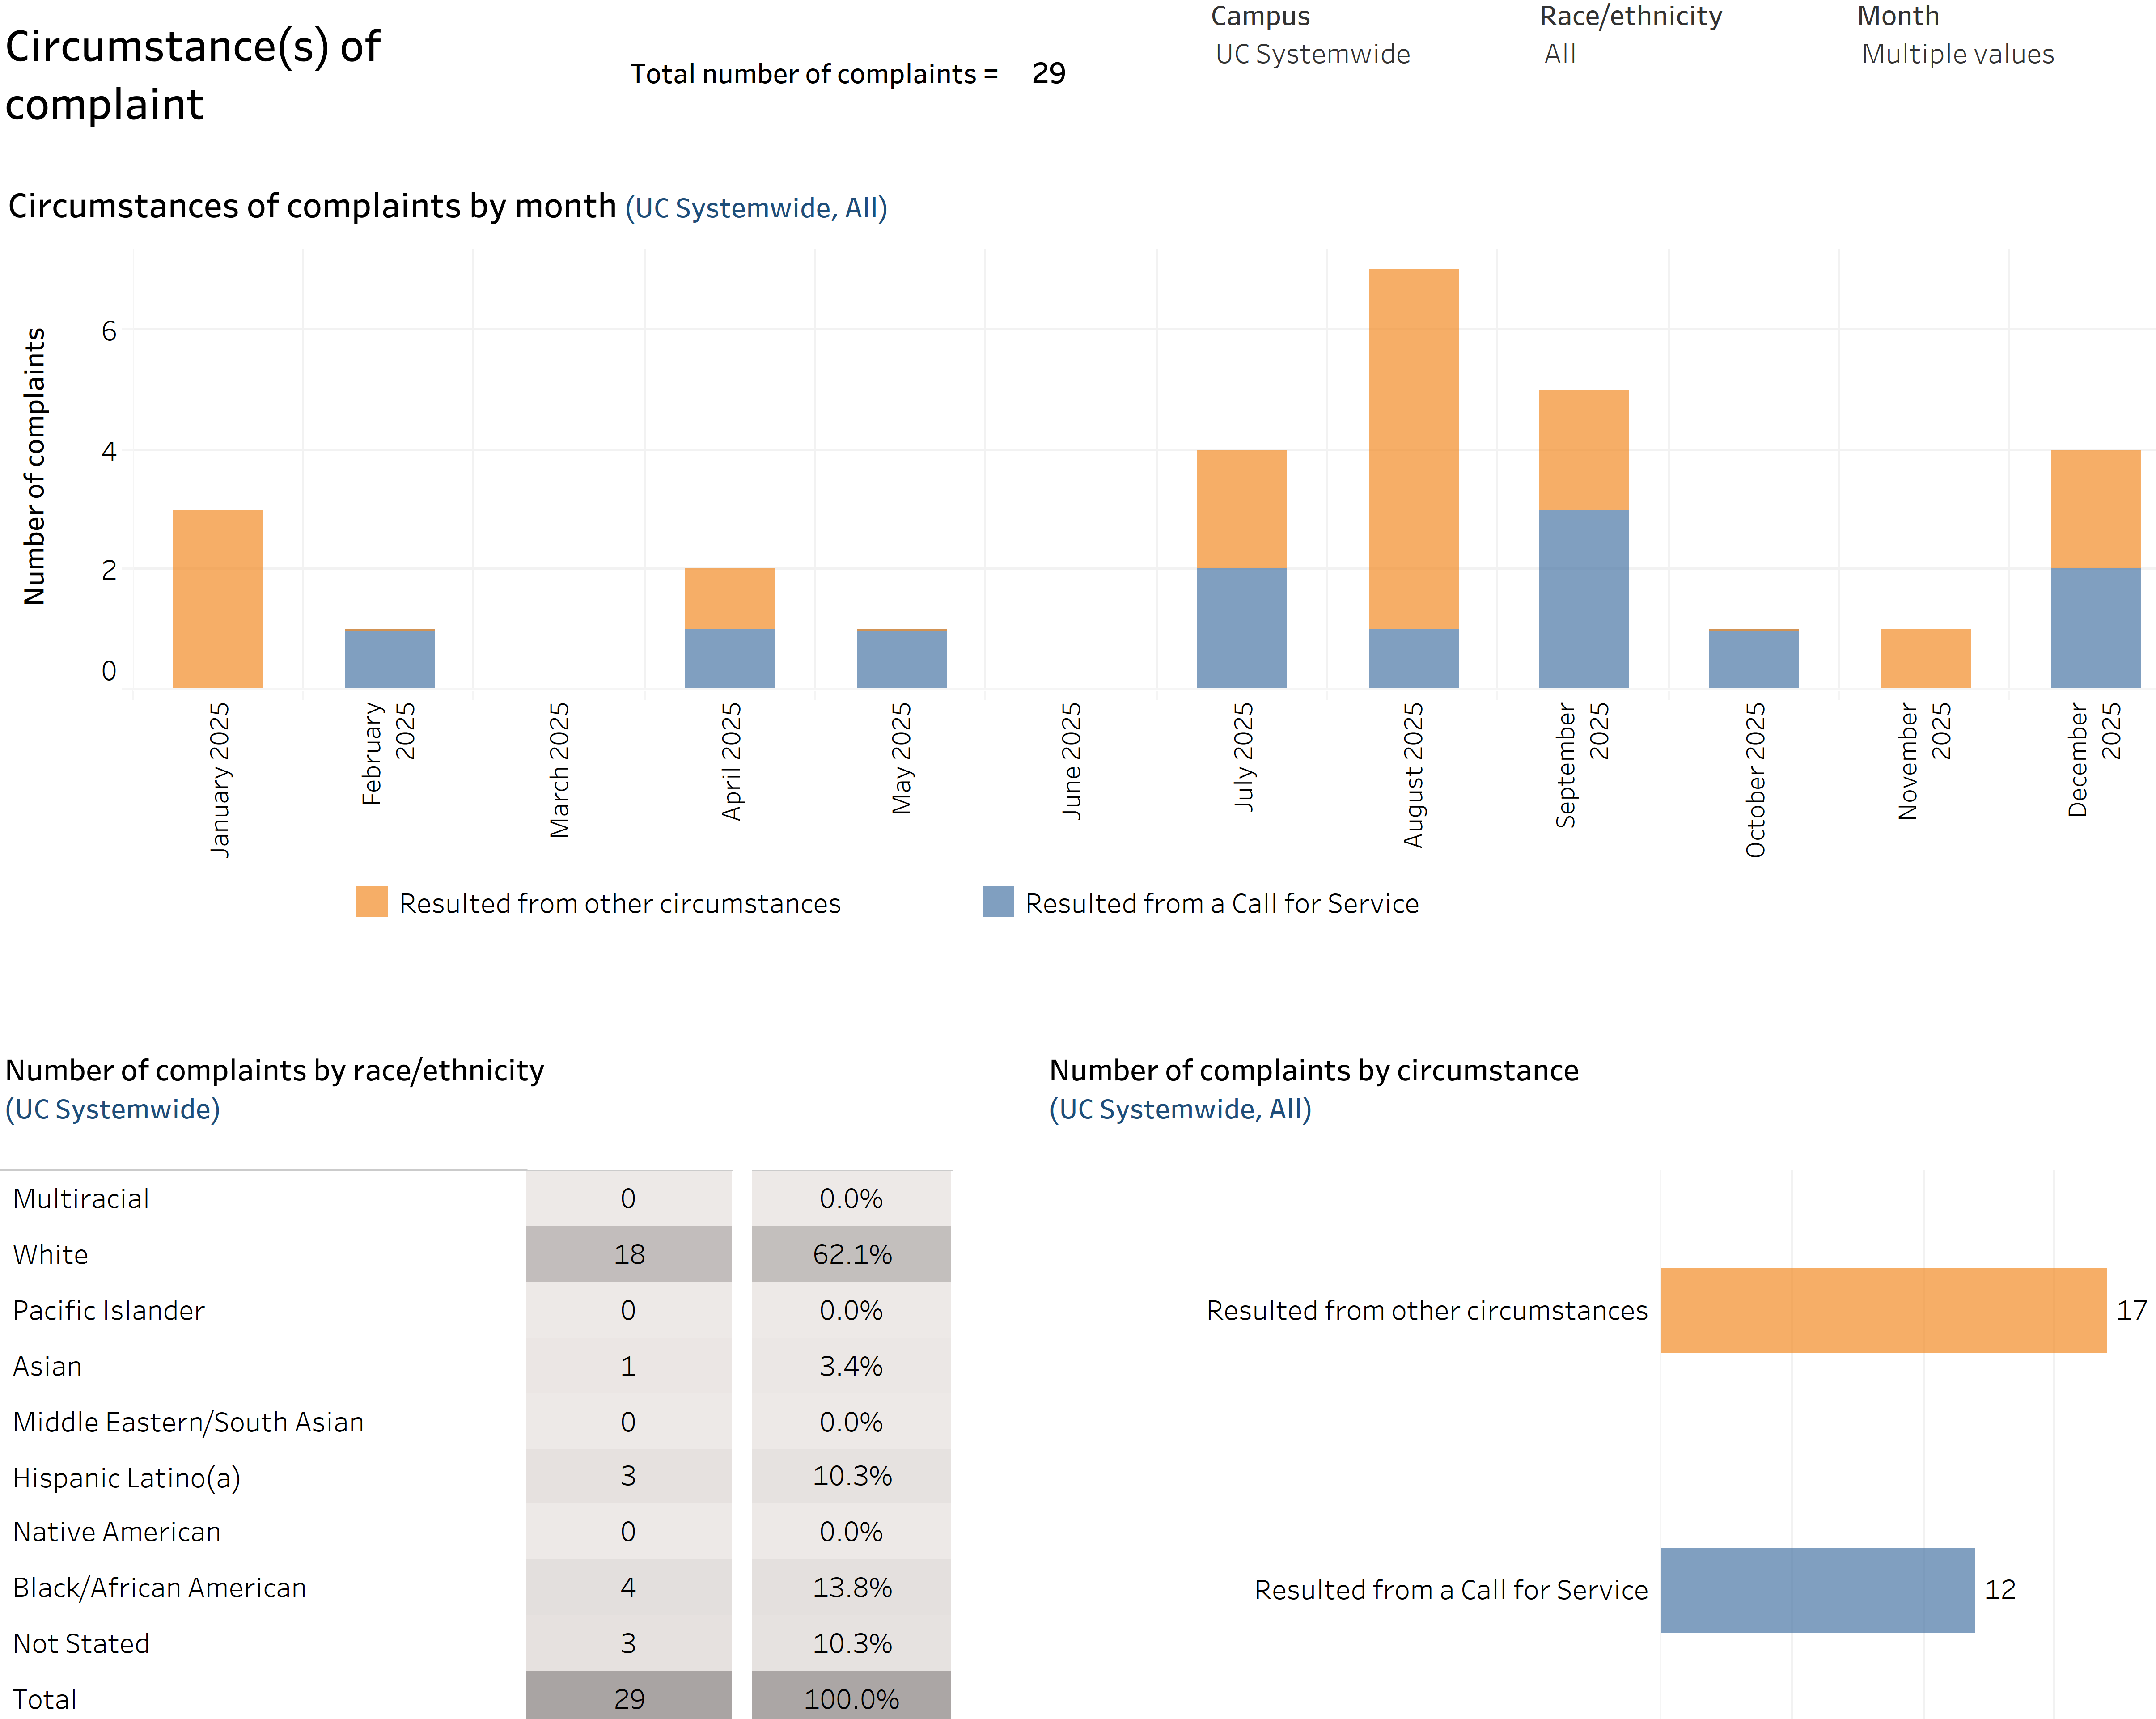
Twenty-nine civilian complaints were filed against UC police in 2025. Officers were exonerated in forty-two percent of these cases.
13.4.5 Number of UCPD civilian complaints by month, Universitywide, 2025
UCPD civilian complaints data dashboard
source: Quarterly data submissions from UC police departments
Civilians filed 29 complaints against UC police officers in 2025, down from 33 the prior year. The majority of civilian complaints stemmed from allegations of unprofessional conduct and other unethical behavior. Seventeen complaints came from officer-initiated encounters and twelve came from calls for service. August 2025 was the peak month with seven complaints (24 percent of total complaints in 2025). In 42 percent of these complaints, officers were exonerated.
UC’s own 2021 Community Safety Plan called for independent civilian oversight boards at every campus. Independent police accountability boards (PAB), comprised of a broad cross-section of the UC community, provide a robust complaint and investigation process to ensure that officers are acting consistently with rules, policies, and the law. Four years later, with just 29 complaints filed across ten campuses and over 21,000 police stops, that independent PAB infrastructure is still catching up. The dashboard linked above provides additional information on the circumstances and results of civilian complaints by campus.
For more information
Explore the UC Information Center dashboards that provide downloadable data and context on Institutional measures with this subject area-specific url:
universityofcalifornia.edu/about-us/information-center#institutional-measures
Other resources
Finances
Capital Projects
Sustainability
UC Community Safety Plan
Download data tables for chapter 13 indicators (Excel format)
Chapter Thirteen: Institutional Performance
Key takeaways:
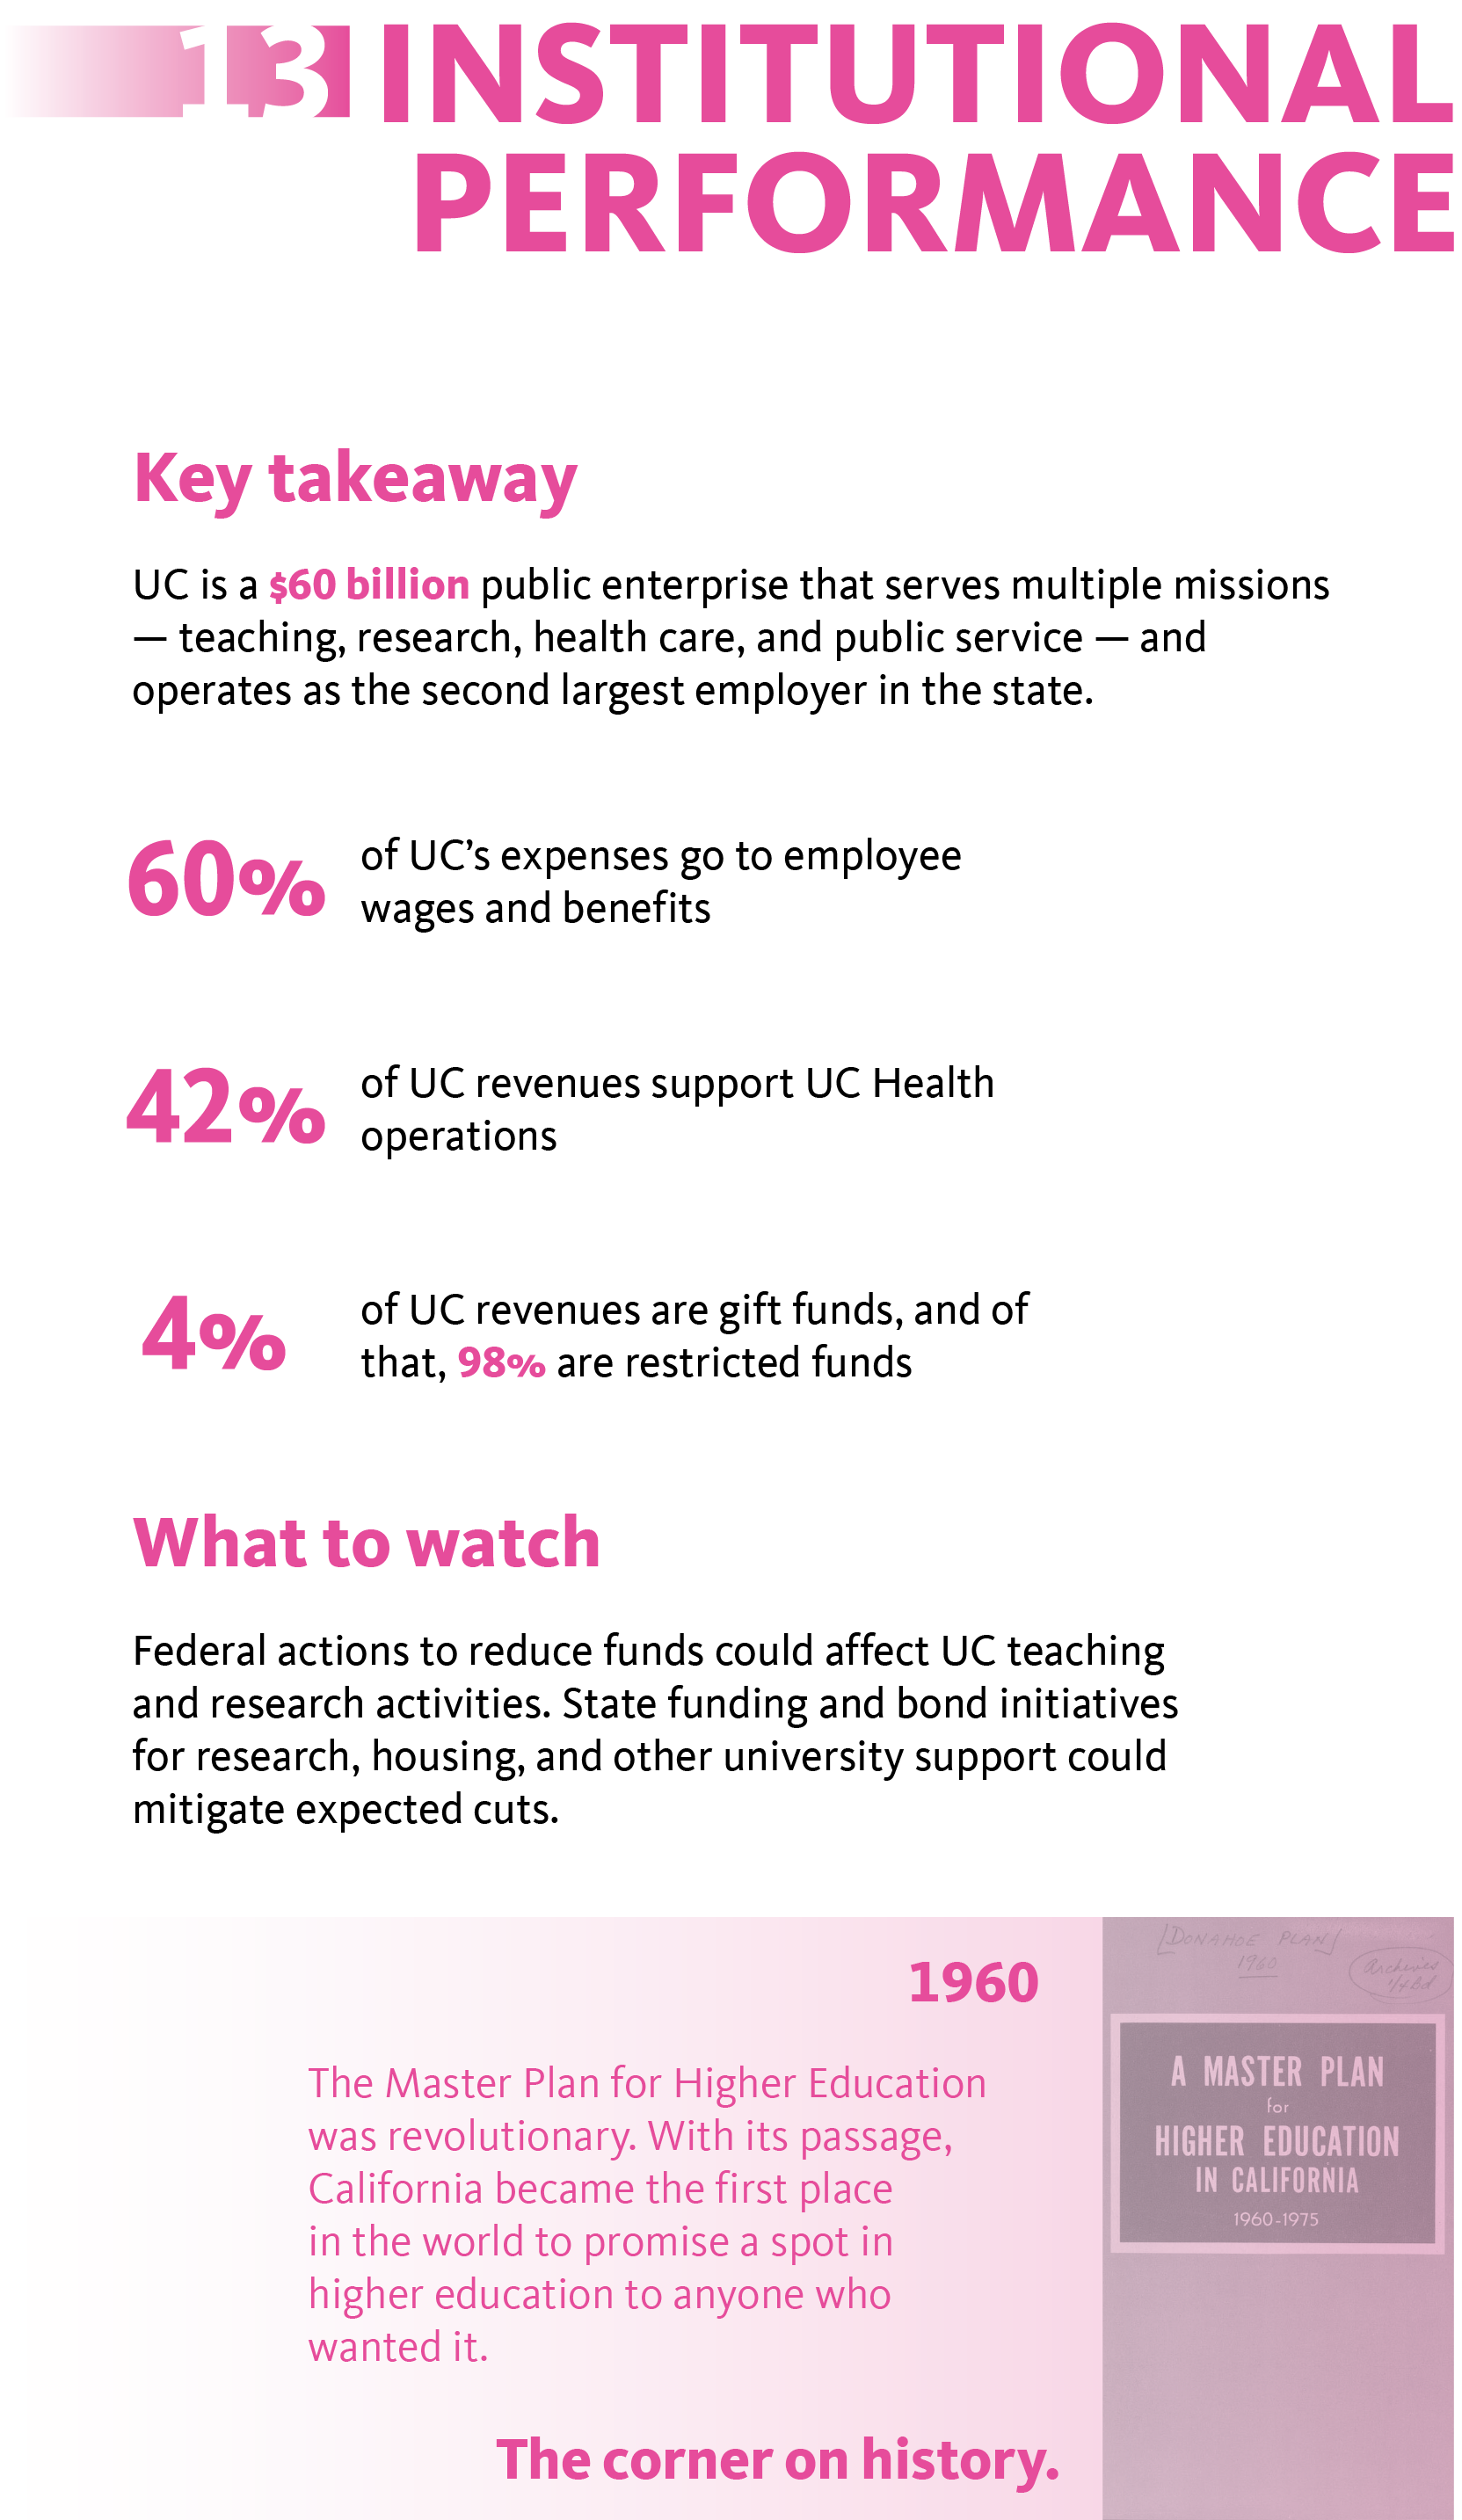
- UC is a $60 billion public enterprise that serves multiple missions — teaching, research, health care, and public service — and operates as the second largest employer in the state.
- Sixty percent of UC’s expenses go to employee wages and benefits.
- Forty-two percent of UC revenues support UC Health operations.
- Four percent of UC revenues are gift funds, and of that, ninety-eight percent are restricted funds.
What to watch:
Federal actions to reduce funds could affect UC teaching and research activities. State funding and bond initiatives for research, housing, and other university support could mitigate expected cuts.
UC’s corner on history:
In 1960, The Master Plan for Higher Education was revolutionary. With its passage, California became the first place in the world to promise a spot in higher education to anyone who wanted it.