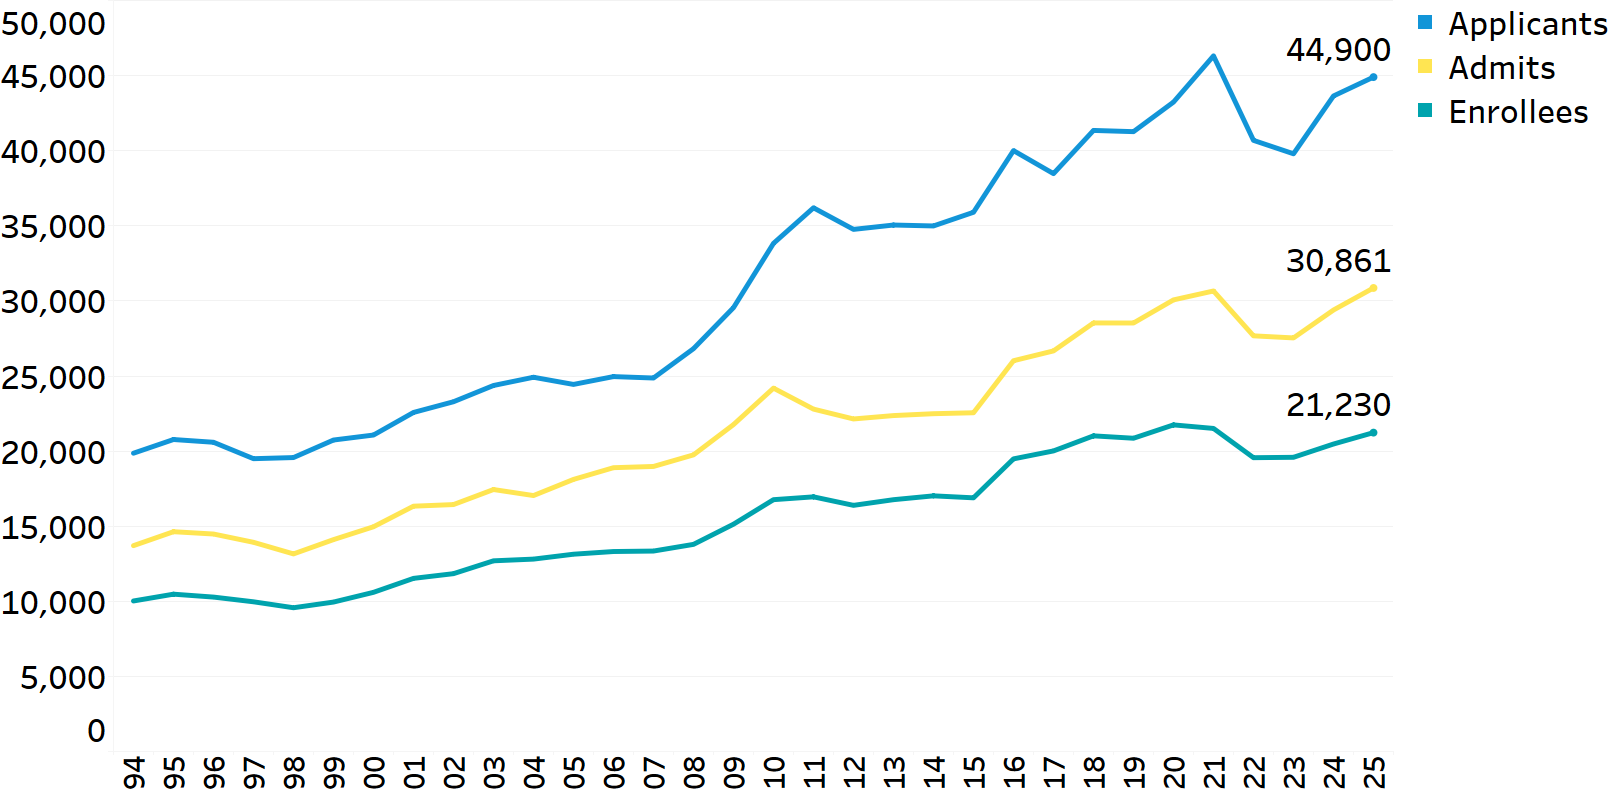
Demand for UC admission from freshman applicants remains high.
2.1.1 Freshman applicants, admits, and enrollees, Universitywide and UC campuses, fall 1994 to 2025
Universitywide, unduplicated, 1994 to 2025
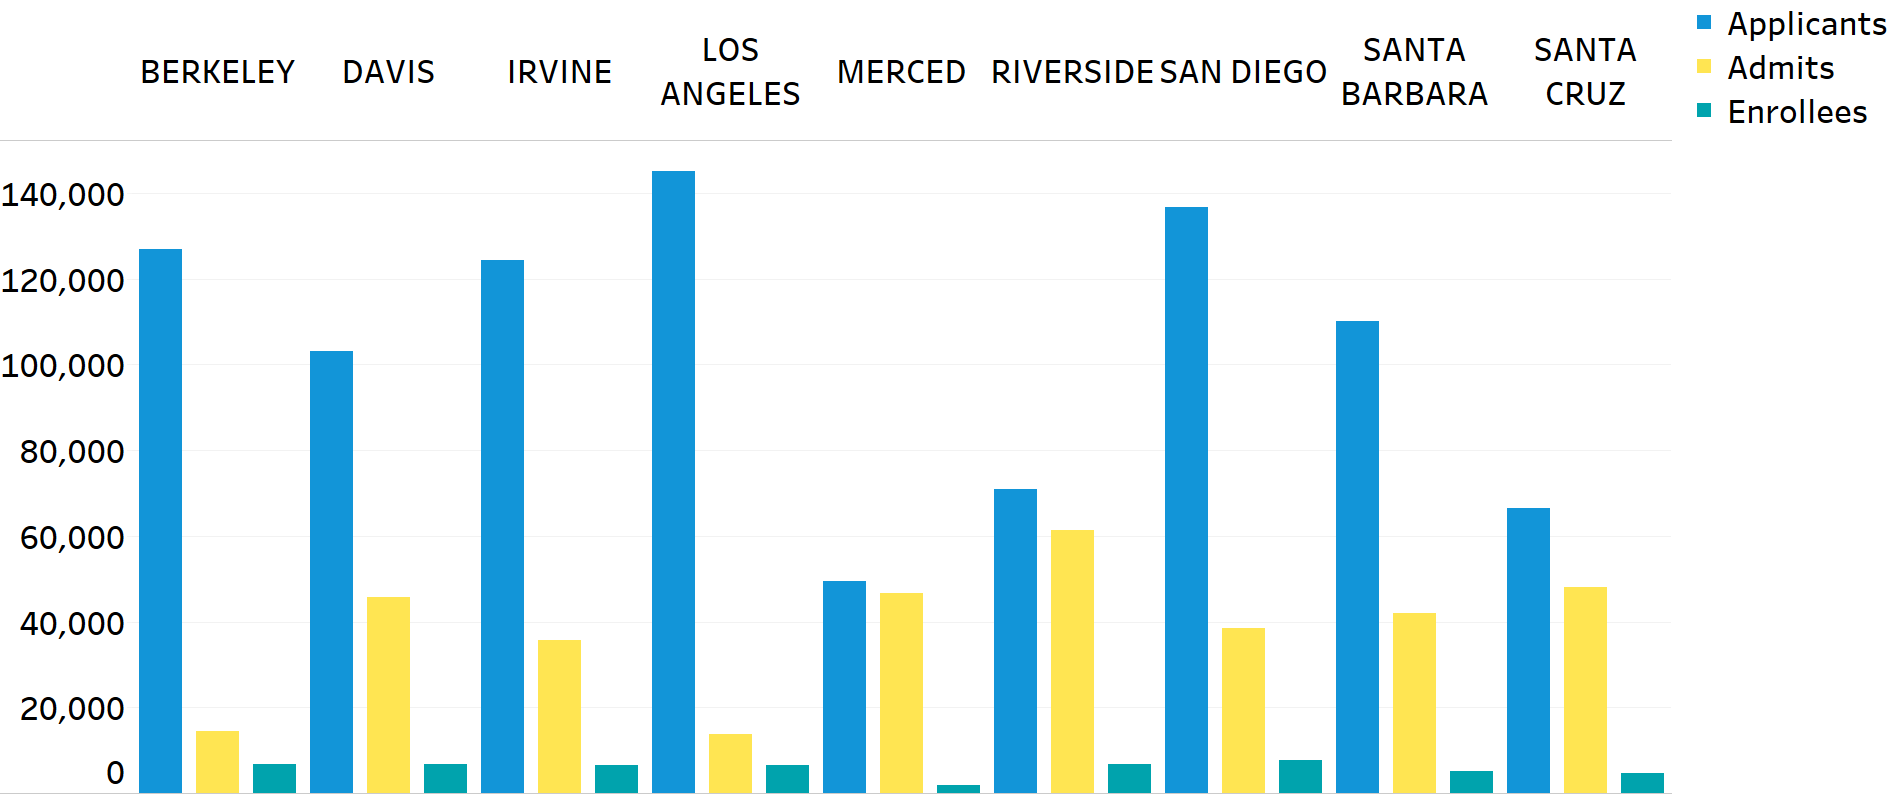
By campus, fall 2025
source: UC Data Warehouse
UC continues to meet its goal in the California Master Plan for Higher Education of guaranteeing admission to California resident applicants who are in the top 12.5 percent of California public high school graduates.
After increasing slightly in 2024, unduplicated freshman applicants decreased one percent from 2024 to 2025, to about 205,000. Freshman applications increased at six campuses and decreased at three campuses, with UC applicants applying to an average of 4.5 campuses.
In fall 2025, the admit rate was less than 50 percent for most campuses. Systemwide, over seven-tenths (72 percent) of all applicants, including over three-quarters (77 percent) of CA resident applicants were admitted.
The Undergraduate admissions summary dashboard at the UC Information Center presents data tables on UC freshman applicants, admits, and enrollees by campus over time.
note: Admits and enrollees here include applicants guaranteed admission who are not offered admission at a campus to which they applied but who are referred to and admitted by another campus. Some campuses admit fall applicants for a subsequent term (winter or spring). These “rollover” admits and enrollees are excluded in this indicator. Students who apply to multiple UC campuses are counted only once in the universitywide indicator. A change in accounting for referral students is responsible for the apparent drop in 2011 admits. Beginning that year, UC Merced admitted only students who indicated interest in a referral offer, rather than every student who qualified for an offer.
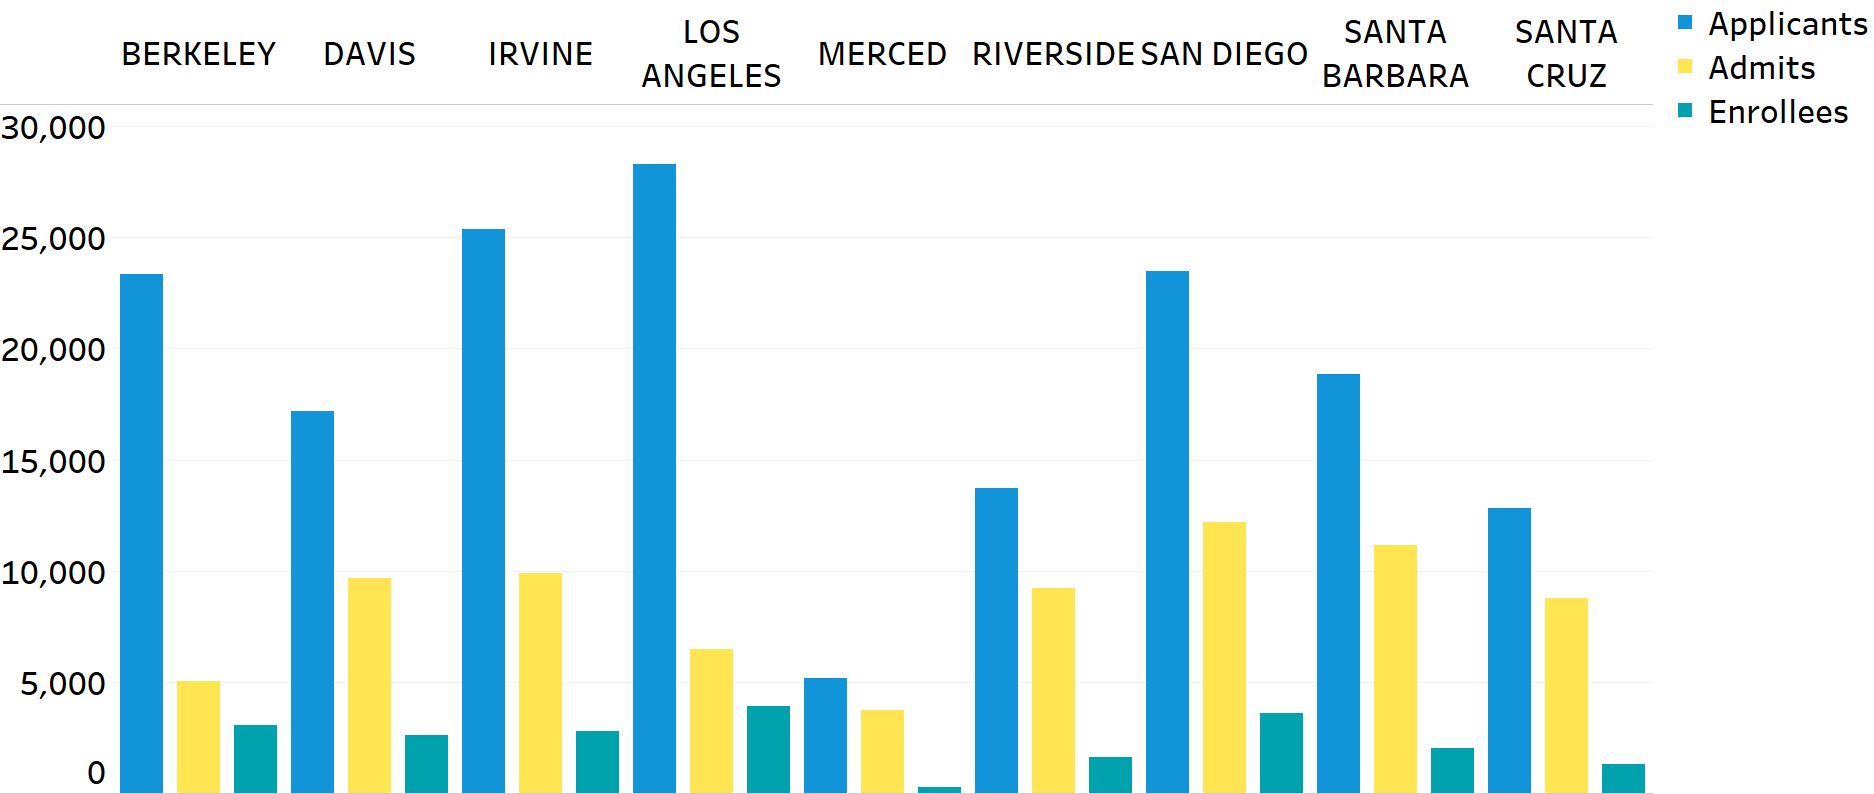
Transfer applicants, admits, and enrollees continued to grow in 2025.
2.1.2 Transfer applicants, admits, and enrollees, Universitywide and UC campuses, Fall 1994 to 2025
Universitywide, unduplicated, 1994 to 2025
By campus, fall 2025
source: UC Data Warehouse
Transfer applications increased by three percent, admits by five percent, and enrollees by four percent in fall 2025 compared to 2024, continuing to rebound from drops seen post-pandemic. Systemwide, over two-thirds (69 percent) of applicants were admitted, including over seven-tenths (71 percent) of CA resident applicants. Almost all transfer enrollees (91 percent) came from California community colleges (CCCs). On average, UC transfer applicants applied to 3.7 UC campuses.
The Undergraduate admissions summary dashboard at the UC Information Center presents data tables on UC transfer applicants, admits, and enrollees by campus over time.
note: Admits and enrollees here include the referral pool. Some campuses admit fall applicants for a subsequent term (winter or spring). These “rollover” admits and enrollees are excluded in the graphs here, which only show fall data.
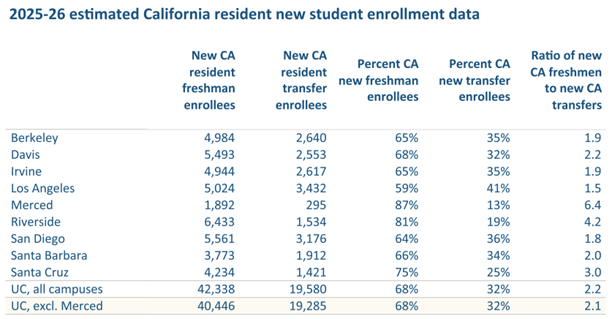
UC did not meet the 2:1 goal of resident freshman to transfer enrollees in 2025–26.
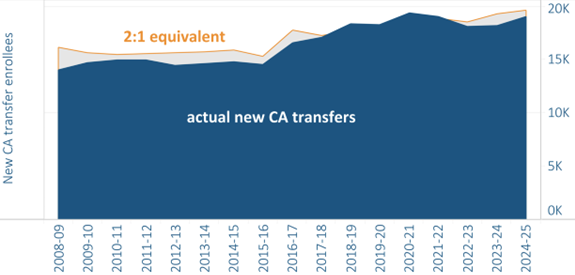
2.1.3 New California resident transfer enrollment, Universitywide excluding UC Merced, 2008–09 to 2024–25

California resident freshman-to-transfer ratio dashboard
source: UC Data Warehouse
New California resident transfer enrollment, Universitywide excluding UC Merced, 2008–09 to 2024–25
source: UC campuses
The California Master Plan calls for UC to accommodate all eligible resident California Community College (CCC) transfer students. It specifies that the University maintain at least a 60:40 ratio of upper-division (junior and senior) to lower-division (freshman and sophomore) students to ensure adequate upper-division spaces for CCC transfers. To do so, for every two new California resident freshmen, UC aims to enroll one new California resident transfer student, or 67 percent new resident freshmen to 33 percent new resident transfer students.
As UC’s youngest campus, UC Merced is still building programs, upper-division capacity, and community college partnerships to support transfer enrollment and, therefore, is excluded from the 2:1 ratio goal.
The above graph shows actual new California resident transfer enrollees compared to the number needed to meet the 2:1 freshman-to-transfer ratio each year, demonstrating that, over the past several years, UC has achieved or nearly achieved the 2:1 goal. UC moved from 2.2:1 in 2016–17 to 1.9:1 in 2020–21 during the pandemic and back to 2.2:1 in 2023–24. In 2024–25, the ratio decreased slightly to 2.1 and remained at the same level in 2025–26. The UC system and some UC campuses did not meet 2:1 in 2025–26 due in part to larger California resident freshman cohorts at UC Davis, UC Riverside, and UC Santa Cruz. The California resident freshman-to-transfer ratio dashboard on the UC Information Center tracks UC’s progress.
The California Community College transfer admit rate for California residents was 76 percent for fall 2025, similar to the rates for the past three years and higher than the rates in 2019 to 2021.
notes:
- Academic year headcount enrollment figures for 2025–26 are not yet available; estimated 2025-26 data is provided by campuses; prior-year data is from the UC Data Warehouse.
- Ninety-three percent of California resident transfer students in 2024–25 came from CCCs.
- Merced is excluded from the 2:1 ratio goal that was part of the 2015 Budget Framework agreement with the state of California.
- This goal is described in more detail on pages 13–15 of the November 2025 Multi-Year Compact Annual Report: ucop.edu/operating-budget/_files/legreports/2526/uc_multi-year_compact_annual_legrpt.pdf.
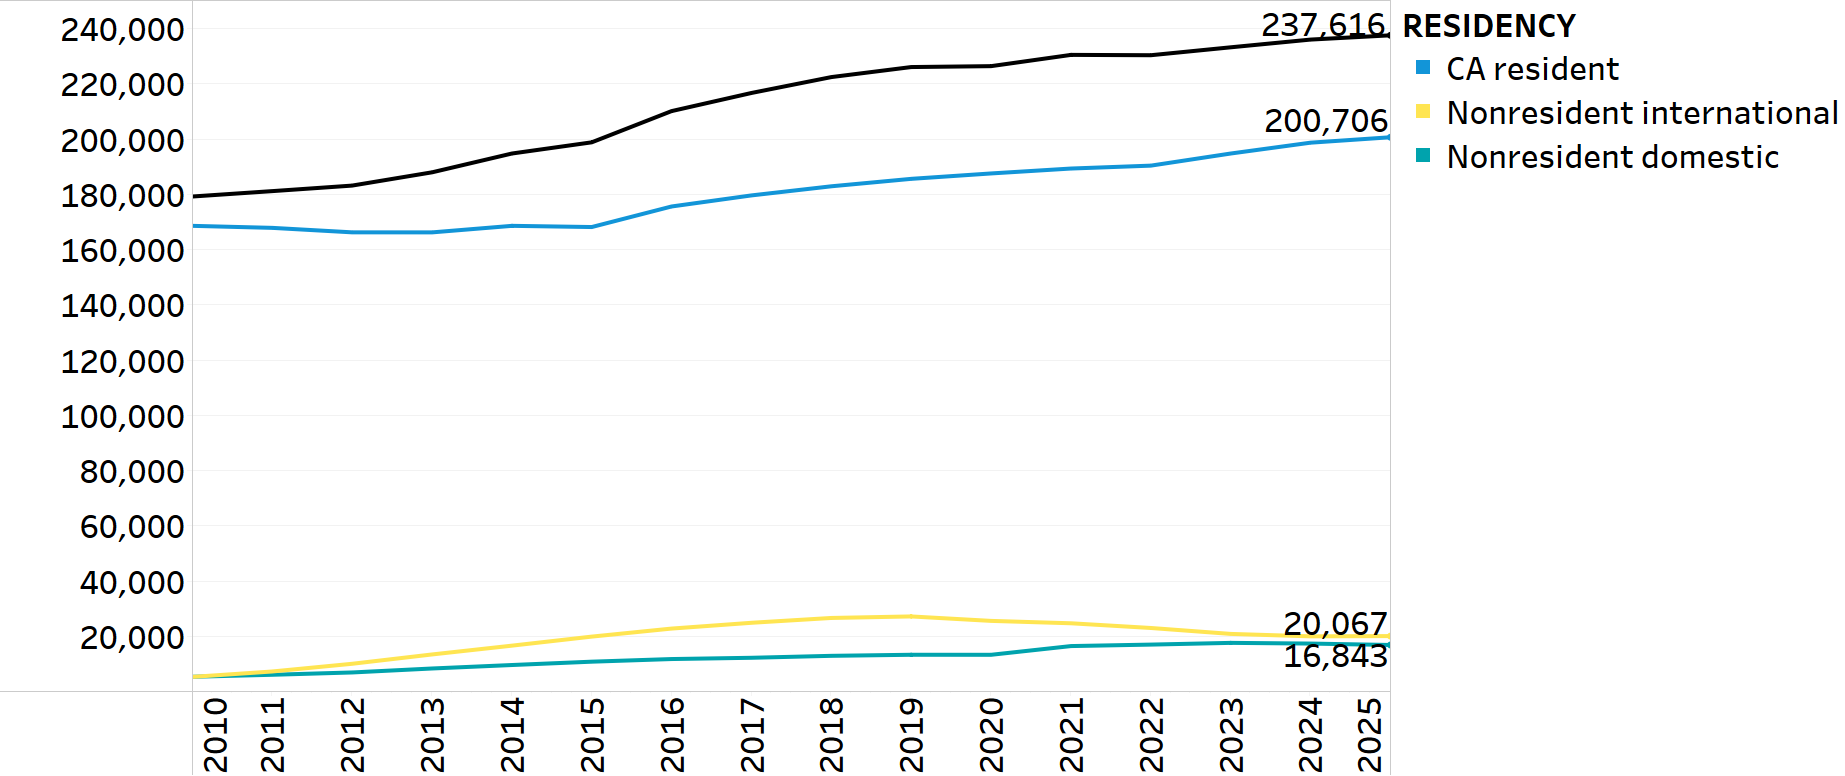
UC enrollment of California residents continued to grow in 2025 — surpassing 200,000.
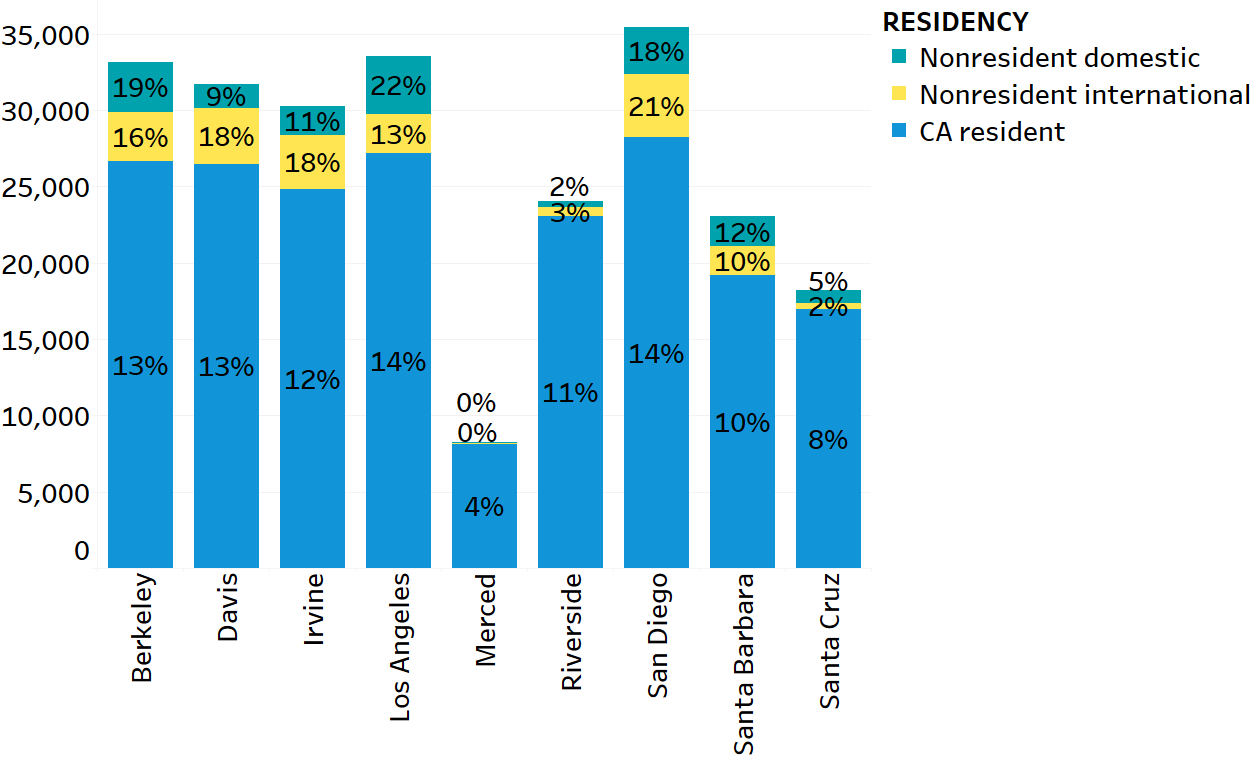
2.1.4 Undergraduate headcount enrollment, Universitywide and UC campuses, fall 2009 to 2025
Universitywide, unduplicated, 1994 to 2025
By campus, fall 2025
source: UC Data Warehouse
The University and the State share the goal of expanding access to a UC education. The University enrolled over 1,900 additional California residents in fall 2025 compared to fall 2024, with a total increase of over 32,500 California resident undergraduates since fall 2015.
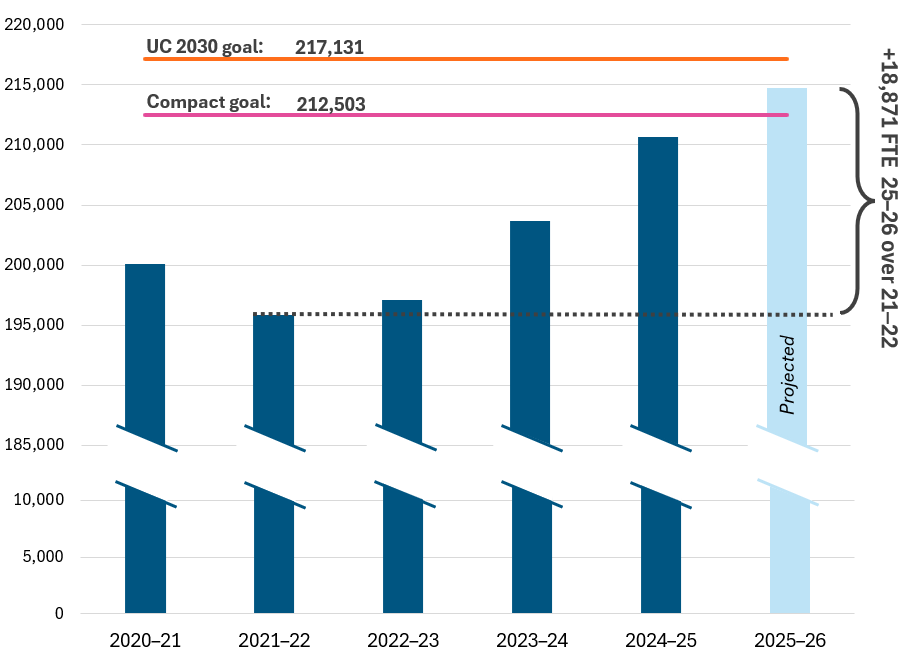
UC surpassed its California resident undergraduate enrollment goals under the Compact in 2025–26, a year early, and may well achieve the UC 2030 capacity plan goal in 2026–27.
2.1.5a Undergraduate California resident full-time equivalent (FTE) enrollment, progress toward Compact and 2030 goals, Universitywide, 2020–21 to 2025–26
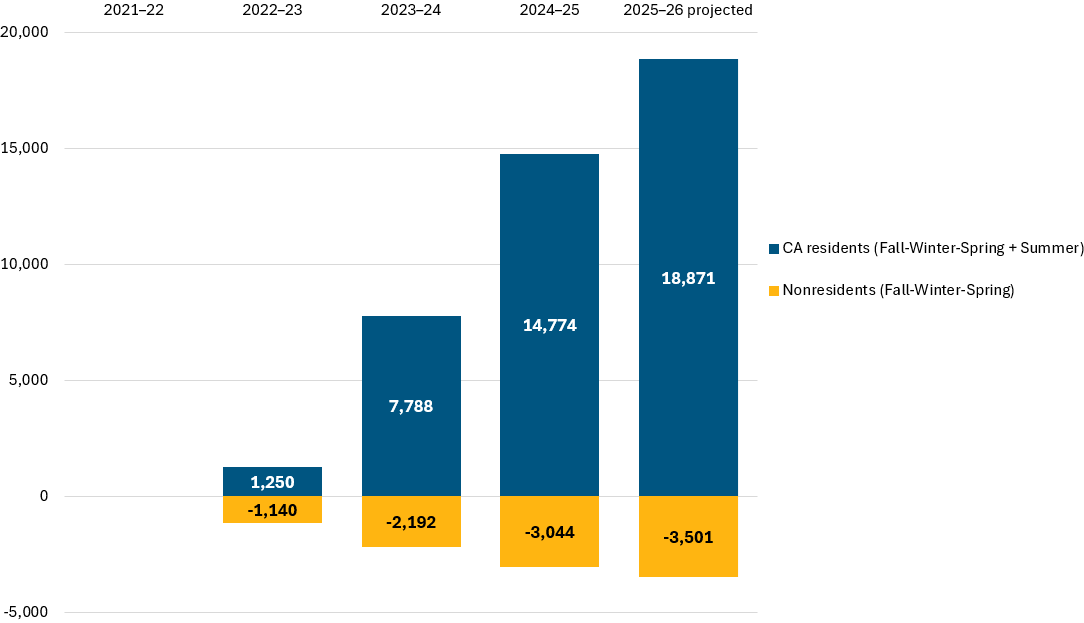
2.1.5b Cumulative change in undergraduate California resident and nonresident FTE enrollment during the Compact, Universitywide, 2021–22 to 2025–26
source: UC Campuses
In the University of California 2030 capacity plan (www.ucop.edu/institutional-research-academic-planning/_files/uc-2030-capacity-plan.pdf), UC proposed increasing undergraduate enrollment of California residents from about 200,000 full-time equivalent (FTE) students in 2020–21 to 217,000 in 2029–30, while also reducing the proportion of undergraduate enrollment comprised of non-California residents. In addition, the multi-year Compact with the Governor established annual growth goals that achieve 212,503 California resident FTE by 2026–27.
In 2025–26, UC is estimated to enroll nearly 215,000 California resident undergraduate FTE, an increase of more than 4,000 FTE compared to 2024–25. This will exceed the 2026–27 Compact goal by more than 2,000 FTE, a year ahead of schedule. The University is also within 2,400 FTE of the 2030 capacity plan goal and may well achieve it in 2026–27, three years ahead of schedule.
From 2021–22 through 2025–26, which spans the Compact period, UC increased California resident enrollment by nearly 19,000 FTE, equivalent to adding a new UC campus without the costs associated with building one. Over the same period, the University reduced nonresident enrollment by 3,500 FTE (see indicator 2.4.2 for more information about nonresident enrollment).
note: Summer enrollees are counted as California residents.
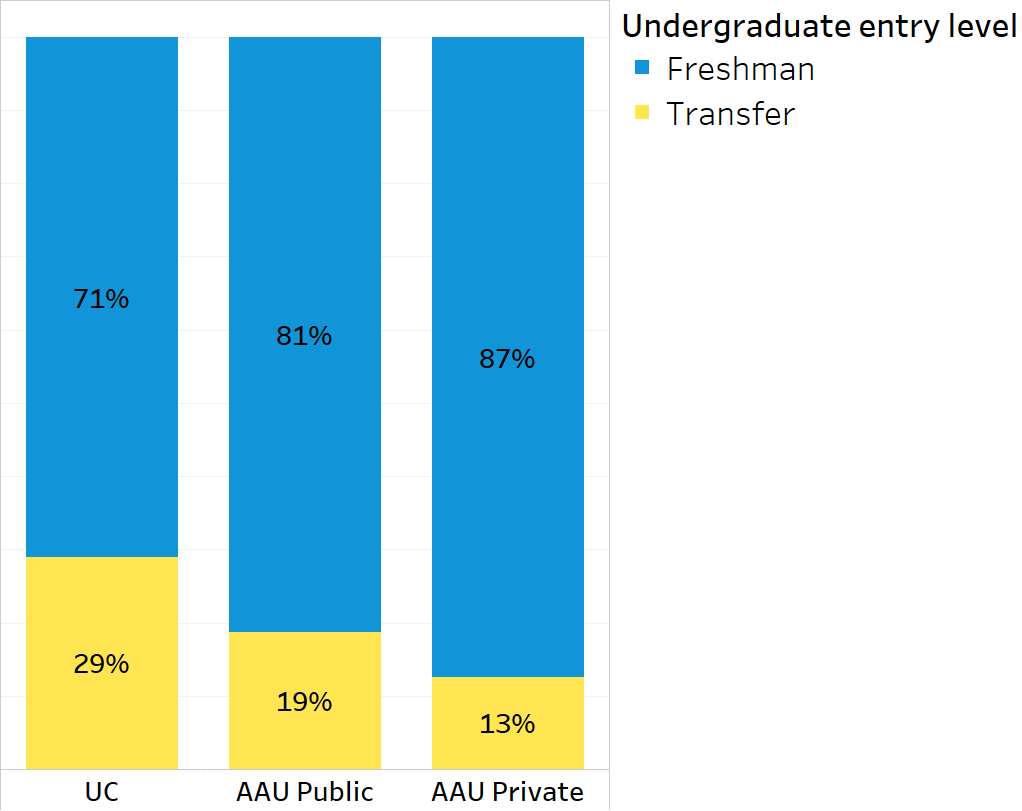
Transfers make up a larger share of UC’s incoming class than at other selective universities.
2.1.6 Transfers as a share of entering students (UC vs. selective public and private universities)
Share of new enrollees, fall 2024
source: IPEDS
Underscoring UC’s commitment to transfer students, UC has a higher share of entering students who are transfers than non-UC AAU public institutions and AAU private institutions.
note: Fall 2024 is the latest available year of comparable data for UC campuses, and AAU campuses. Data includes students from all residency categories.
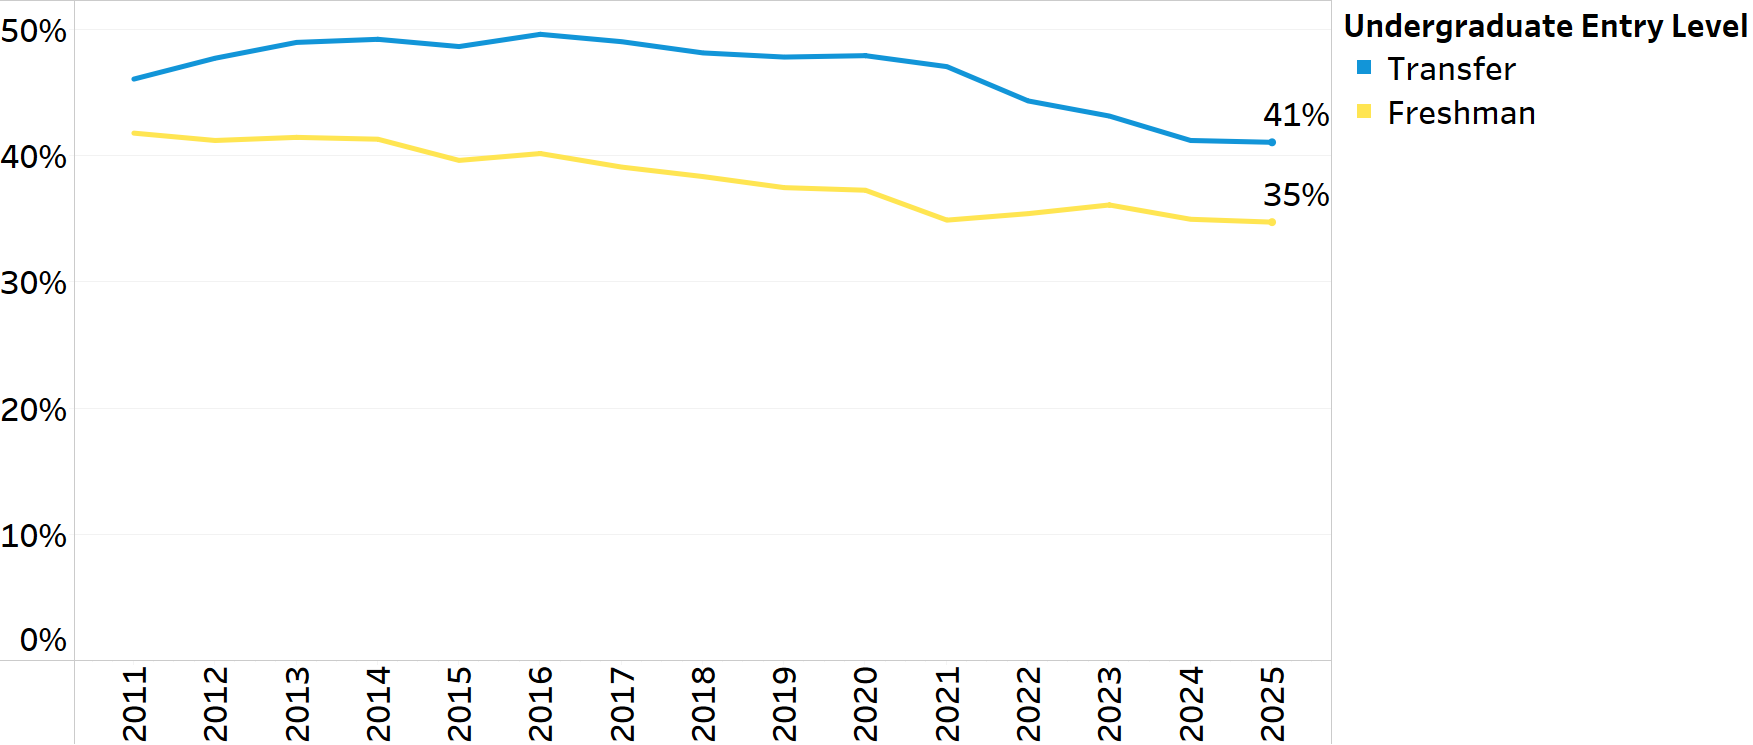
A little over one-third of entering freshmen and over two-fifths of entering transfer students are first-generation college students.
2.2.1 Entering students by first-generation status, Universitywide, fall 2011 to 2025
Share of entering students who are first generation, by entry level
source: UC Data Warehouse
Just over one-third (35 percent) of entering freshman students were first generation in fall 2025 compared to just over two-fifths (41percent) of entering transfers. The first-generation share of freshmen was the same as fall 2024 and the share of transfer students declined slightly from 43 percent in fall 2024.
The First-generation college students dashboard at the UC Information Center has more information about all enrolled first-generation undergraduates (entering and continuing students). Most first-generation UC students are low-income, female, and from underrepresented groups. Moreover, first-generation students earn more than their families within four years of graduation.
note: First-generation students are those whose parent(s) did not complete a four-year college degree. Total incoming undergraduate first-generation students (freshman, transfer, other) is 26,984 (37 percent); not-first-generation students total 44,304 (60 percent); and missing/unknown are 2,551 (3 percent).
Almost one-third of dependent freshman applicants, admits, and enrollees had parental income under $60,000 in fall 2025.
2.2.2 Undergraduate freshman applicants, admits, and enrollees by self-reported parents’ income
Universitywide, Fall 2015 to 2025
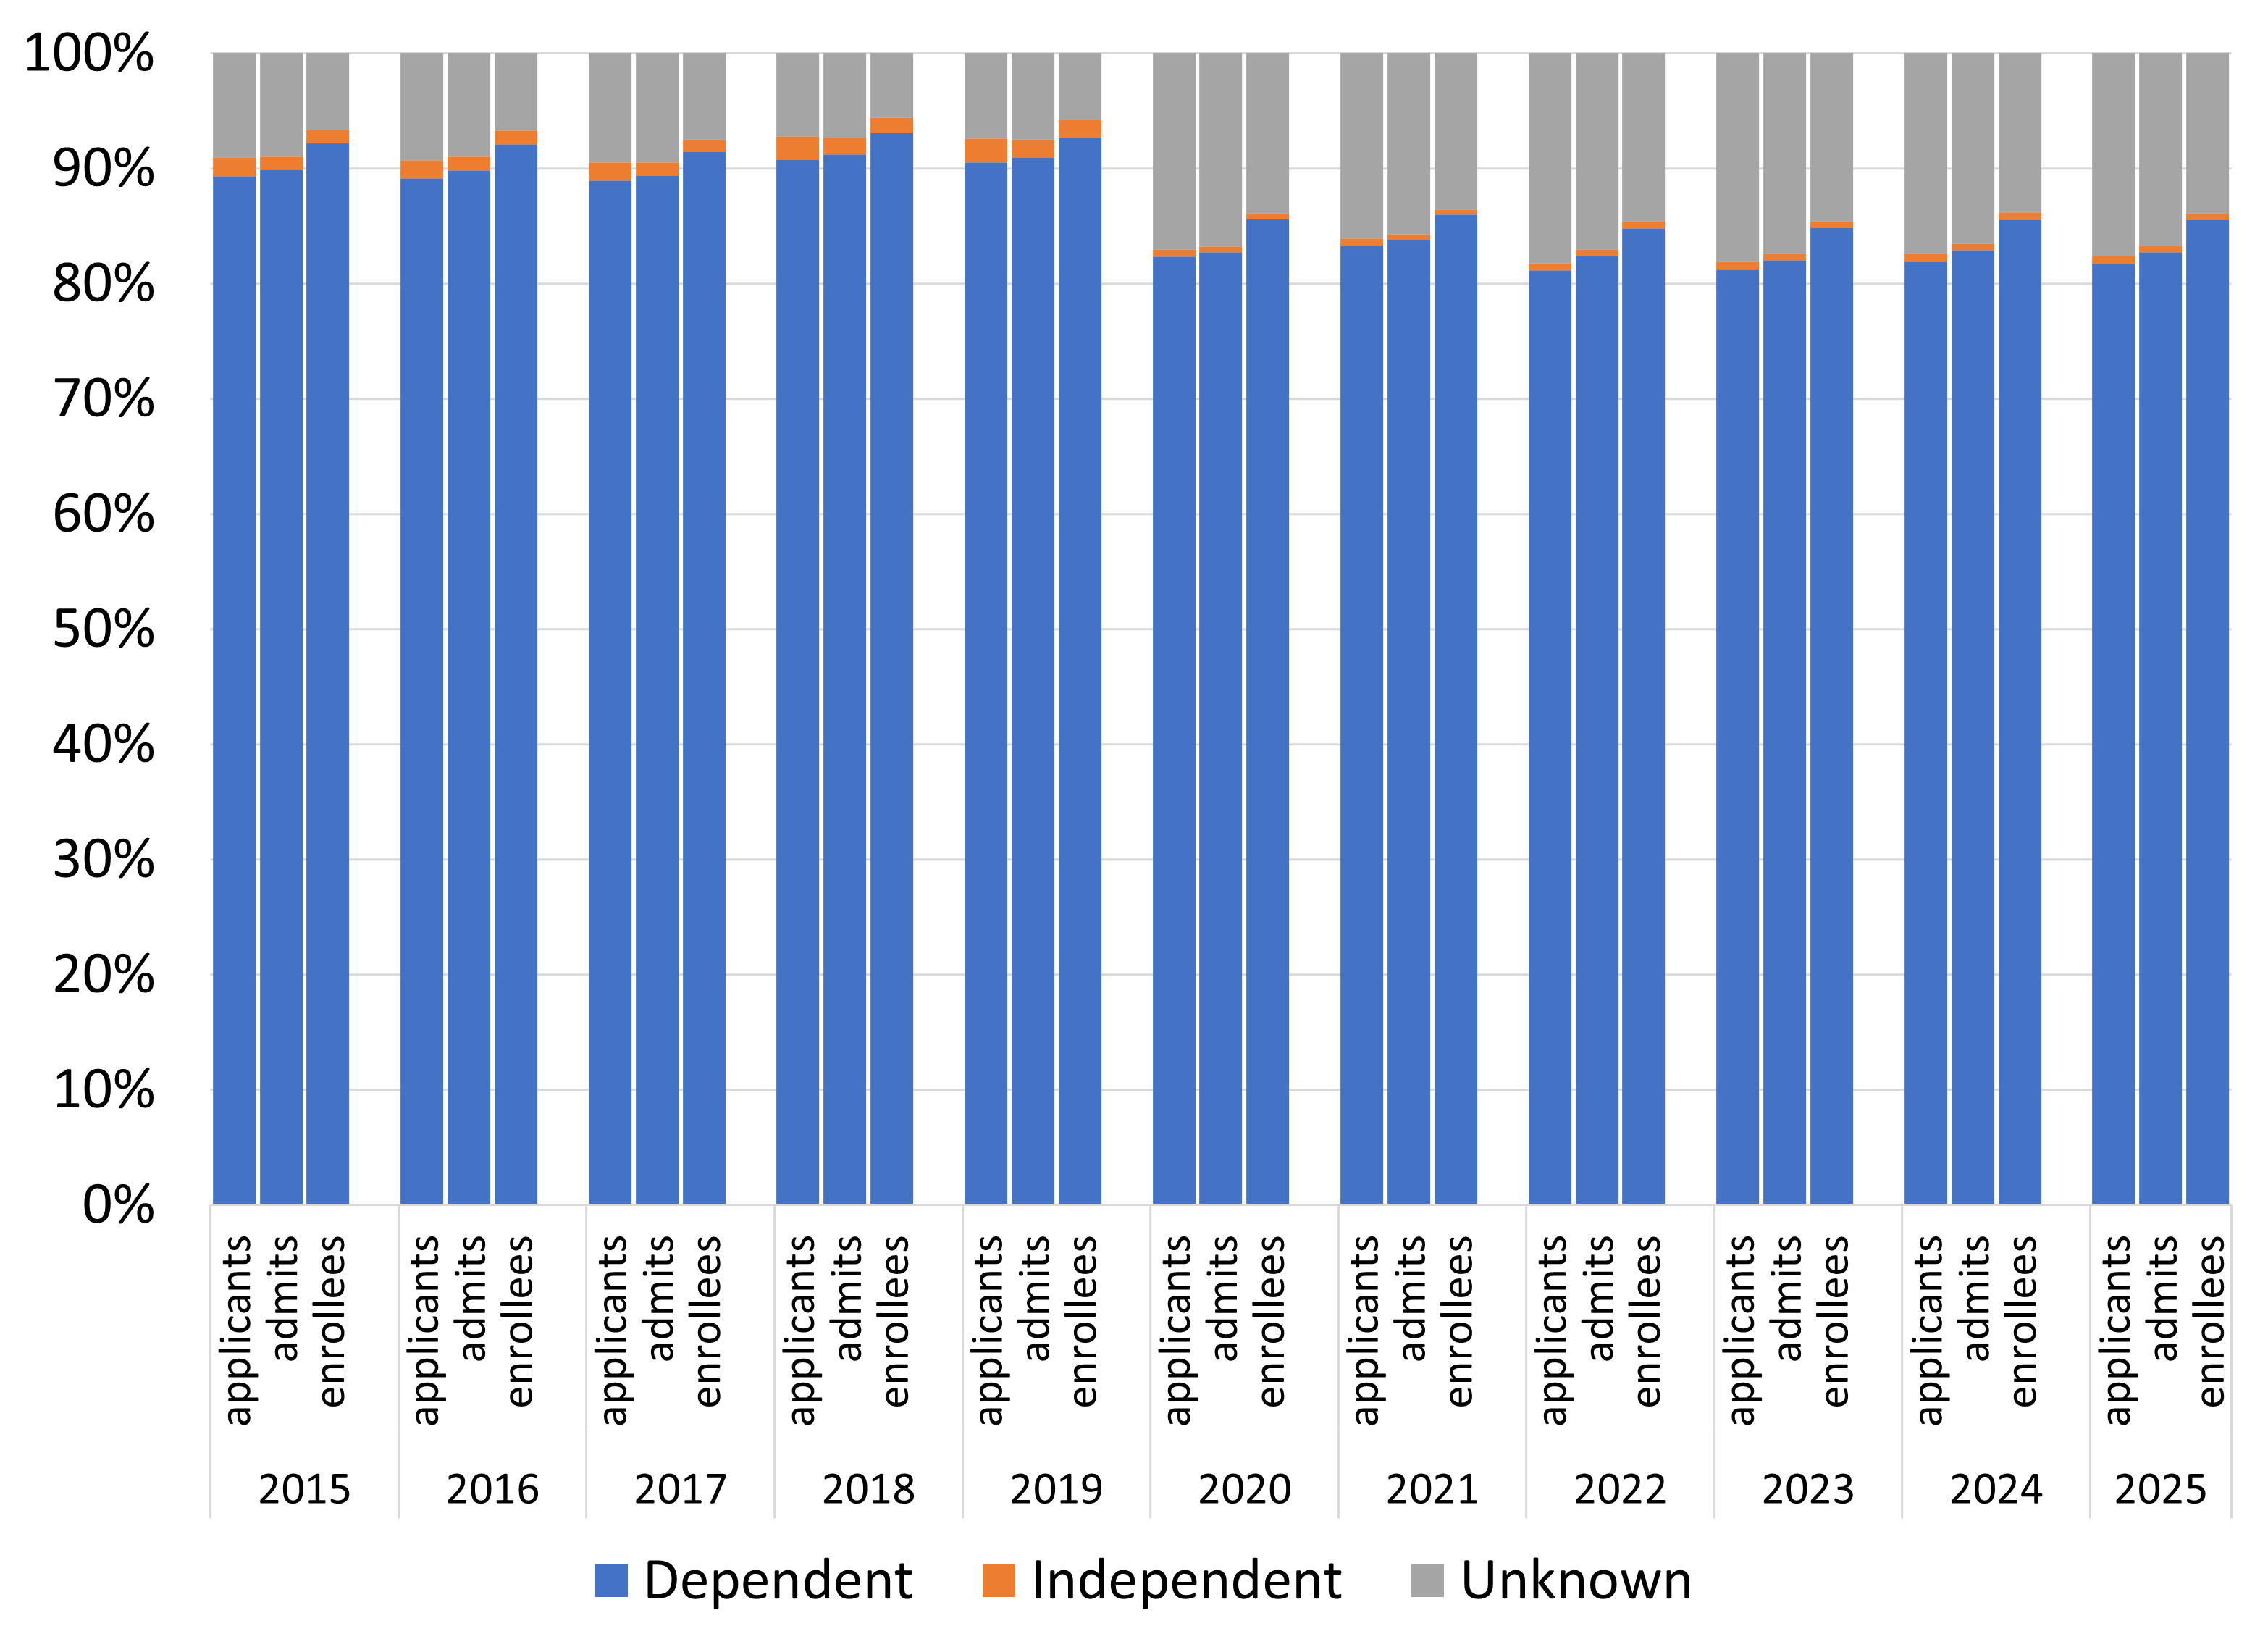
Share of undergraduate freshman applicants, admits, and enrollees by dependency
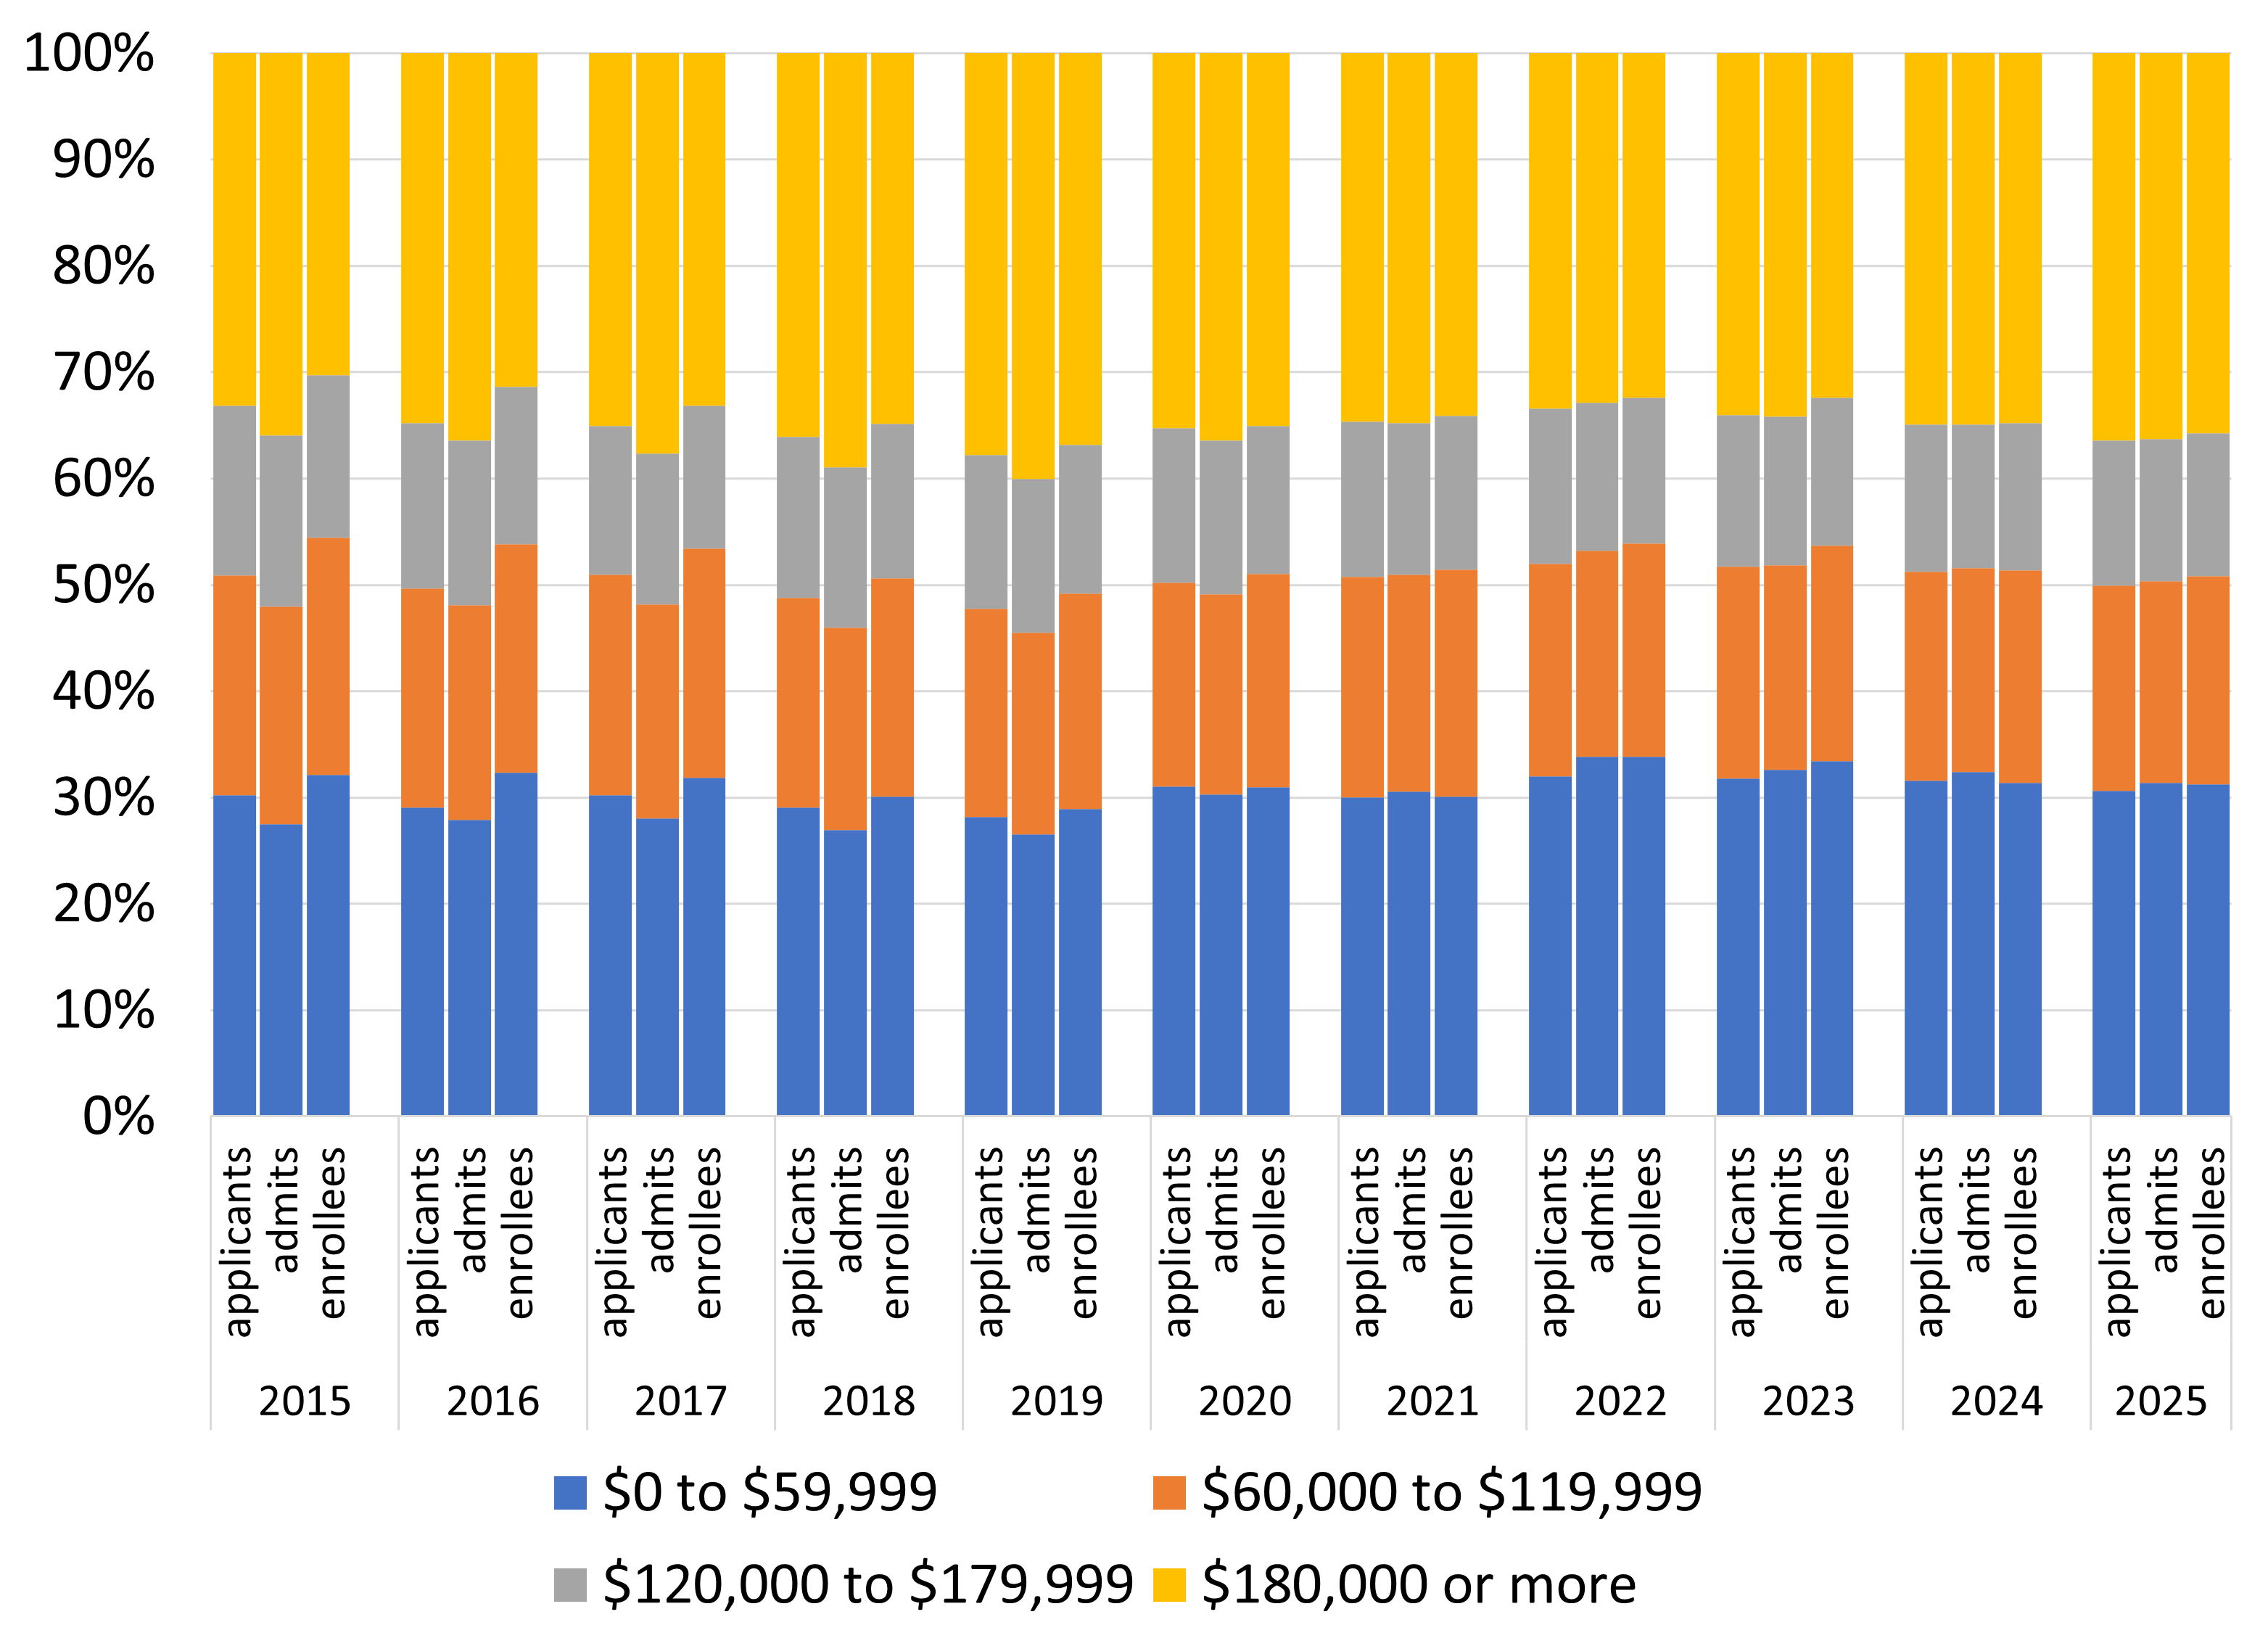
Share of undergraduate dependent freshman applicants, admits, and enrollees by income range
source: UC Data Warehouse
UC provides opportunities by enrolling an economically diverse student body, including a large number of low-income students. In fall 2025, over 80 percent of freshman applicants, admits, and enrollees were dependent, about one percent were independent, and the rest were unknown. In recent years, 31–34 percent of dependent freshman applicants, admits, and enrollees have had parents’ income under $60,000, 19–20 percent were between $60,000 and $119,999, 13–15 percent were between $120,000 and $179,999, and 32–36 percent were at least $180,000.
note: Dependency status and parental income are reported on the application for admission, and can vary from that provided on financial aid applications. All dollar amounts are in inflation-adjusted 2025 dollars. The unknown category comprises students who did not provide income information on the application. Income adjusted for inflation using Consumer Price Index data from the U.S. Bureau of Labor Statistics.
Almost one-third of dependent transfer applicants, admits, and enrollees had parental income under $60,000 in fall 2025.
2.2.3 Undergraduate transfer applicants, admits, and enrollees by self-reported parents’ income, Universitywide, Fall 2015 to 2025
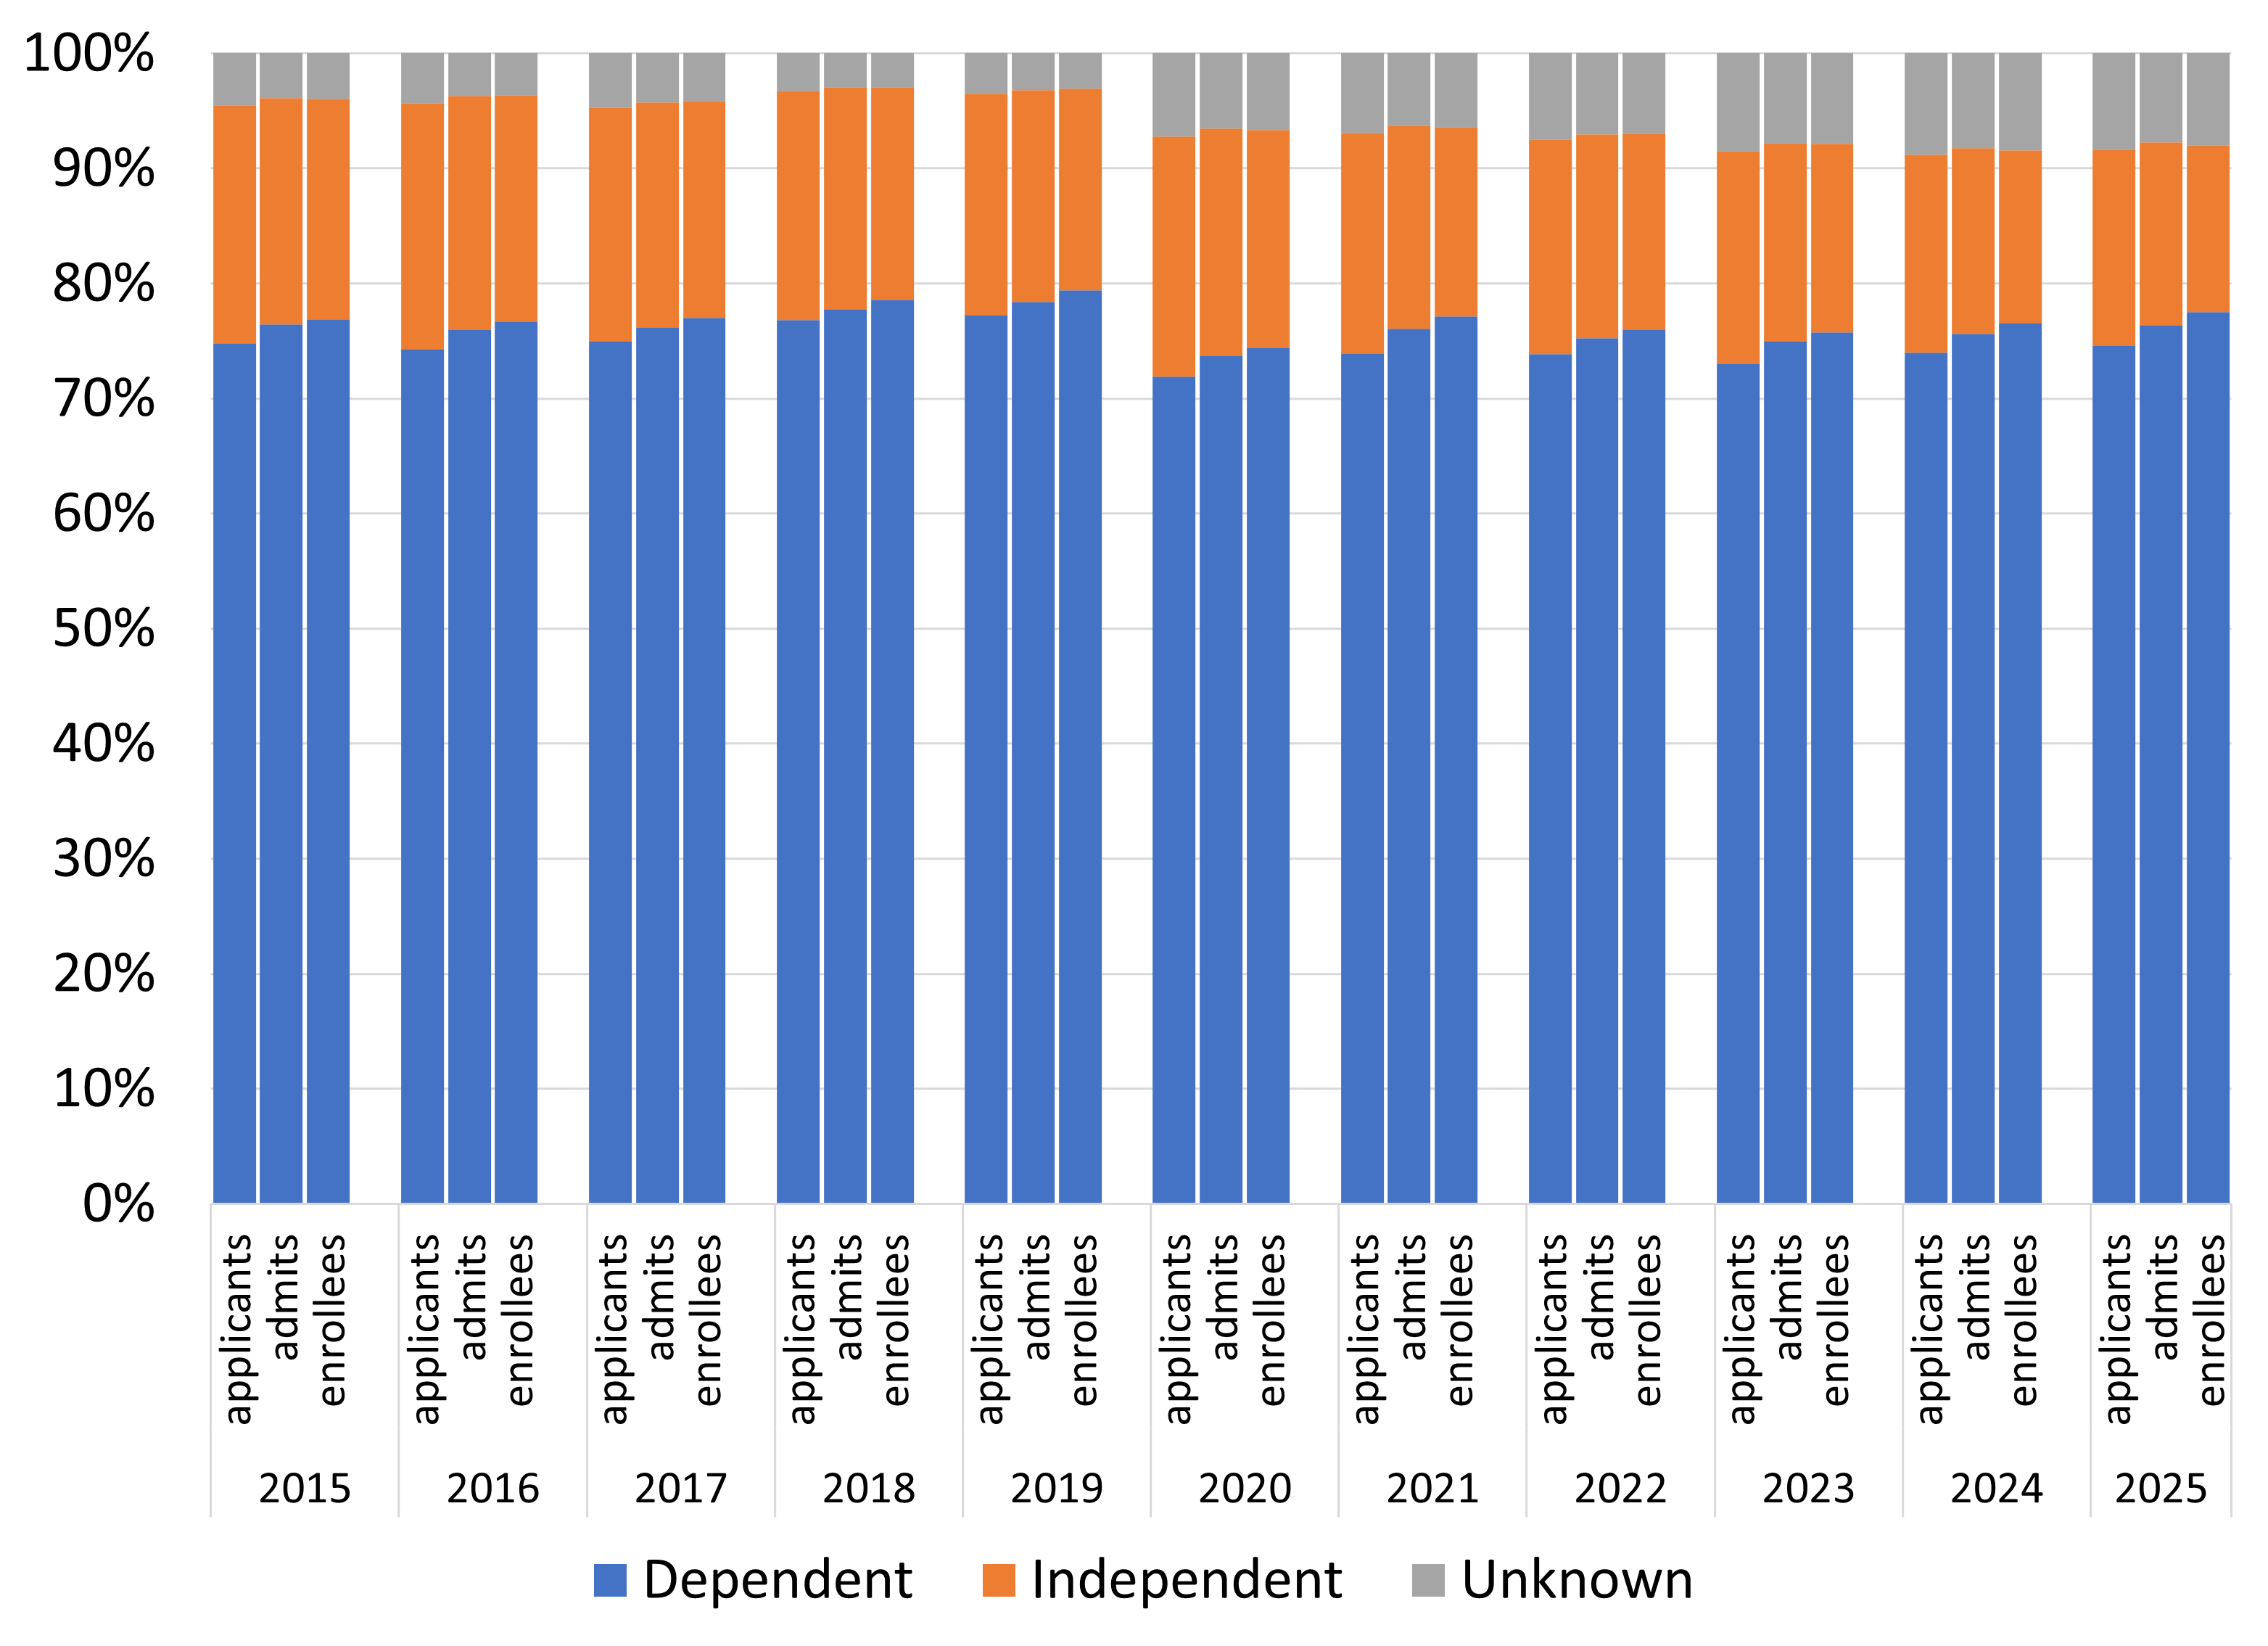
Share of undergraduate transfer applicants, admits, and enrollees by dependency
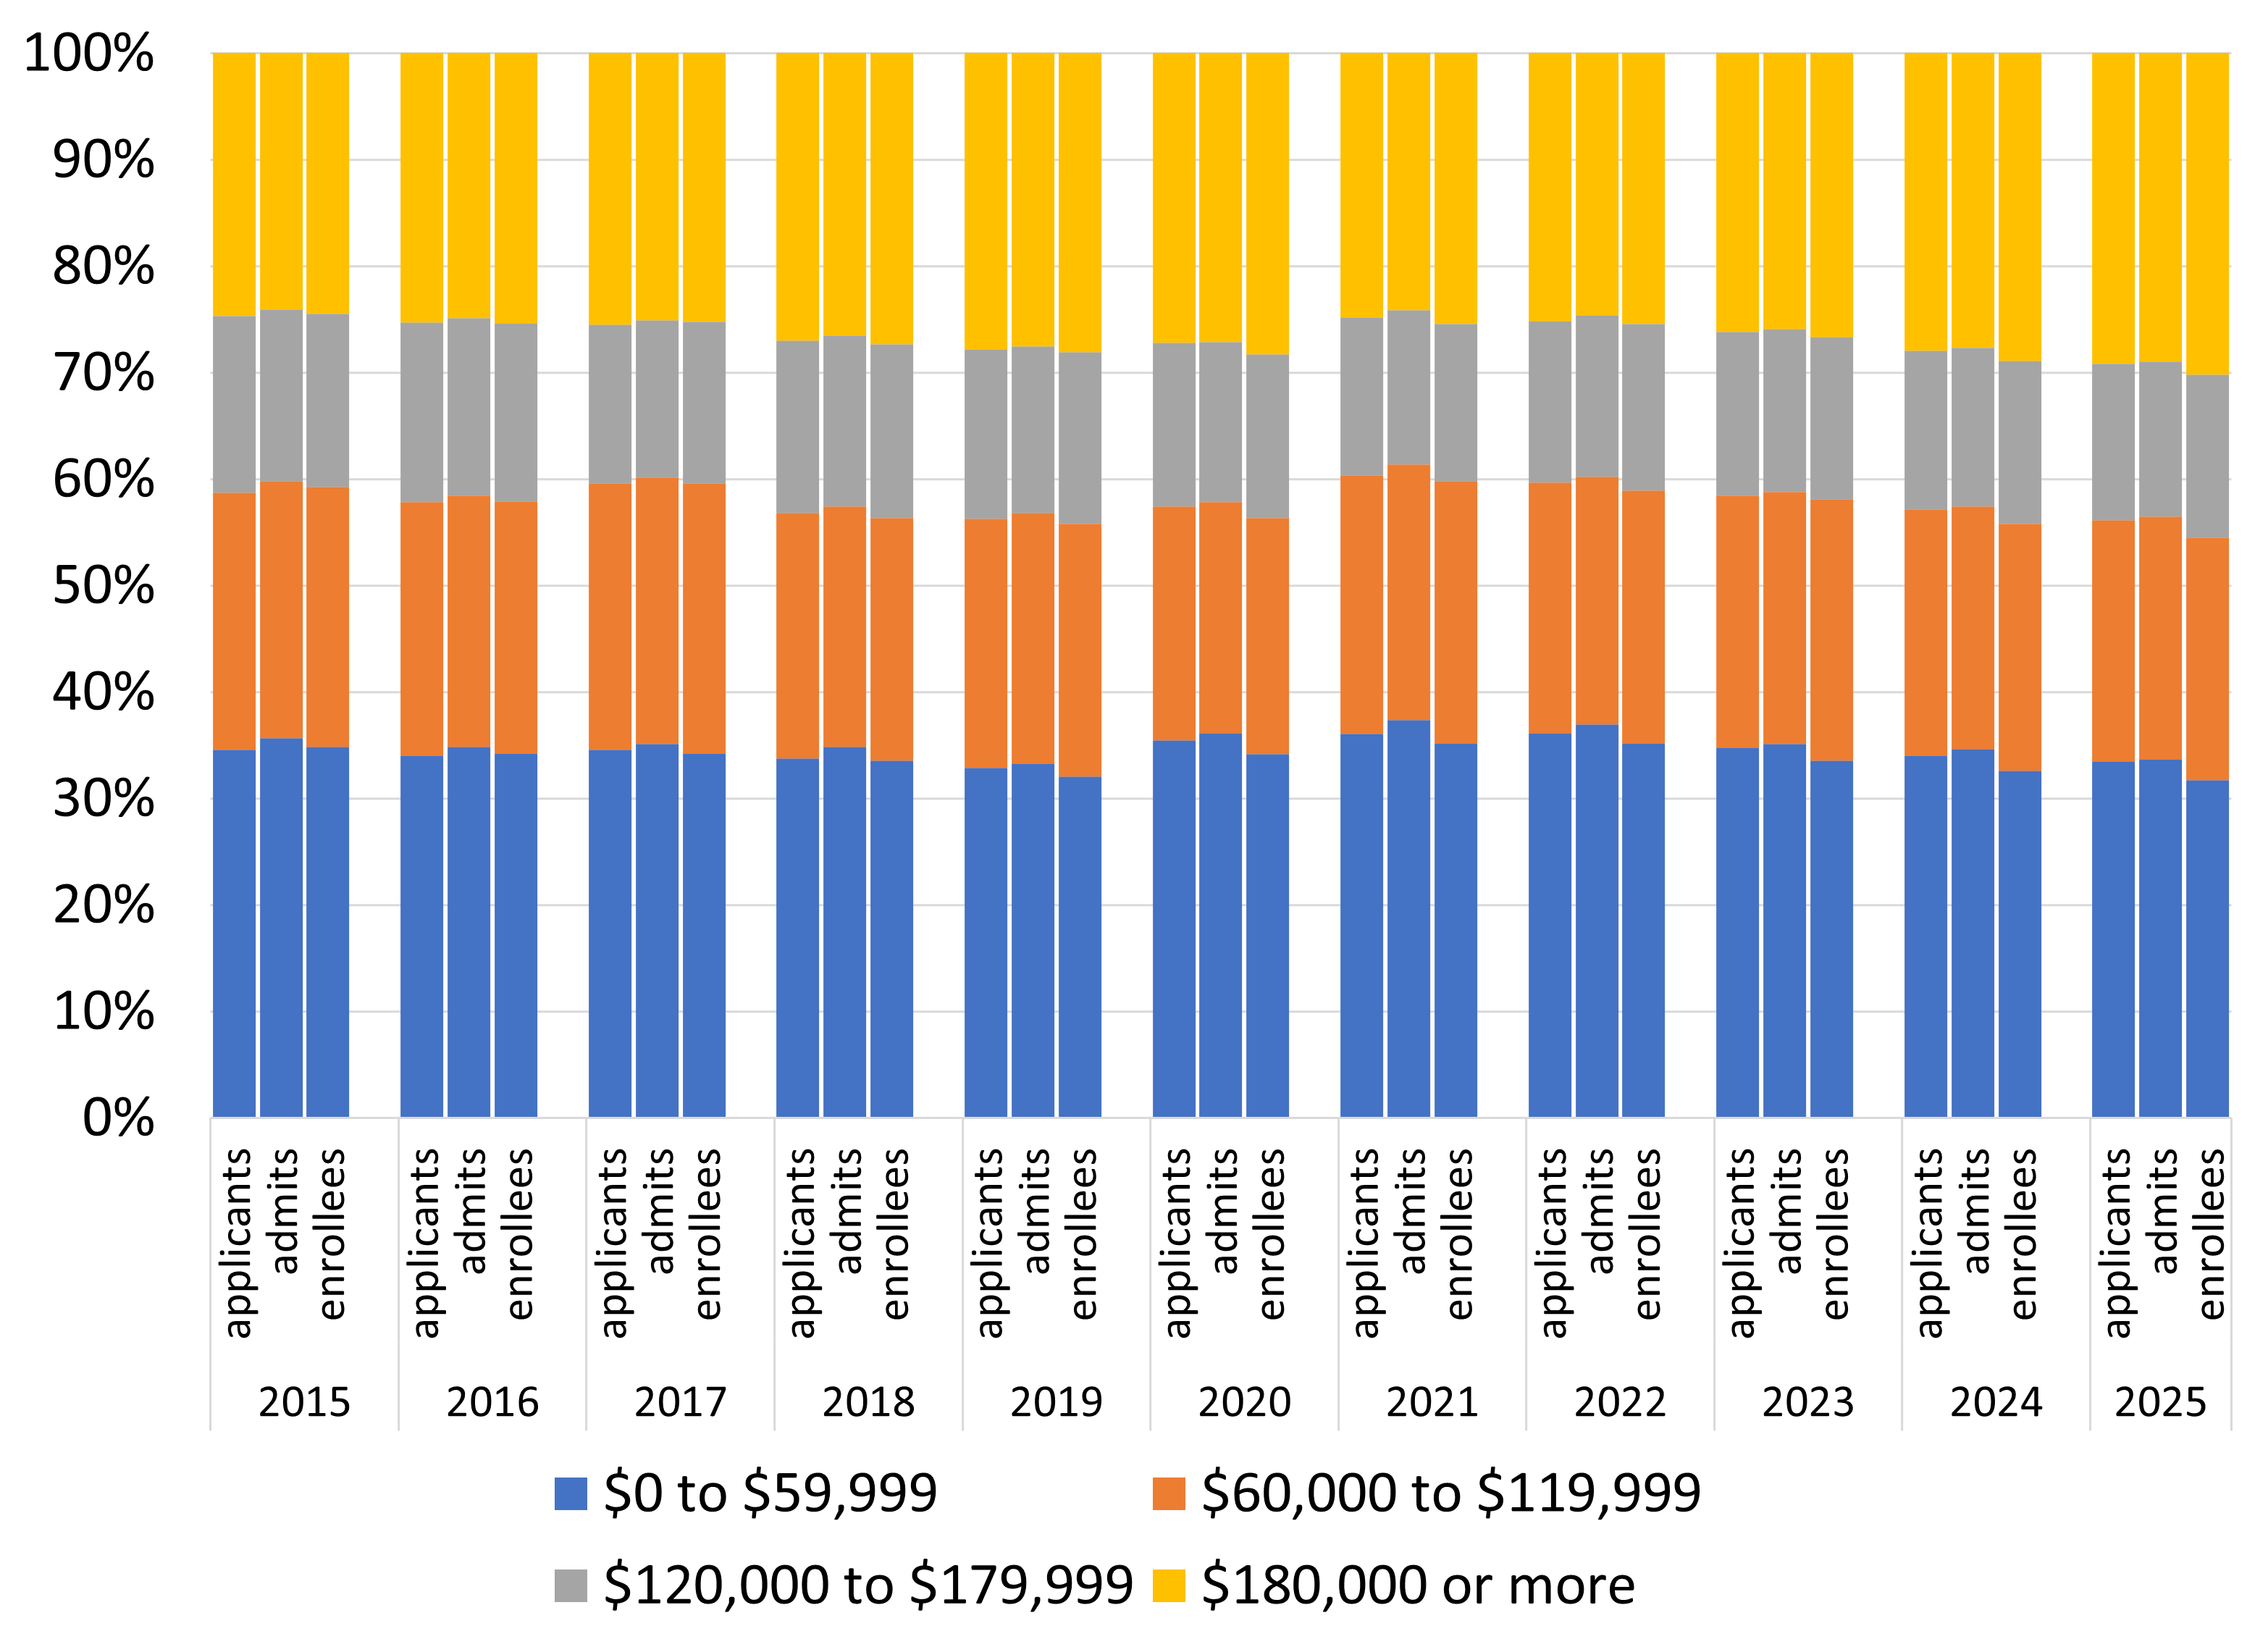
Share of undergraduate dependent transfer applicants, admits, and enrollees by income range
source: UC Data Warehouse
UC’s transfer students are economically diverse, including a sizable number of low-income students. In fall 2025, over three-quarters (77 percent) of transfer enrollees were dependent. Almost one-sixth (15 percent) were independent, and the remainder (eight percent) were unknown.
Among dependent transfer enrollees, 32 percent had incomes under $60,000, 23 percent were between $60,000–$119,999, 15 percent were between $120,000–$179,999, and 30 percent were at $180,000 or above.
note: Dependency status and parental income are reported on the application for admission and can vary from that provided on financial aid applications. All dollar amounts are in inflation-adjusted 2025 dollars. The unknown category comprises students who did not provide income information on the application. Income adjusted for Inflation using Consumer Price Index data from the U.S. Bureau of Labor Statistics.
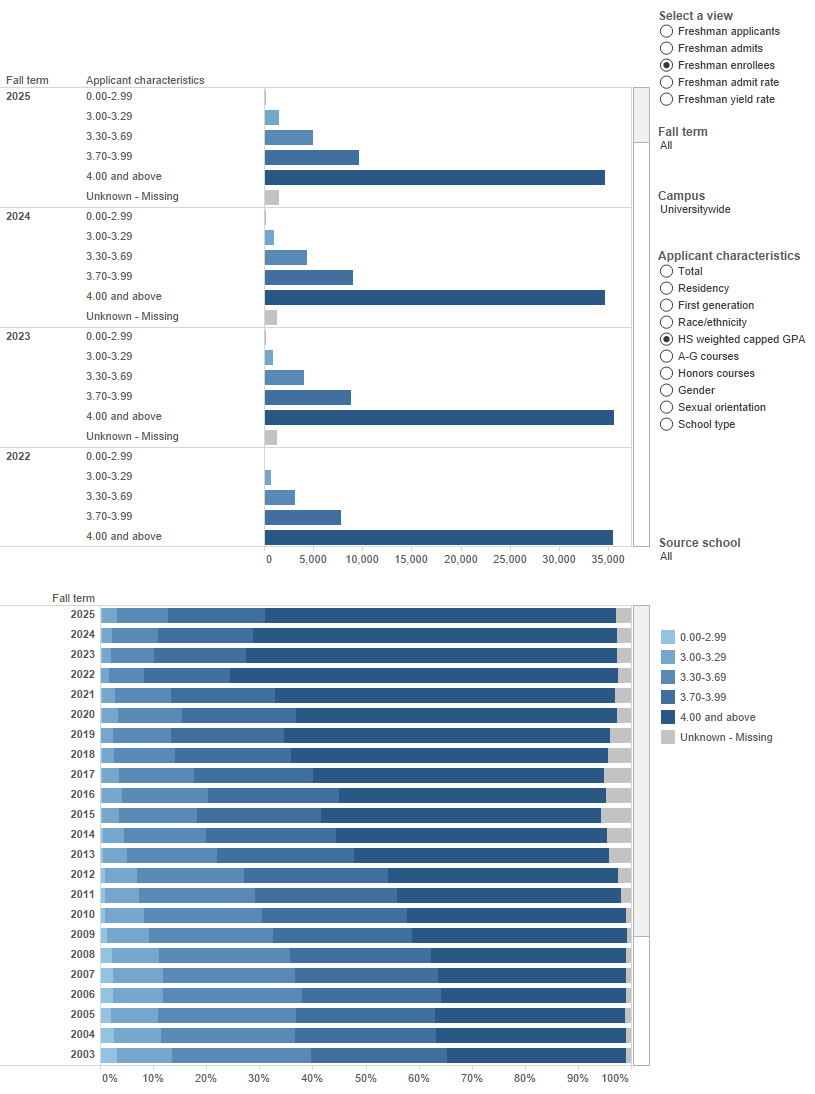
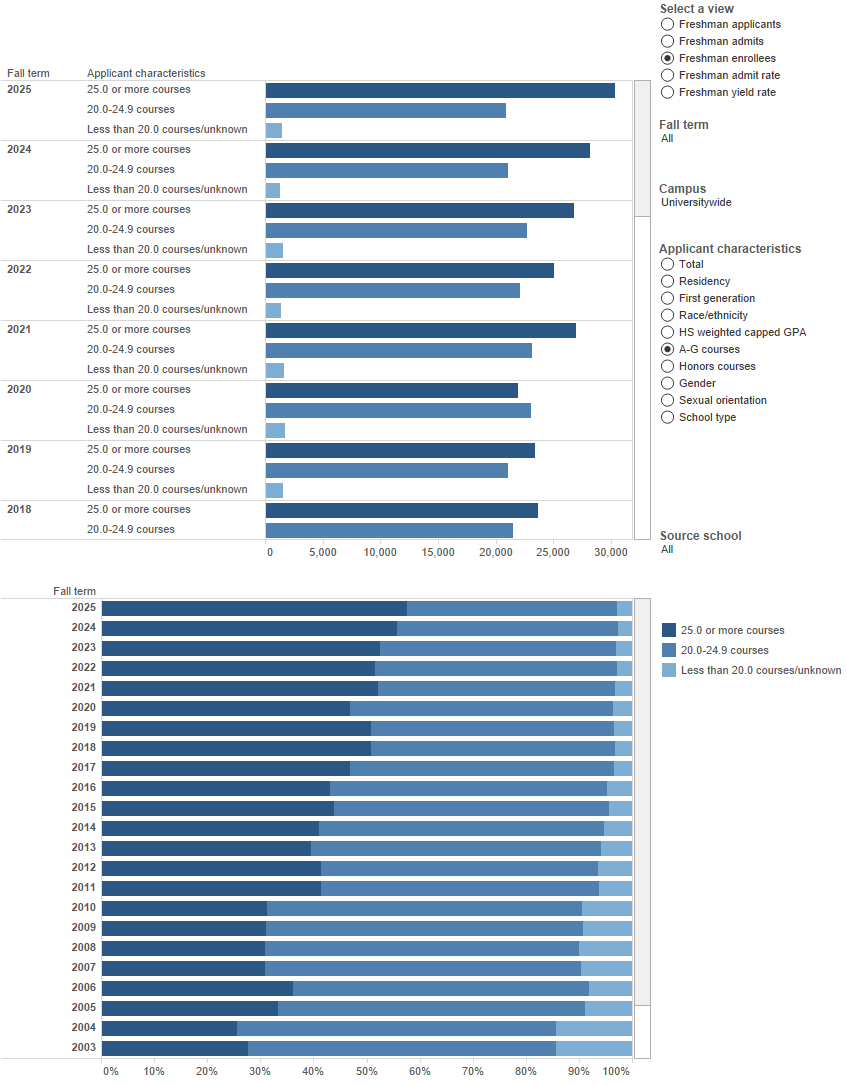
Freshmen are entering UC with higher HSGPAs and more A-G courses completed over time.
2.3.1 A-G (college preparatory) courses and weighted, capped high school grade point average (HSGPA) of entering freshmen, as share of class, Universitywide, fall 1994 to 2025
Freshman fall admissions summary dashboard | high school GPA
Freshman fall admissions dashboard | A-G courses
source: UC Information Center
From 2015 to 2025, the share of entering freshmen completing 25 or more college-preparatory courses went up from 44 percent to 58 percent, while the share having a HSGPA of 4.0 or higher went up from 53 percent to 66 percent.
notes:
- A-G courses refer to those high school courses that UC has reviewed and approved as college preparatory. The minimum number of required A-G courses is 15.
- Weighted, capped HSGPA means that students may receive a maximum of eight semesters of honors credit.
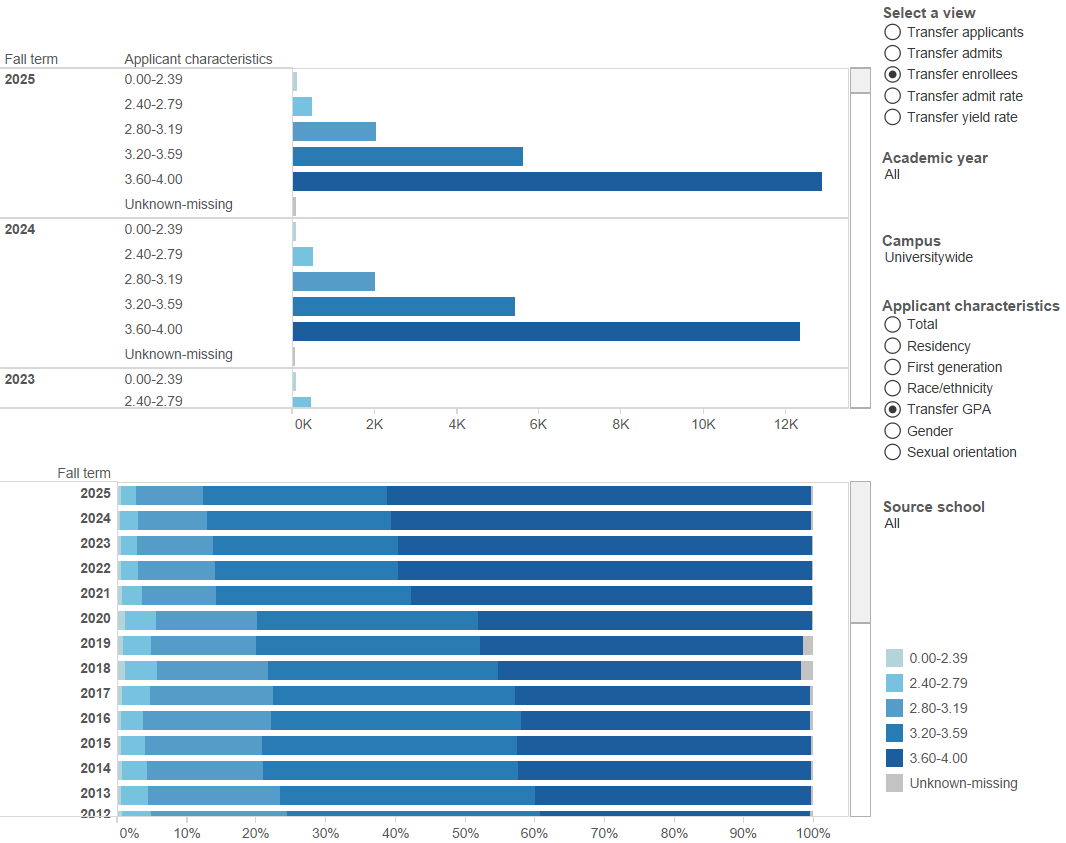
UC transfer students entering in fall 2025 performed better academically than their counterparts a decade ago, as measured by their grades in pre-UC college courses.
2.3.2 Pre-UC college grade point average (GPA) of entering transfer students, as share of class, Universitywide, fall 1994 to 2025
Transfer fall admissions summary dashboard | Transfer GPA
source: UC Information Center
The academic qualifications of transfer students entering UC have improved over time, as reflected by an increase in the share of students having a 3.6 or higher pre-UC college GPA, from 42 percent in fall 2015 to 61 percent in fall 2025.
note: The transfer GPA is based on grades for college-level courses reviewed and approved by UC for transfer credit from the college(s) where students were previously enrolled.
UC’s average proportion of domestic nonresident or international students was 15.8 percent in fall 2024, well below the 32.2 percent average for other AAU public institutions.
2.4.1 Residency of undergraduate students, UC campuses vs. other AAU public institutions, fall 2024
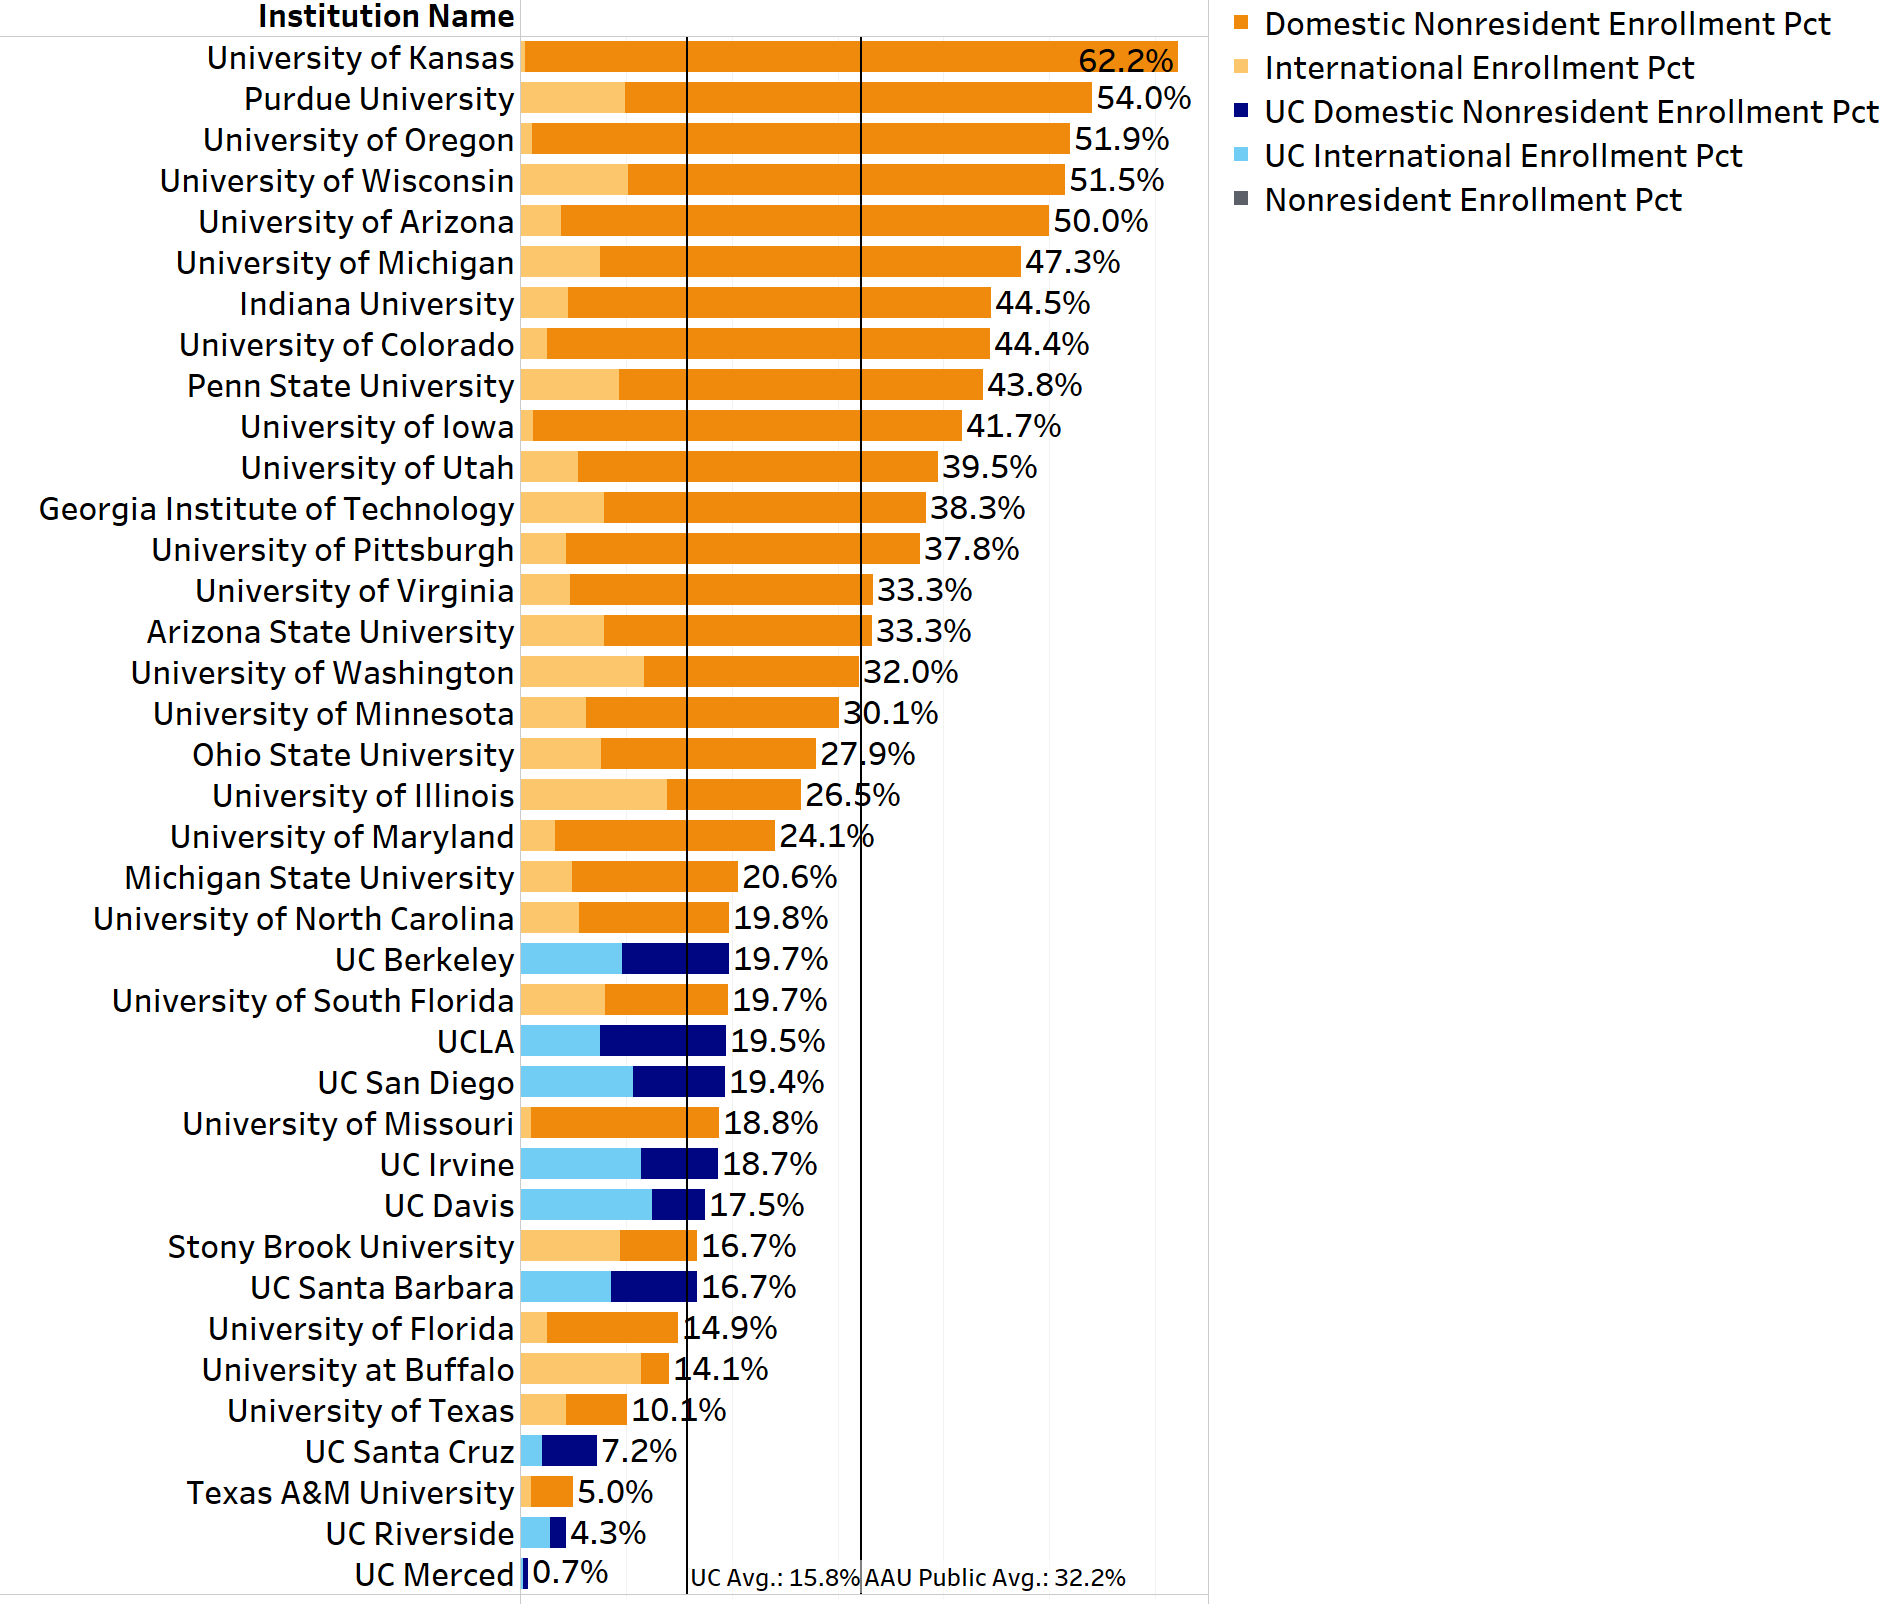
sources: UC Data Warehouse (UC data) and Common Data Set (AAU Publics data)
Nonresidents bring additional geographic diversity to the student body. They also pay the full cost of their education. In 2024–25, systemwide tuition and fees for a nonresident undergraduate were $48,636, compared to $14,436 for California resident students.
Nonresident applicants must meet higher standards to be considered for admission. The minimum high school GPA for nonresident freshmen is 3.4, compared to 3.0 for California freshmen. The minimum college GPA for nonresident transfer students is 2.8, compared to 2.4 for California residents.
notes:
- AAU public average excludes UC; includes AAU public universities except Rutgers New Brunswick (data not available).
- Fall 2024 is the latest available year of comparable data for UC campuses, and AAU campuses.
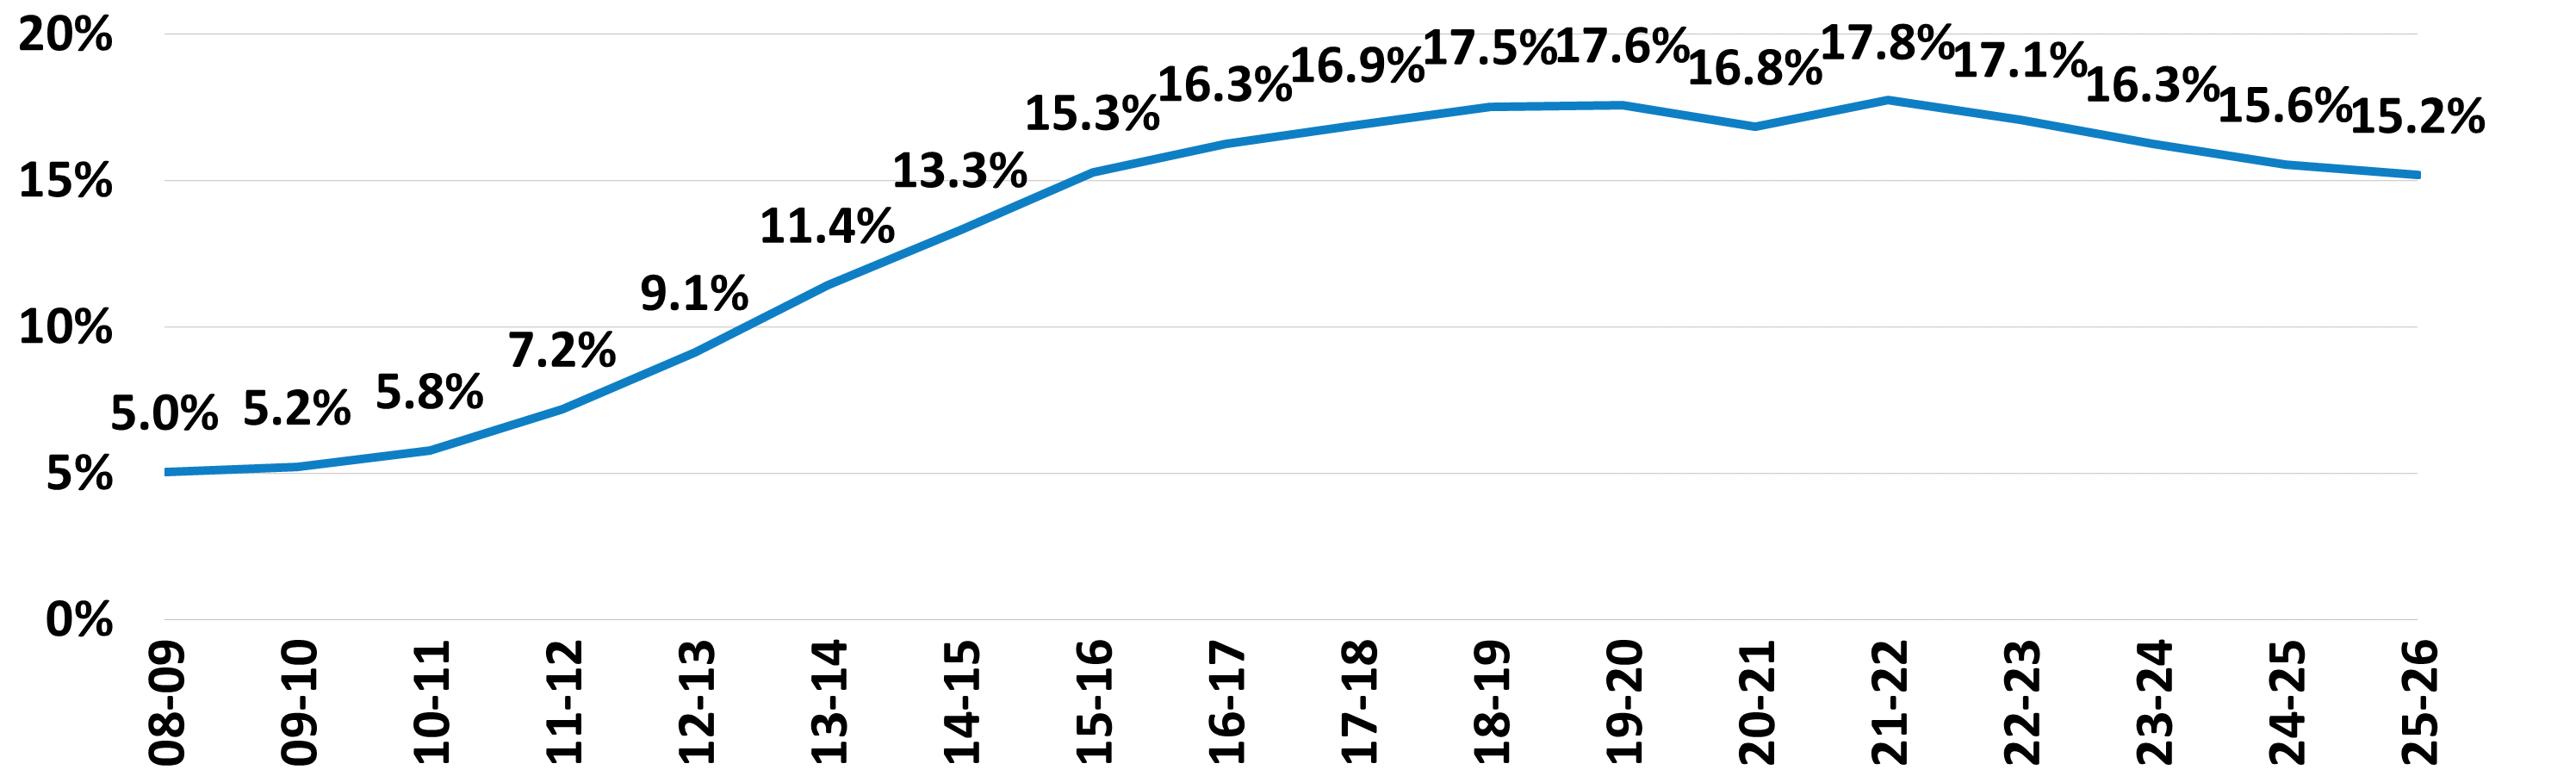
The proportion of undergraduate students paying nonresident supplemental tuition has decreased over the last four years, in part due to the State-funded nonresident replacement at UC Berkeley, UCLA, and UC San Diego.
2.4.2 Percentage of undergraduate enrollees paying nonresident supplemental tuition by academic year, Universitywide, 2008–09 to 2025–26
source: UC Data Warehouse and UC campuses
Universitywide, from 2008–09 to 2015–16, the proportion of undergraduates paying nonresident supplemental tuition (NRST) went up from 5.0 percent to 15.3 percent. However, in recent years, the share of all undergraduates paying NRST decreased from 17.8 percent in 2021–22 to 15.2 percent in 2025–26.
The proportion of nonresident students at individual campuses varies depending on a campus’ capacity, and its ability to recruit nonresident students, as well as its nonresident cap under a Regents policy approved in May 2017, which applies to total undergraduate numbers. Under the policy, effective in 2018–19, nonresident enrollment was limited to 18 percent at five UC campuses. At the other four campuses where the proportion of nonresidents already exceeded 18 percent — UC Berkeley, UC Irvine, UCLA, and UC San Diego — nonresident enrollment was capped at the proportion that each campus enrolled in 2017–18.
Beginning with the 2022 multi-year Compact with the Governor, the State committed to funding the annual replacement of 902 nonresident undergraduates with California residents at UC Berkeley, UCLA, and UC San Diego through 2026–27, with the goal of achieving an 18 percent nonresident enrollment share at each campus. To date, the State has funded this effort in 2022–23, 2023–24, and 2024–25, supporting the replacement of approximately 2,700 nonresident students with residents. These campuses have exceeded that target, replacing more than 3,000 nonresident students with California residents over this period.
note: This chart uses the average enrollment across all terms in the academic year (three quarters or two semesters). Data for the most recent year are estimates from UC campuses while prior-year data come from the UC Data Warehouse. Not all nonresident students pay nonresident supplemental tuition. Some have statutory exemptions, such as AB 540 students, children of UC employees, and others designated by the state. AB 540 students are considered California residents for tuition purposes as established by Assembly Bill 540, passed in 2001.
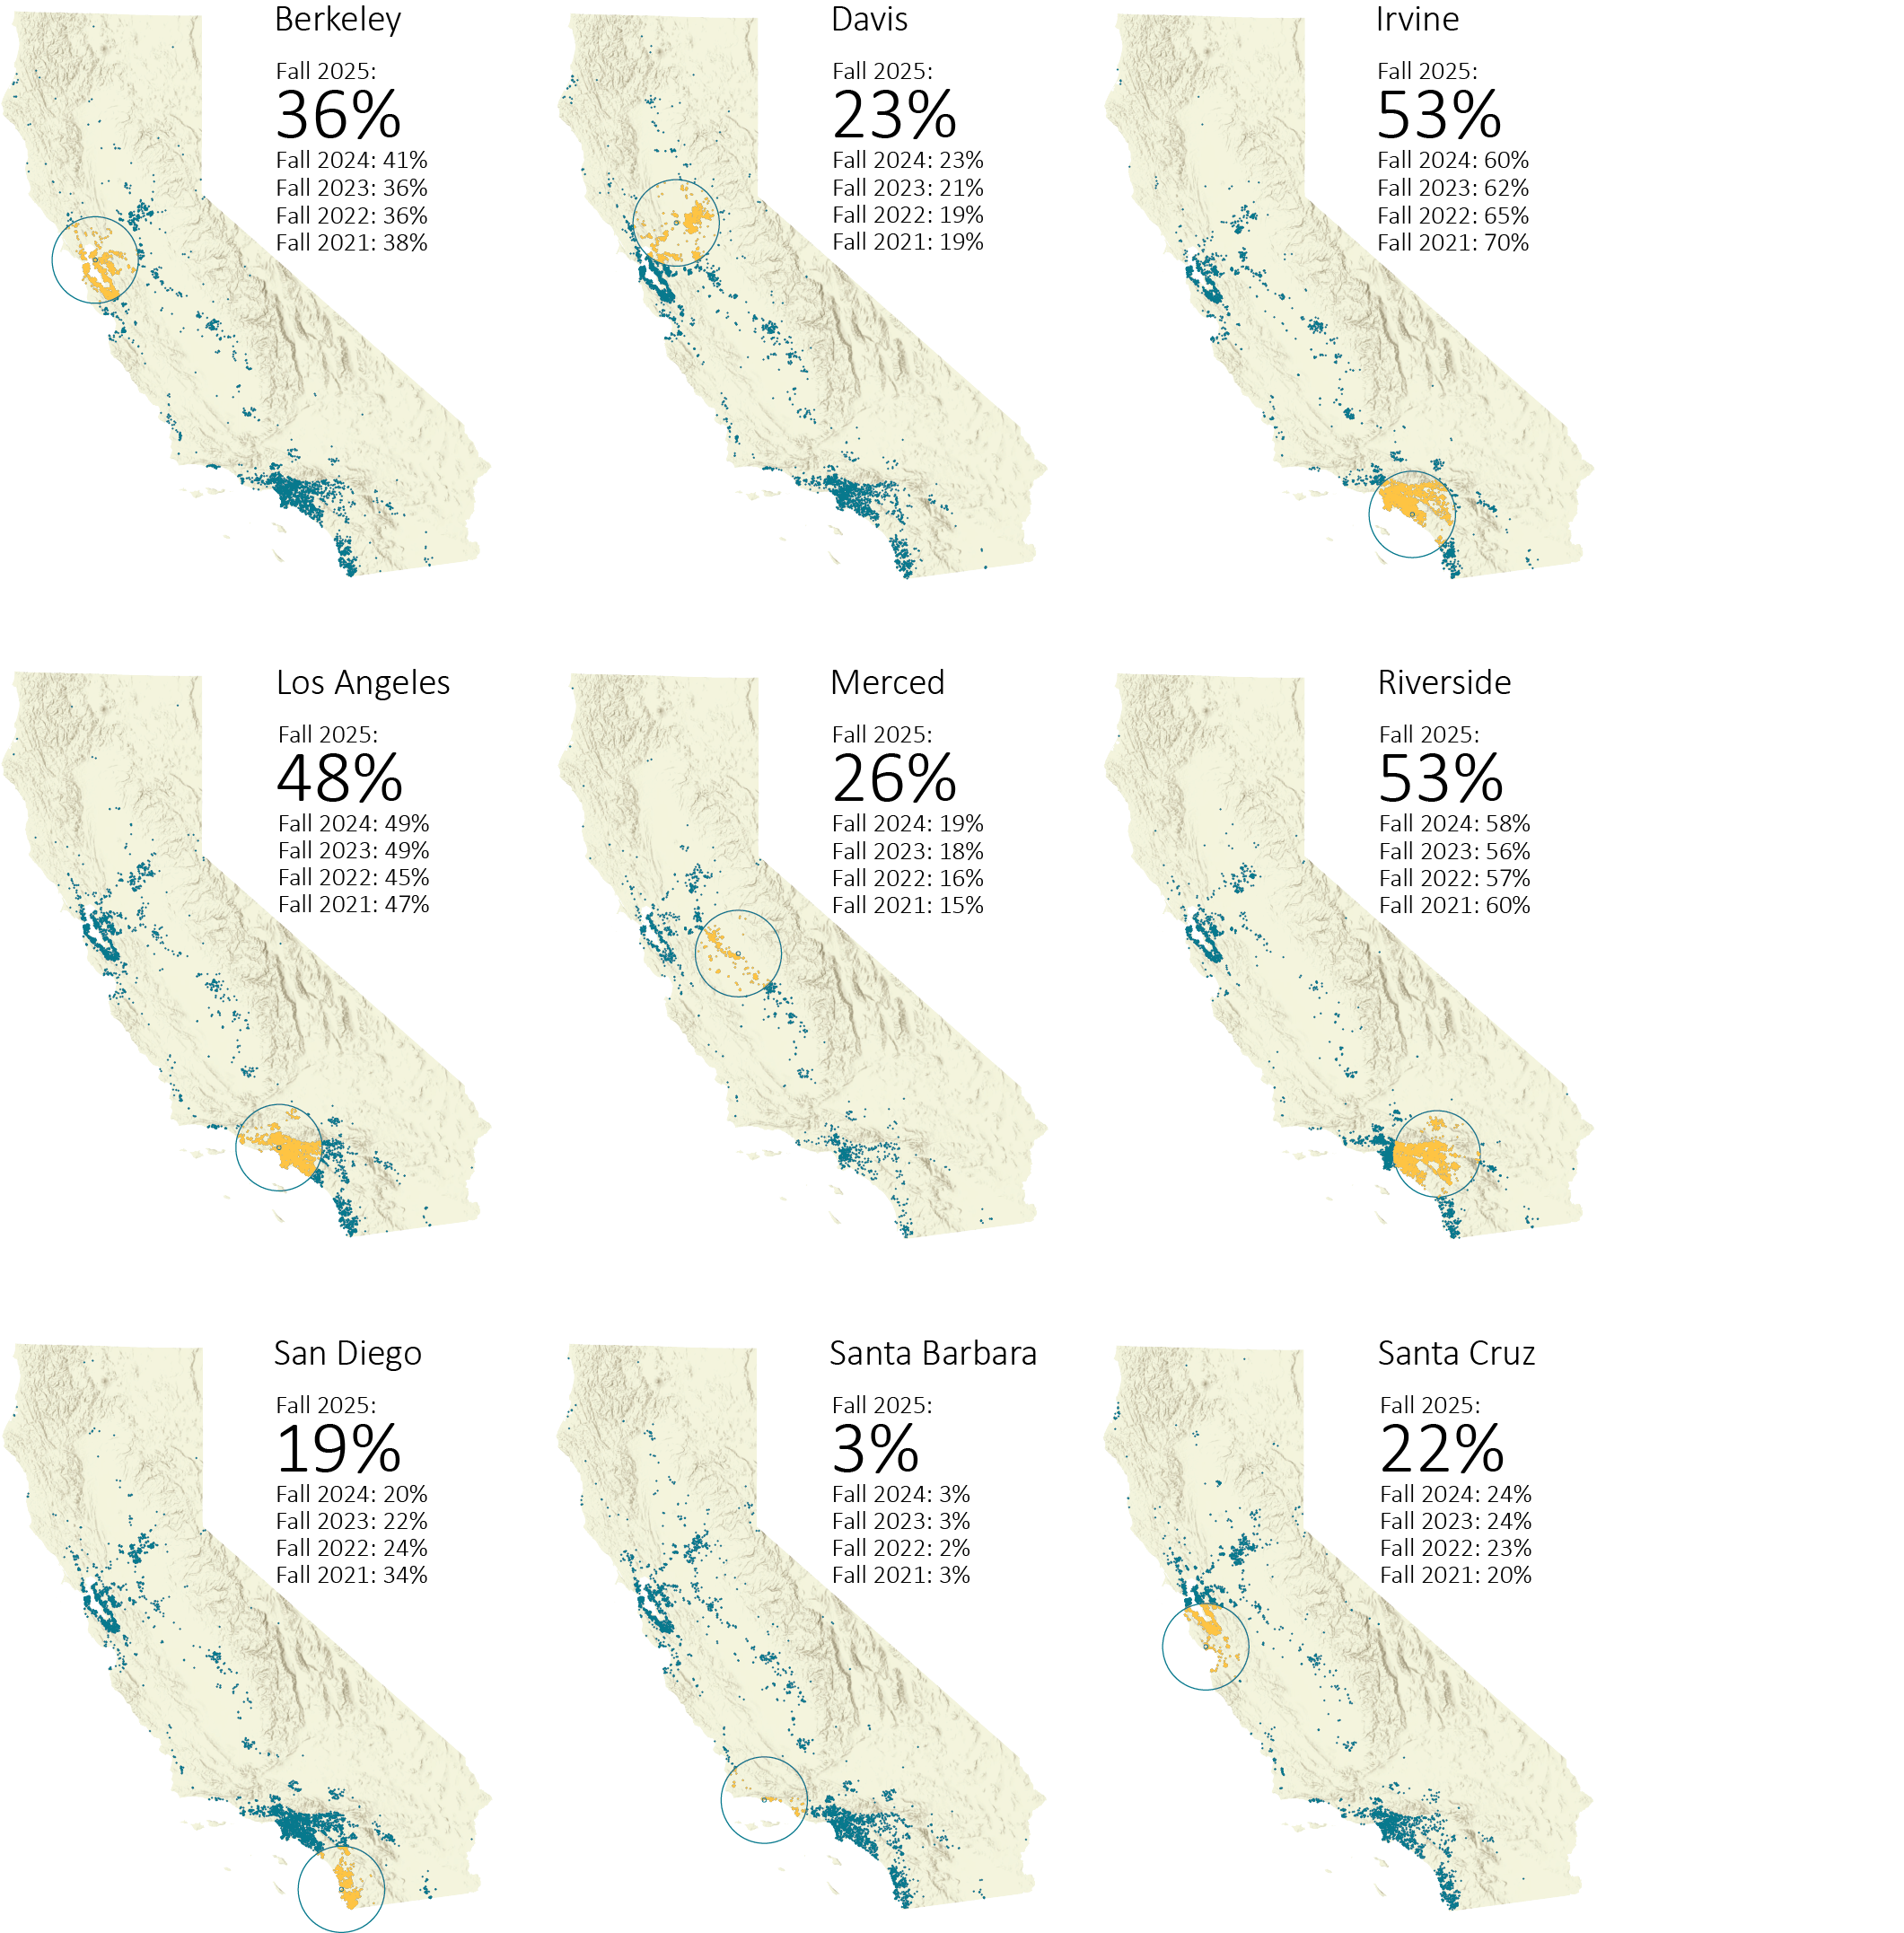
UC campuses draw freshmen from nearby regions and the major urban areas of California, with a systemwide 50-mile radius local enrollment rate of 33 percent.
2.4.3 Percentage of new California resident freshman enrollees whose home is within a 50-mile radius of their campus, Fall 2025
source: UC Data Warehouse
note: California residents are defined here as those with permanent addresses in California.
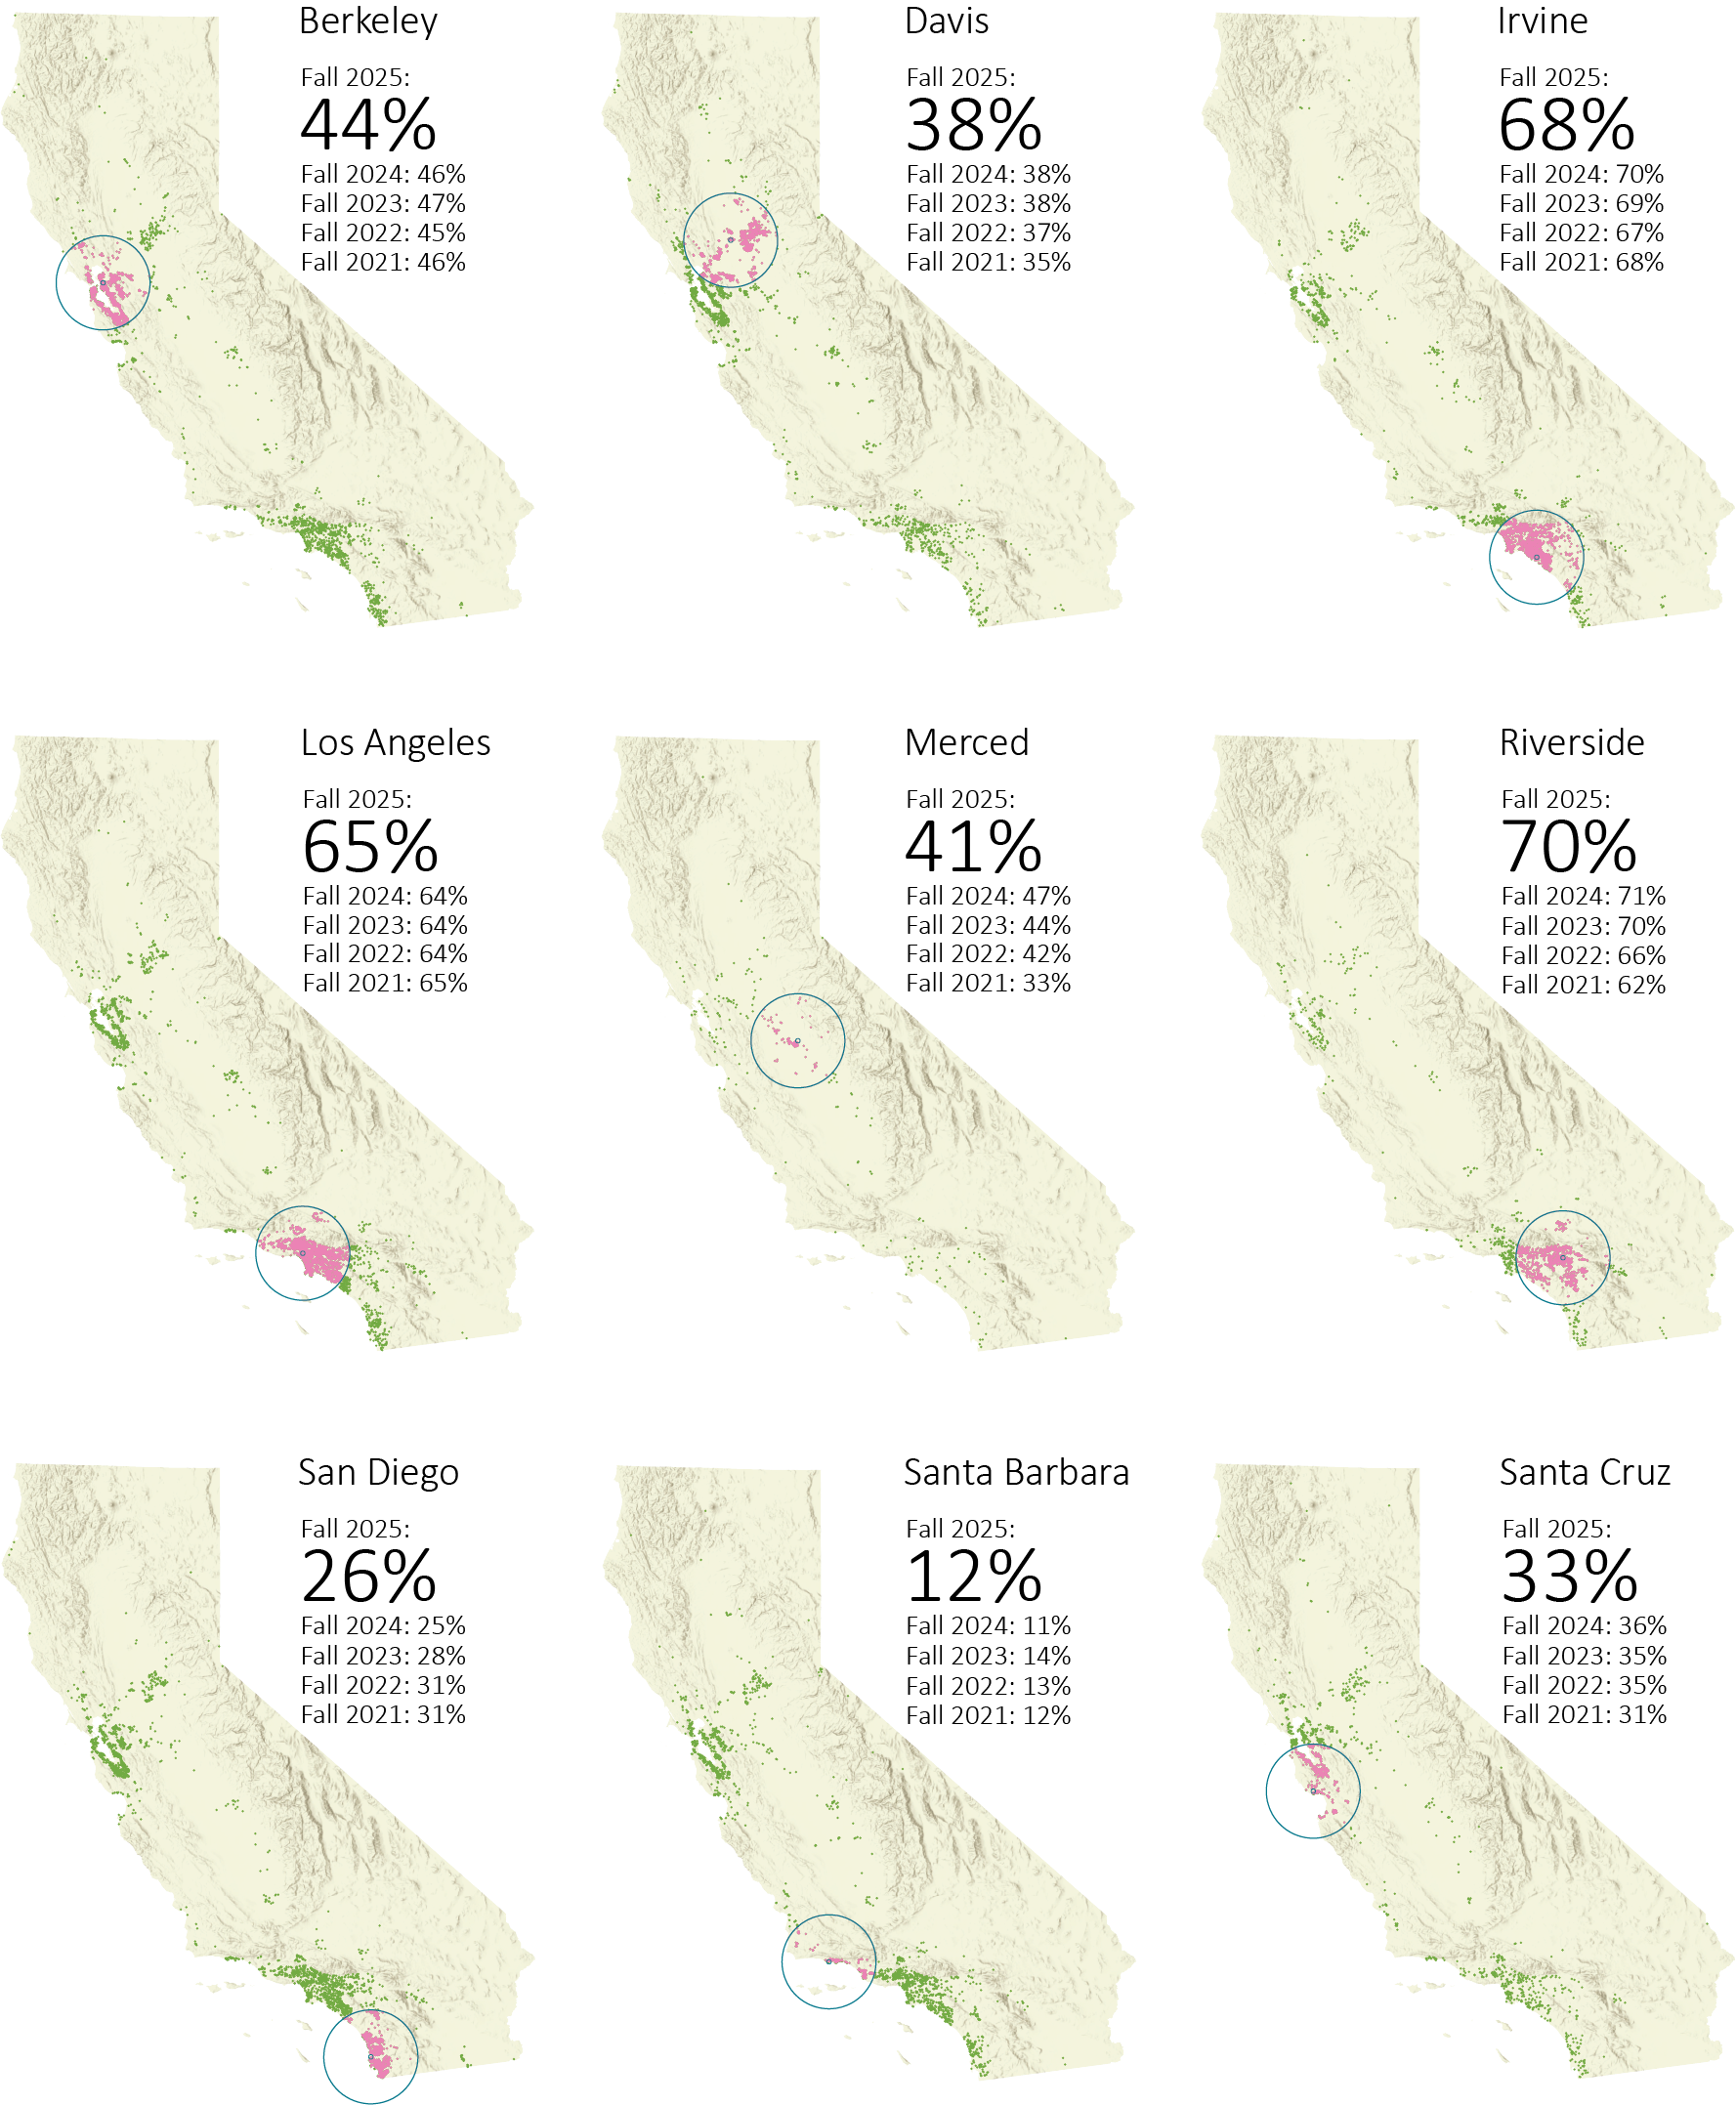
Local area enrollment rates for transfers are higher than for freshmen, with 45 percent enrolling at a UC campus within 50 miles of their homes.
2.4.4 Percentage of new California resident transfer enrollees whose home is within a 50-mile radius of their campus, Fall 2025
source: UC Data Warehouse
note: California residents are defined here as those with permanent addresses in California.
For more information
Explore the UC Information Center dashboards that provide downloadable data and context on undergraduate admissions and undergraduate enrollment with these subject area-specific urls:
universityofcalifornia.edu/about-us/information-center#undergraduate-admissions
universityofcalifornia.edu/about-us/information-center#undergraduate-enrollment
In addition to those dashboards supporting indicators in this chapter, other examples include:
- Fall enrollment at a glance dashboard
Fall undergraduate and graduate enrollment by discipline, gender, ethnicity, residency, country (for undergraduates), and campus
- Undergraduate admissions summary dashboard
with downloadable data on applicants, admits, and enrollees by residency, ethnicity, and source school type
- Admissions by source school dashboard
with downloadable data on applicants, admits and enrollments by California high schools and California community colleges for freshmen and transfer entrants by source school, mean GPA, ethnicity and school
- Freshman admission by discipline dashboard
with downloadable data on GPA ranges and counts for freshman applicants in broad discipline
- Transfers by major dashboard
GPA ranges and counts for transfer applicants by major
- Undergraduate representation gap analysis dashboard
Analysis of the gaps between the share of: high school graduates vs. freshman UC applicants, admits, and new enrollees and California Community College (CCC) students vs. CCC-to-UC transfer applicants, admits, and new enrollees by racial/ethnic group
- California resident freshman-to-transfer ratio dashboard
tracks the share of each entering class of California residents who came in as freshmen vs. transfers
Download data tables for chapter 2 indicators (Excel format)
Chapter Two: Undergraduate Students | Admissons and Enrollment
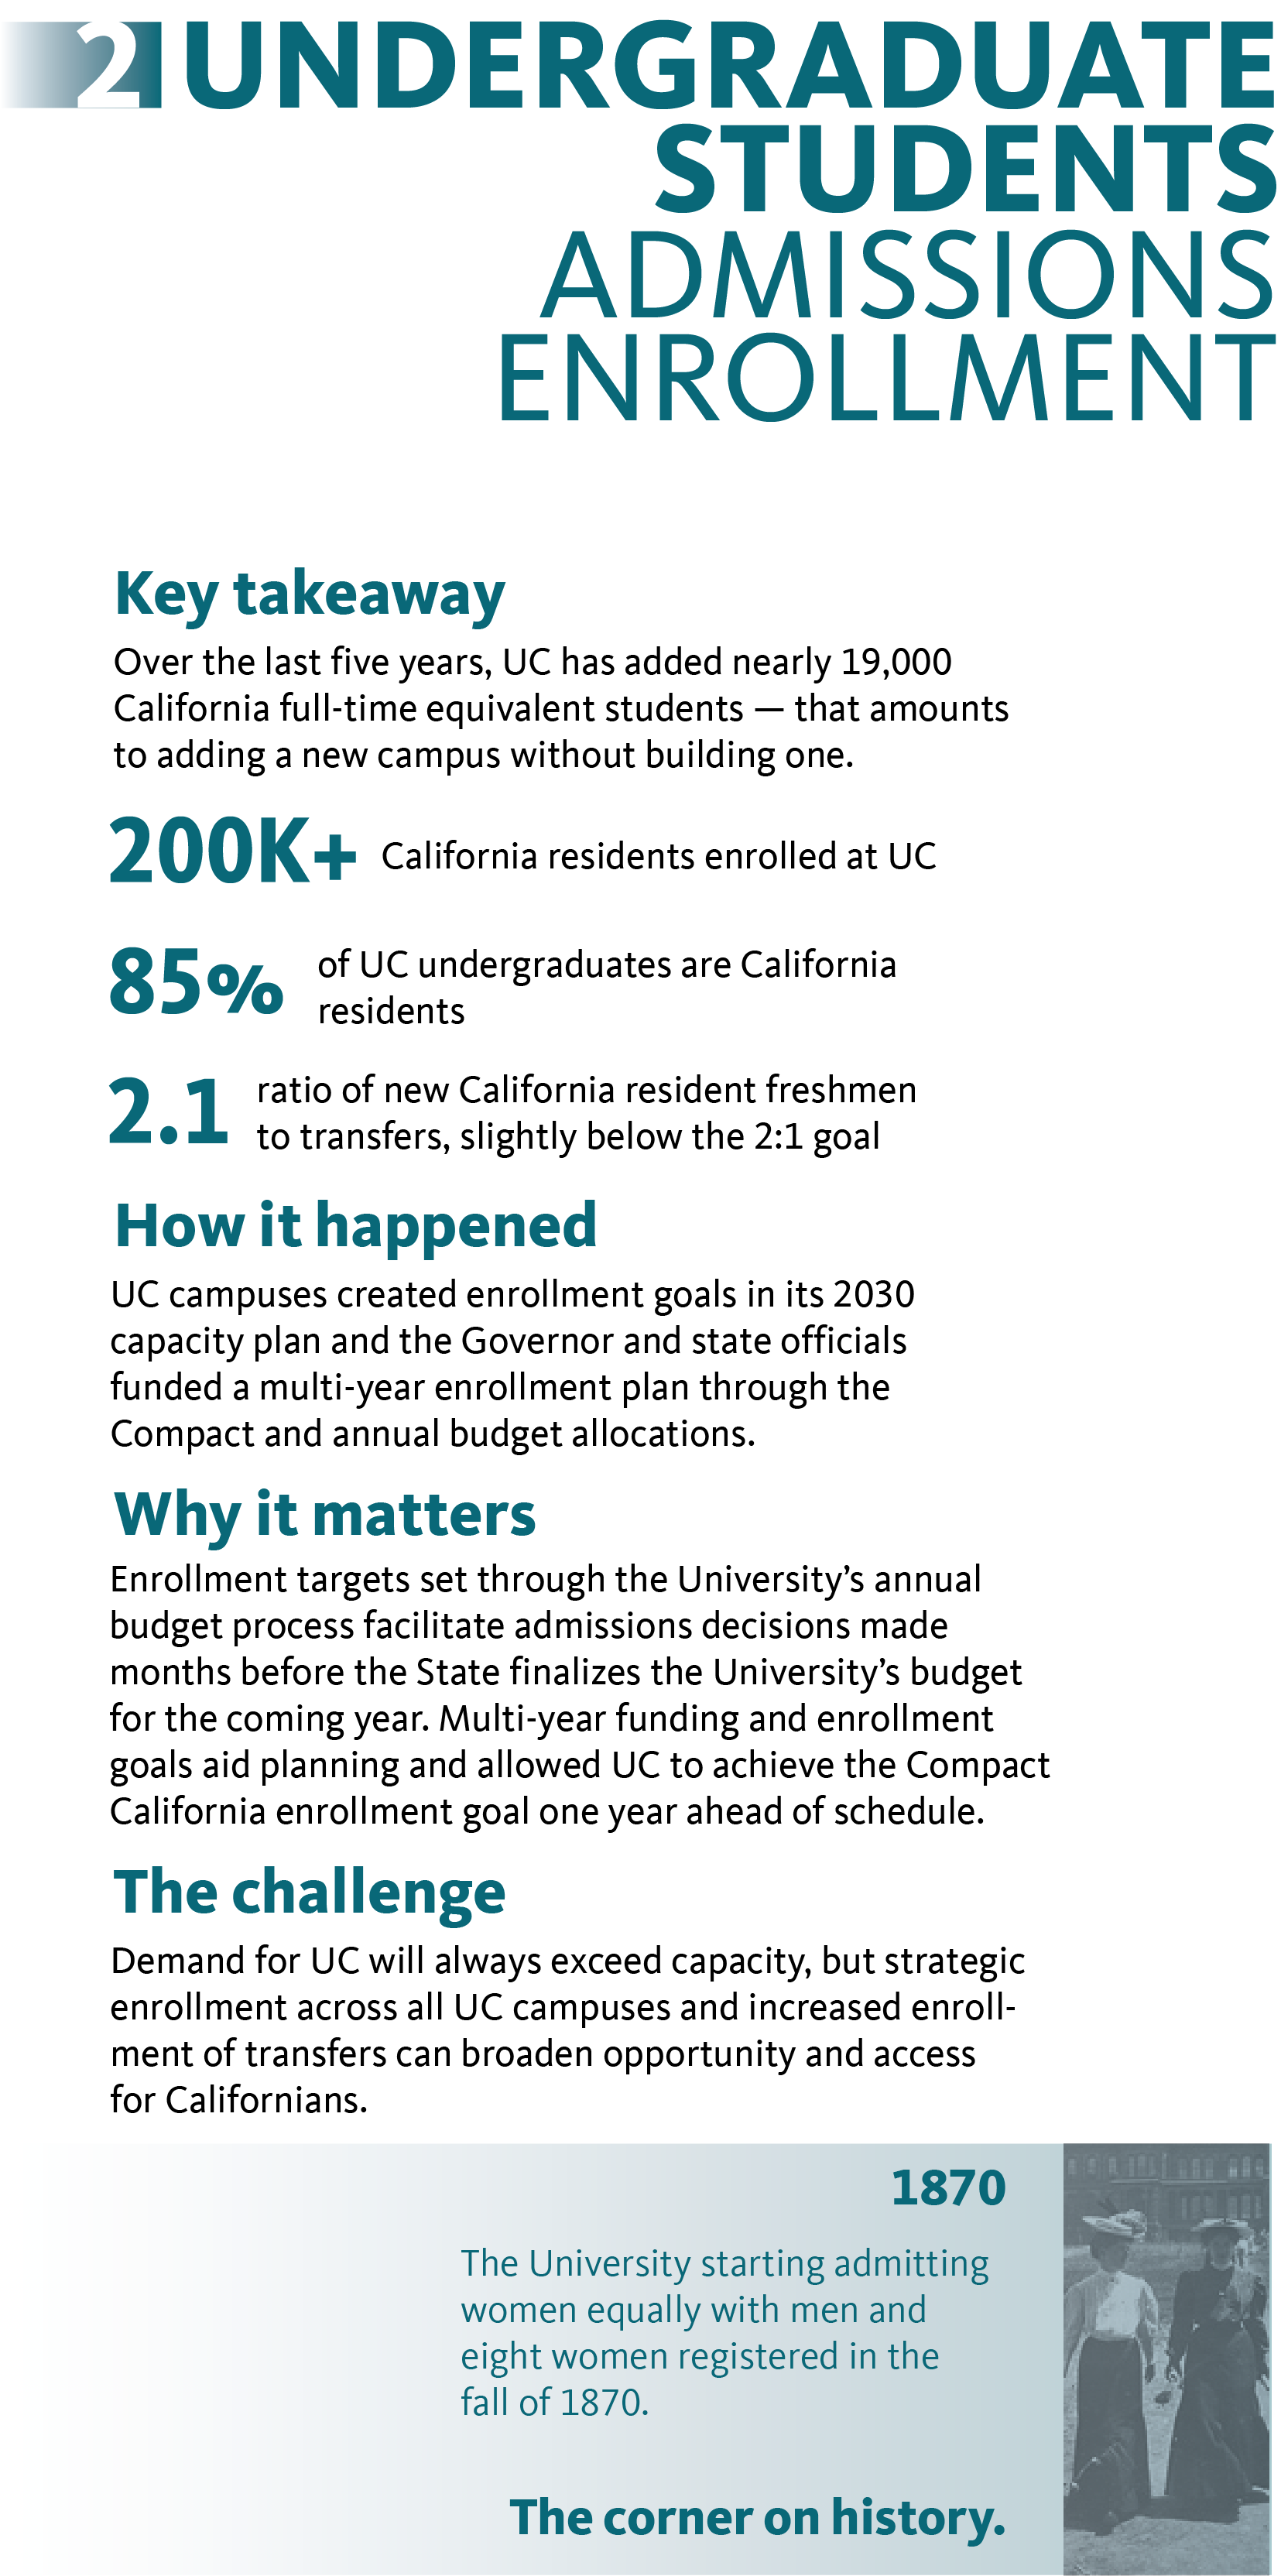
Key takeaways:
- Over the last five years, UC has added nearly 19,000 California full-time equivalent students — that amounts to adding a new campus without building one.
- UC enrolls more than 200,000 California resident students.
- Eighty-five percent of UC undergraduates are California residents.
- UC has a goal to have a 2 to 1 ratio of new California resident freshmen to transfers, the current ratio is slightly below 2:1.
How it happened:UC campuses created enrollment goals in its 2030 capacity plan, and the Governor and state officials funded a multi-year enrollment plan through the Compact and annual budget allocations.
Why it matters:Enrollment targets set through the University’s annual budget process facilitate admissions decisions made months before the State finalizes the University’s budget for the coming year. Multi-year funding and enrollment goals aid planning and allowed UC to achieve the Compact California enrollment goal one year ahead of schedule.
The Challenge:Demand for UC has always exceeded capacity, but strategic enrollment across all UC campuses and increased enrollment of transfers can broaden opportunity and access for Californians.
UC’s corner on history:In 1870, The University began admitting women equally with men and eight women registered in the fall of 1870.