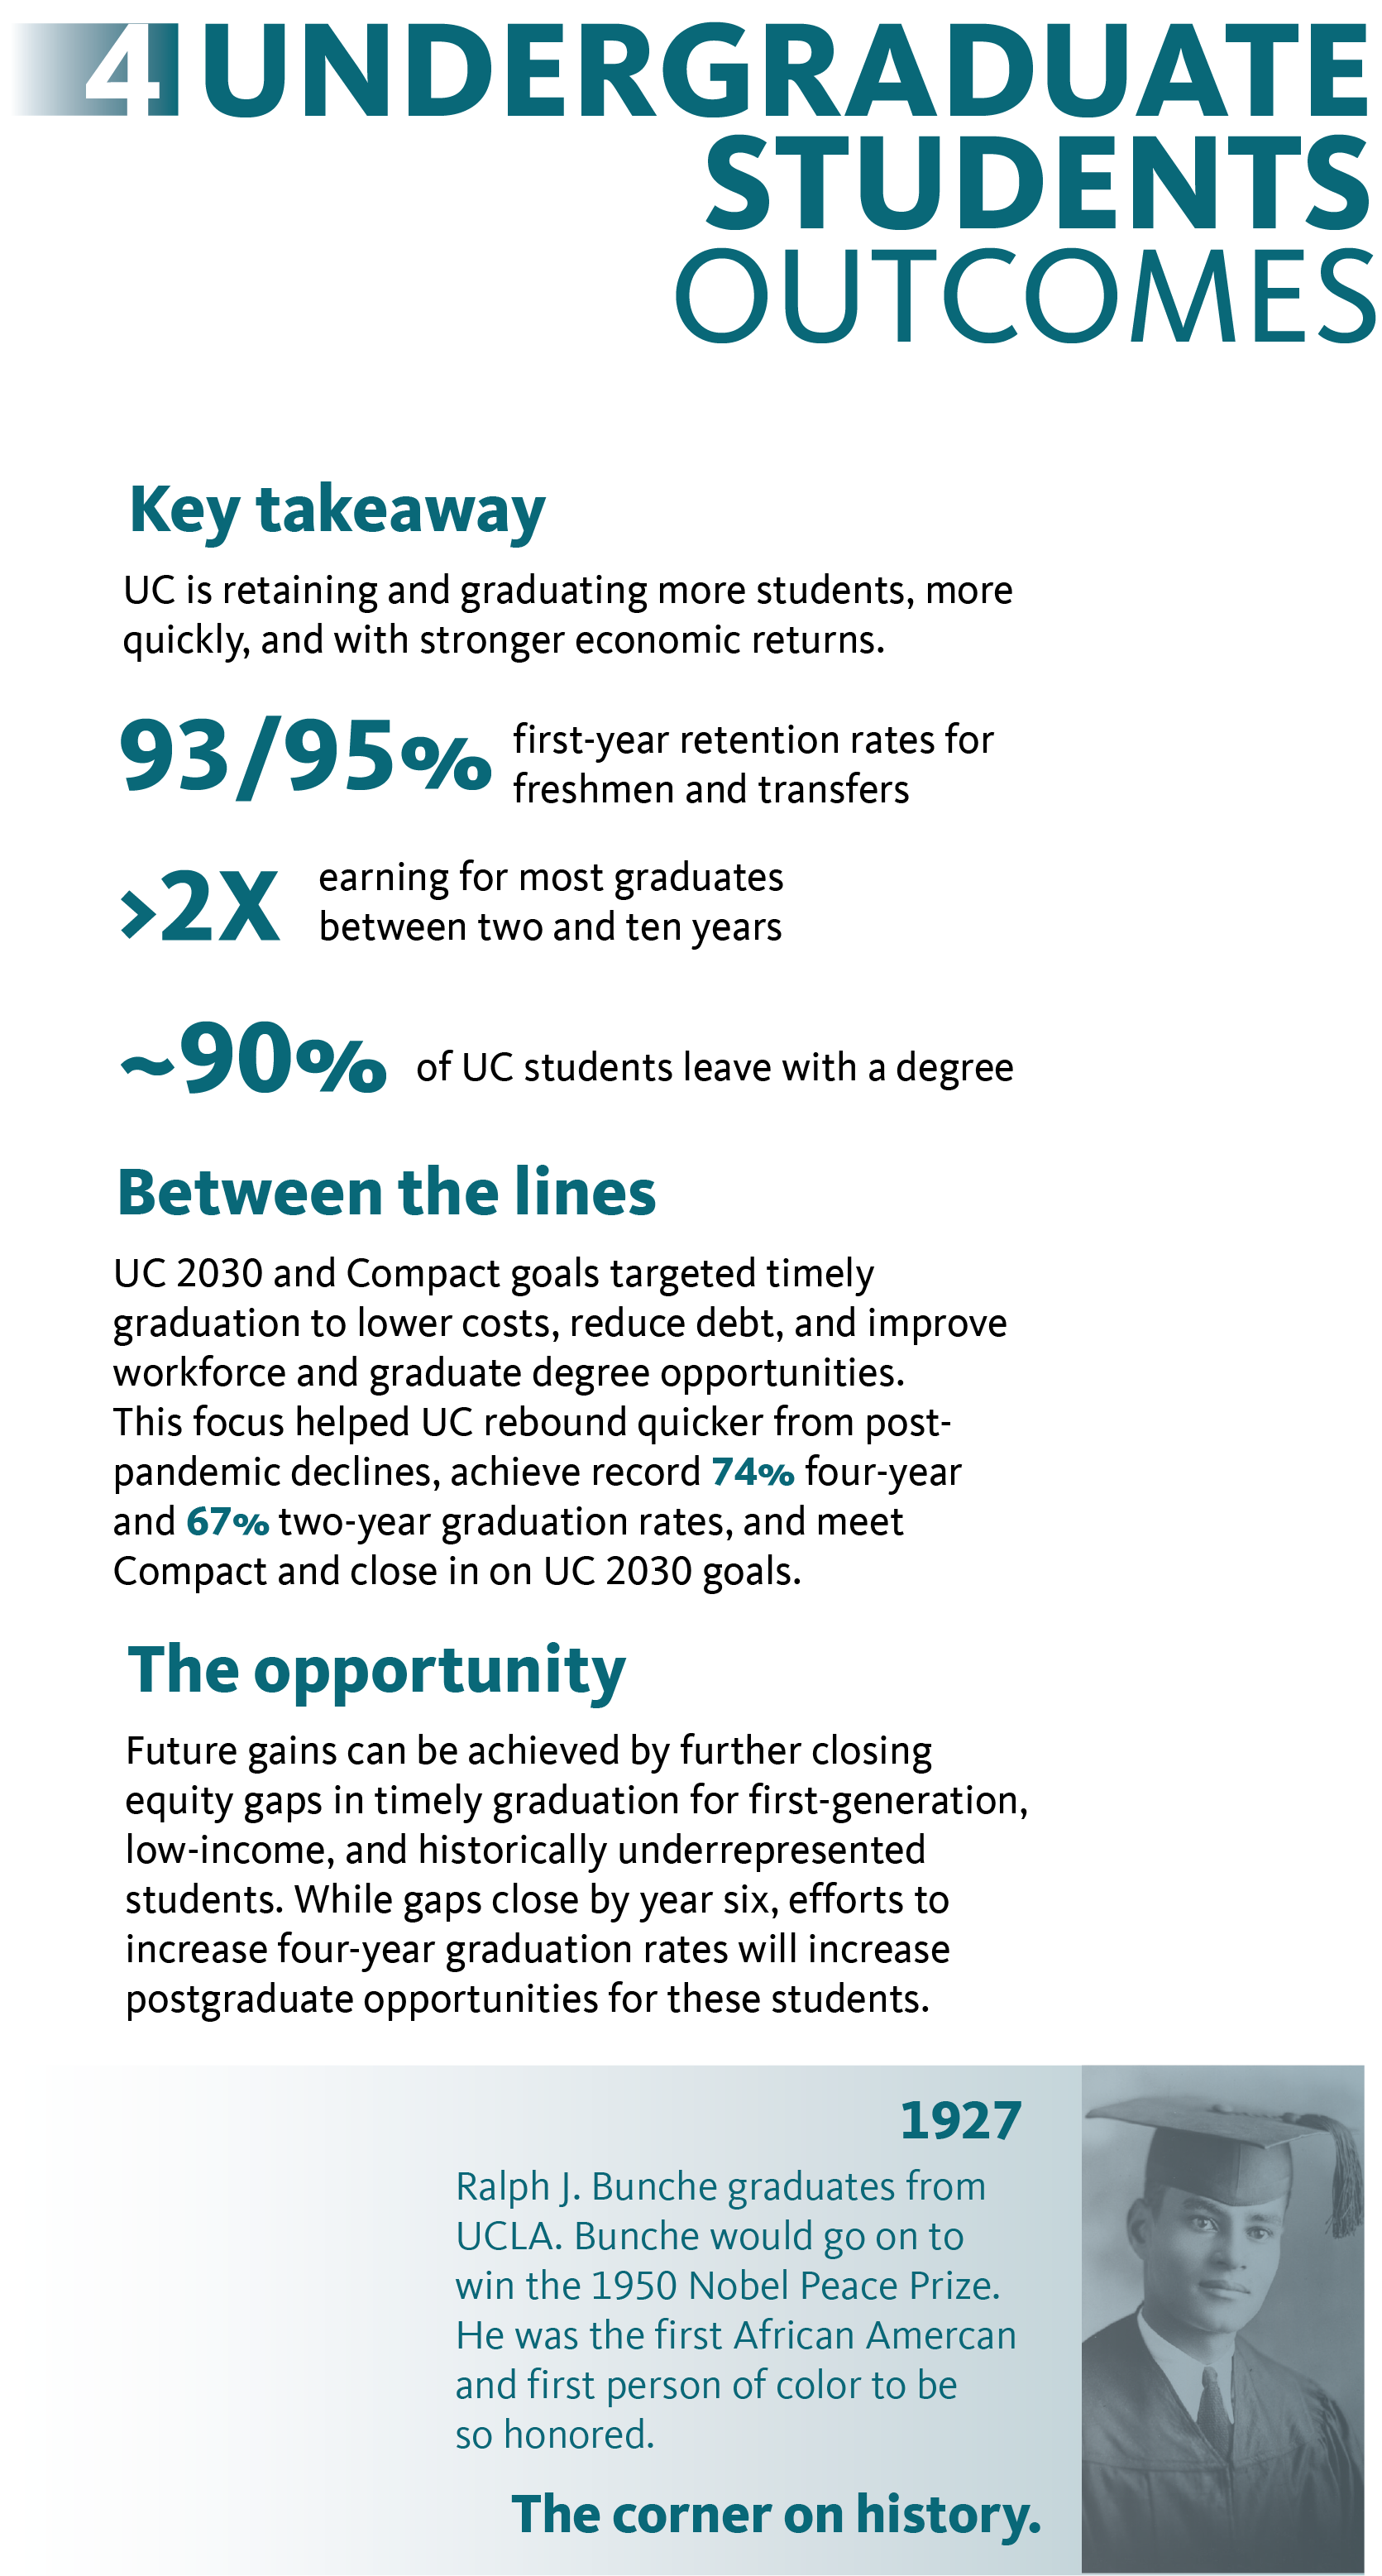
UC has met the 2025–26 Compact goal for the overall freshman four-year graduation rate and is within two percentage points of the 2030 goal, but four-year completion remains lower for first-generation students, Pell Grant recipients, and students from racial/ethnic groups historically underrepresented in higher education.
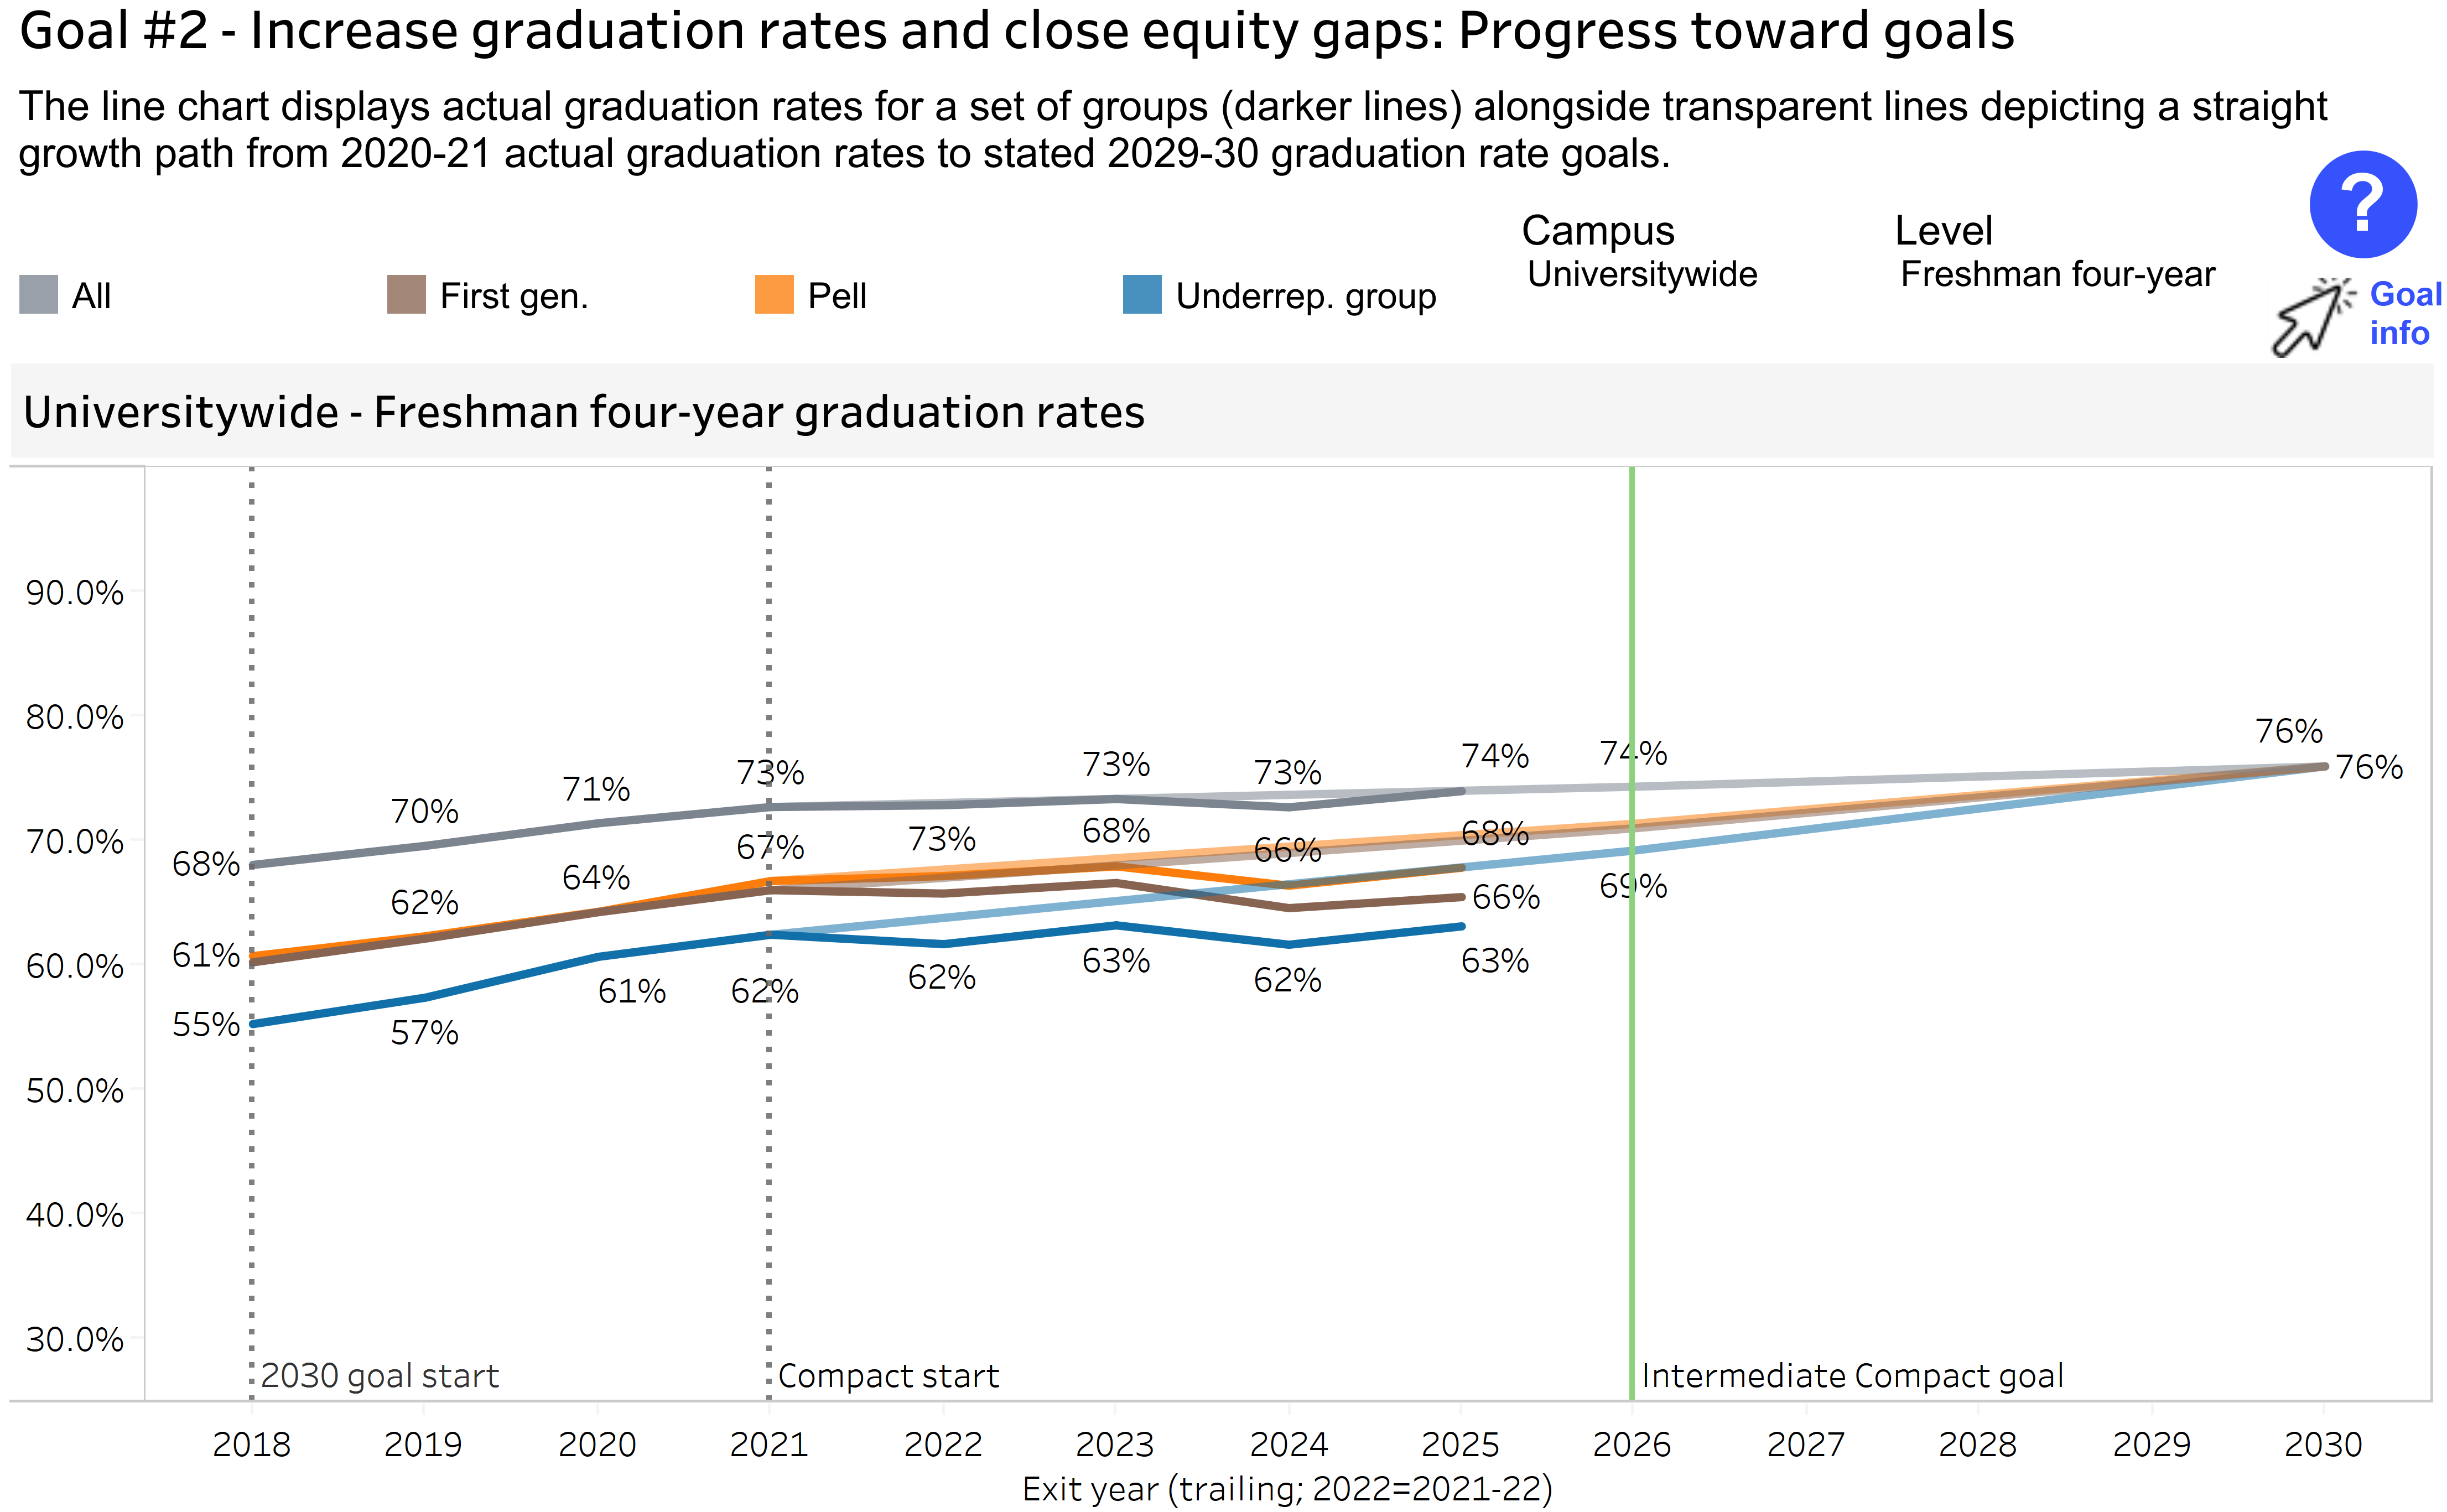
4.1.1 Freshman four-year graduation rates by student group and exit cohort year

UC 2030 dashboard | Goal #2 - progress
source: UC Information Center
For the 2025 exit cohort, the four-year rate reflects students who entered UC as freshmen in fall 2021, during the pandemic period. The overall freshman four-year graduation rate rose to 74 percent, showing continued progress toward the 2030 target.
UC freshmen are graduating at high rates and completing degrees increasingly close to the traditional four-year timeframe. However, four-year graduation rates remain lower for first-generation students, Pell Grant recipients, and students from racial/ethnic groups historically underrepresented in higher education than for freshmen overall. The remaining challenge is to sustain these gains while improving outcomes for students whose four-year completion rates remain below the overall freshman rate.
note: Exit cohort year refers to the academic year in which students completed their UC bachelor’s degree, labeled by the trailing calendar year. For example, the 2022 exit cohort refers to the 2021–22 graduating cohort. The first two indicators in this section use exit cohorts to show the most recent UC 2030 Dashboard results for four- and six-year freshman graduation; the remaining indicators use entering cohorts.
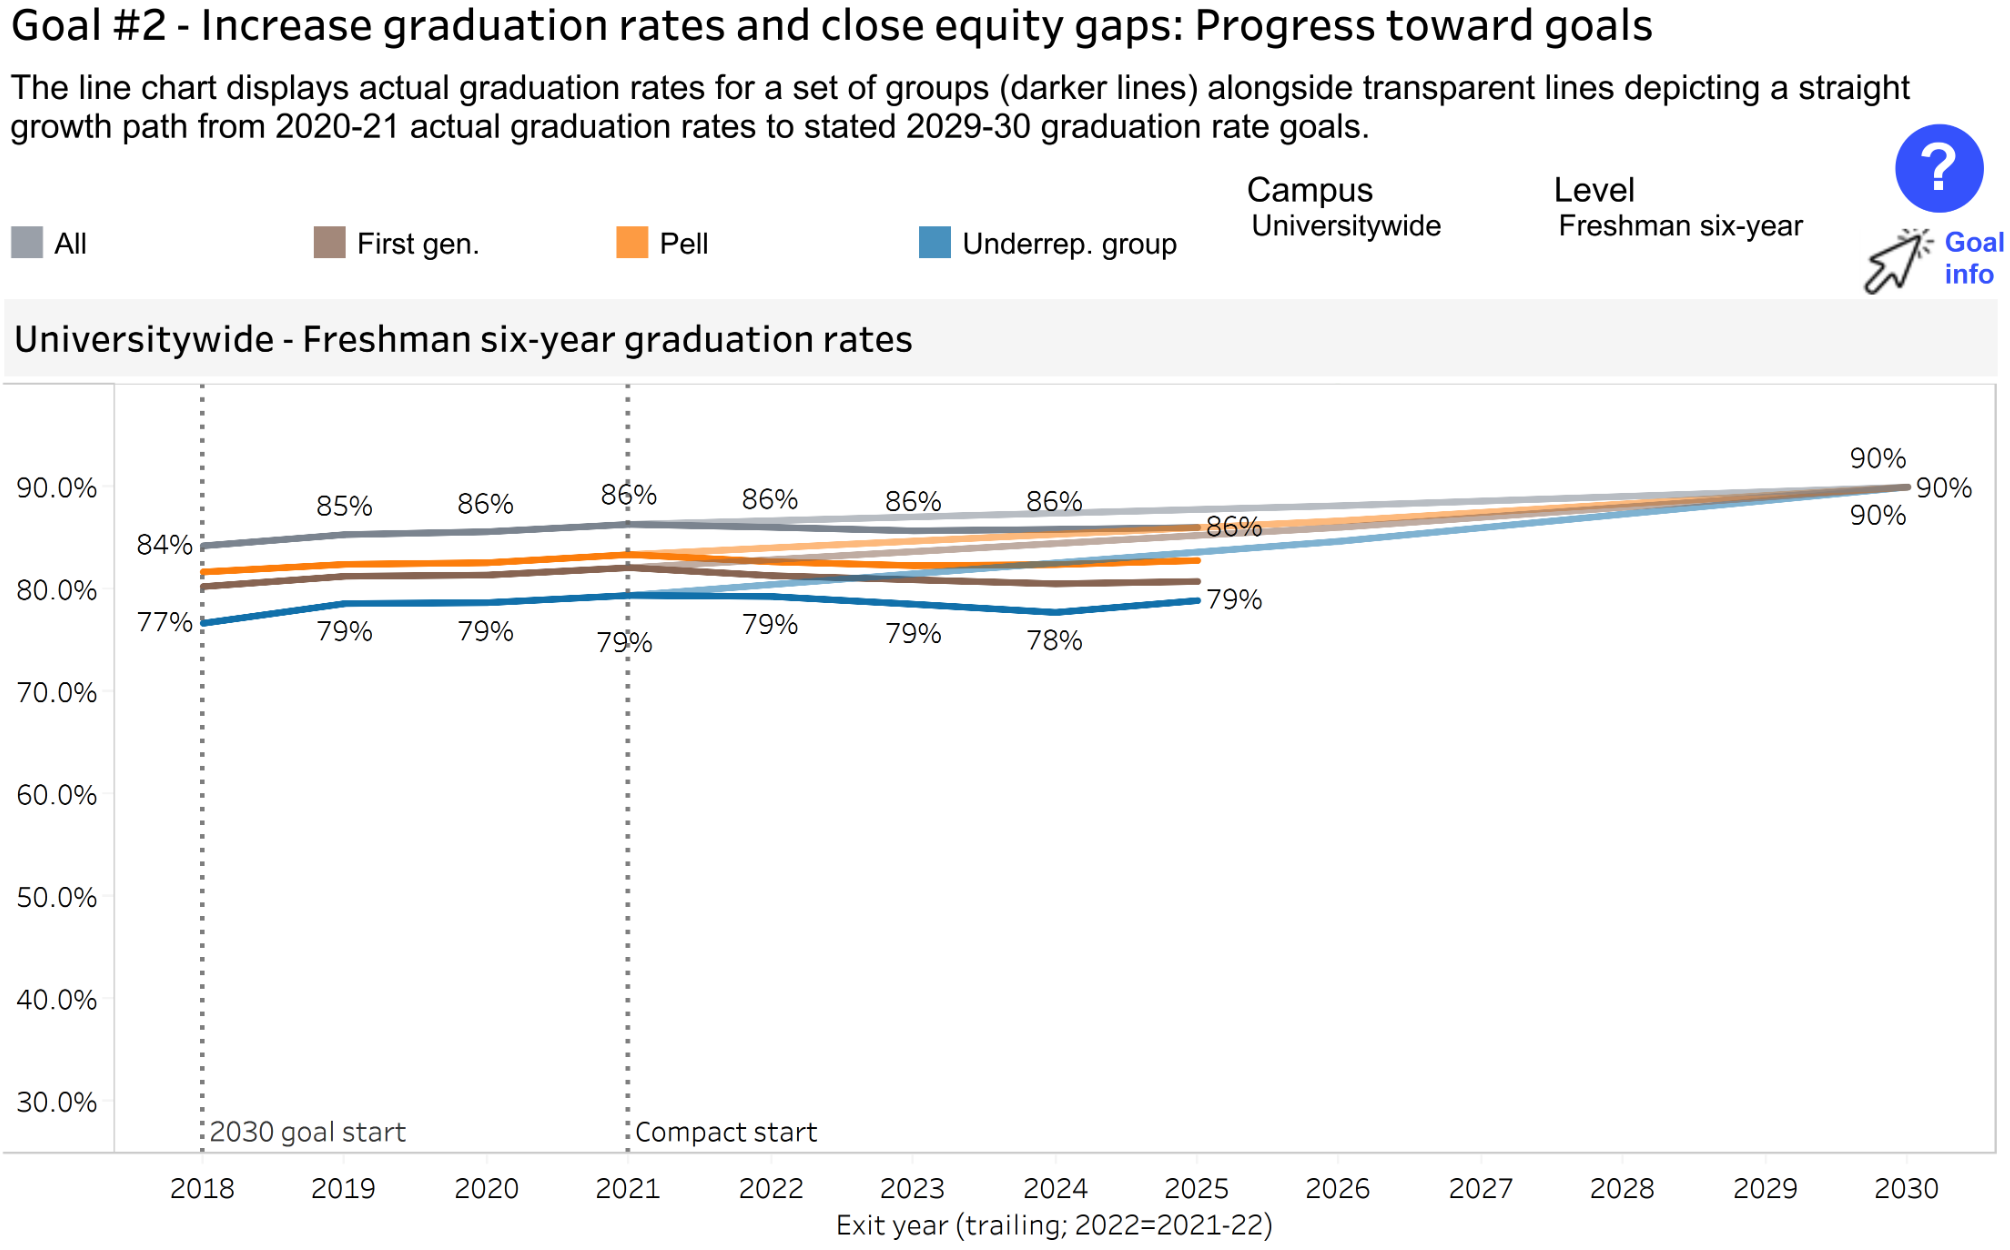
UC’s freshman six-year graduation rate remains close to the 2030 goal. Rates for first-generation, Pell Grant, and historically underrepresented students also improved from the prior year, though each remains below the overall freshman rate.
4.1.2 Freshman six-year graduation rates by student group and exit cohort year
UC 2030 dashboard | Goal #2 Progress
source: UC Information Center
UC’s 2030 goal is for 90 percent of freshmen to graduate within six years. For the 2025 exit cohort, the six-year rate reflects students who entered UC as freshmen in fall 2019, before the pandemic period, though they were enrolled when pandemic disruptions began. The current freshman six-year graduation rate is 86 percent, within four percentage points of the goal, after increasing from the prior exit cohort. Together with the four-year result, this shows strong freshman completion and continued progress toward UC’s 2030 goals.
Six-year graduation rates also improved for first-generation students, Pell Grant recipients, and students from racial/ethnic groups historically underrepresented in higher education, but remain below the overall freshman rate. Continued progress toward the six-year goal will require raising the systemwide rate while improving outcomes for these student groups.
Freshman graduation rates continue to approach UC’s 2030 goals, but first-generation, Pell Grant, and historically underrepresented students remain less likely to graduate within four years.
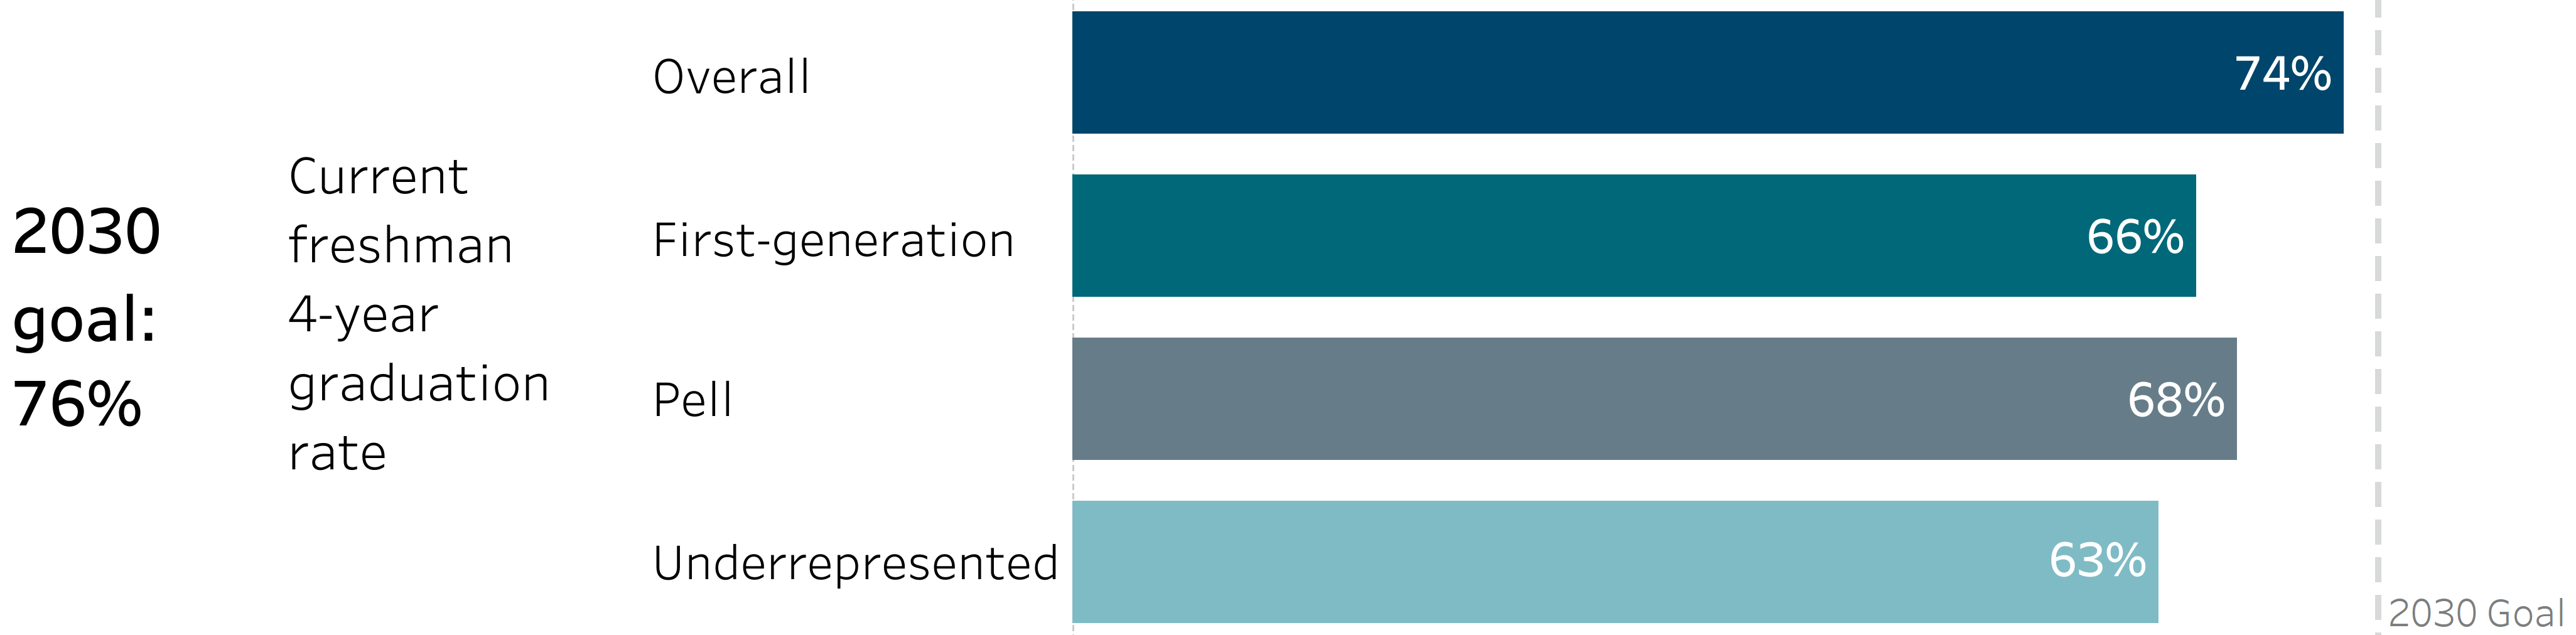
4.1.3 Overall freshman graduation rates by student group, fall 2021 and fall 2019 entering cohort
Undergraduate graduation rates dashboard
source: UC Information Center
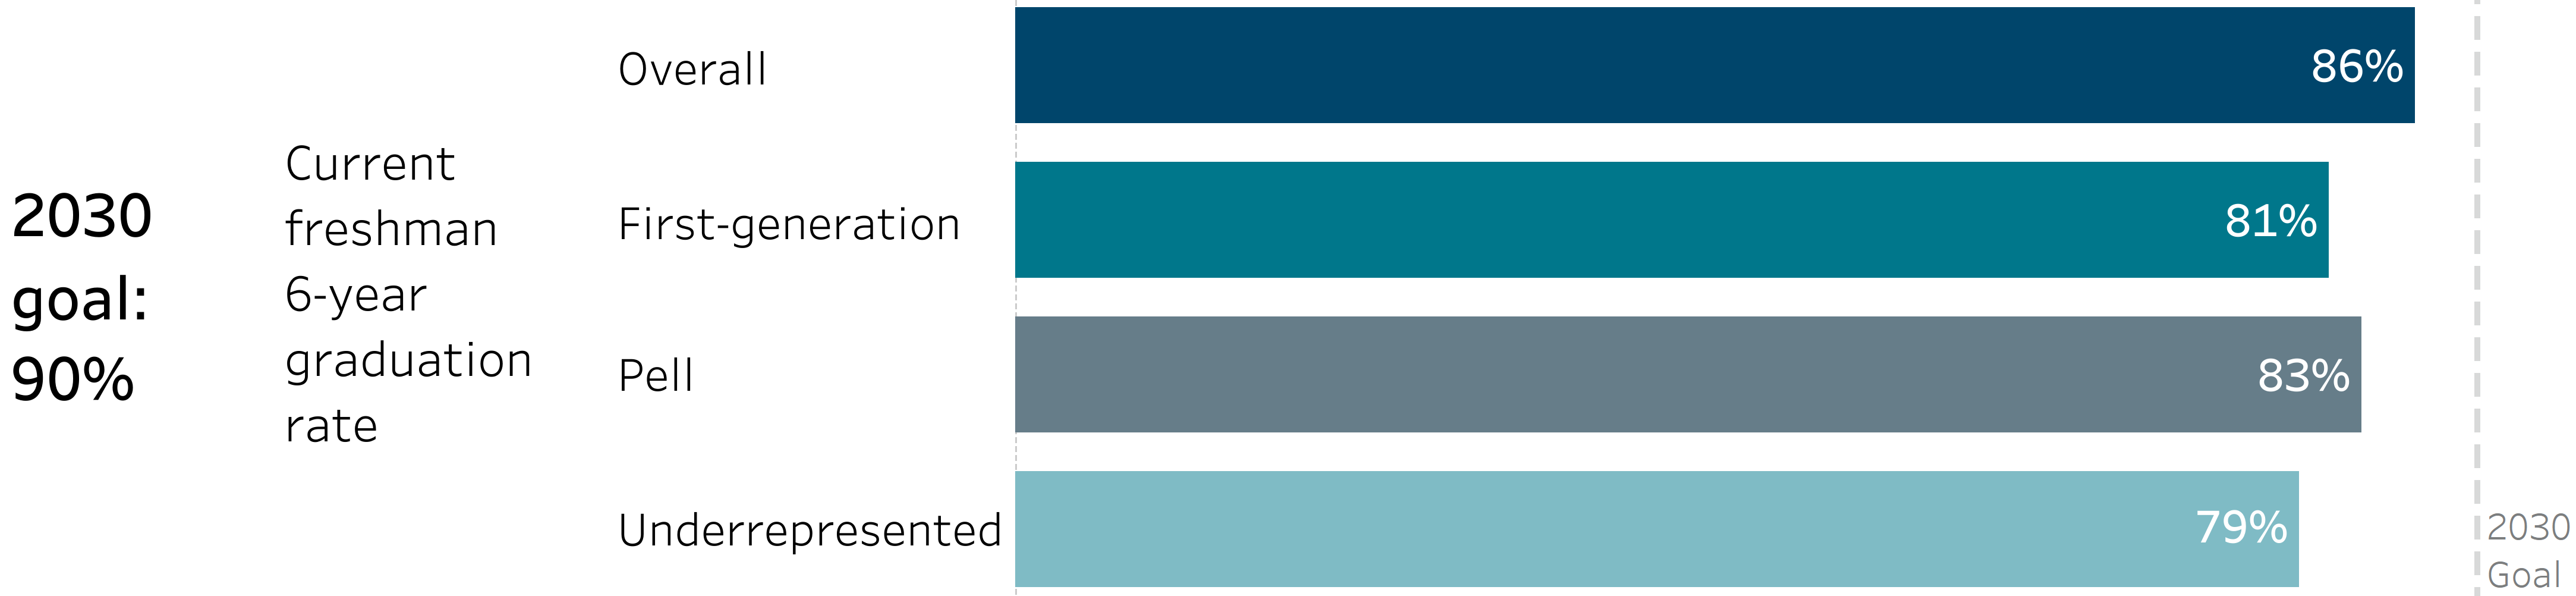
UC freshmen graduate at high rates, with current four-year and six-year graduation rates within a few percentage points of UC’s 2030 goals. The current four-year graduation rate for freshmen is 74 percent, two percentage points below the 2030 goal of 76 percent. The current six-year graduation rate is 86 percent, four percentage points below the 2030 goal of 90 percent.
Graduation rates are lower for first-generation students, Pell Grant recipients, and students from racial/ethnic groups historically underrepresented in higher education, including African American, American Indian, and Hispanic/Latino(a) students. The largest opportunity for improvement is in four-year graduation: 66 percent of first-generation students, 68 percent of Pell Grant recipients, and 63 percent of historically underrepresented students graduate within four years, compared with 74 percent of freshmen overall. Six-year graduation rates are higher across all groups, but these student groups remain below the overall freshman rate: 81 percent of first-generation students, 83 percent of Pell Grant recipients, and 79 percent of historically underrepresented students graduate within six years, compared with 86 percent overall.
UC is nearing its systemwide 2030 goals, but further progress depends on improving outcomes for student groups whose graduation rates remain below the overall freshman rate, especially for timely four-year completion.
note: Entering cohort year refers to the fall term in which students entered UC. For example, the 2018 entering cohort includes students who entered in fall 2018. The remaining indicators in this section use entering cohorts rather than exit cohorts to show how freshman graduation, time to degree, GPA, and retention patterns vary across cohorts and student groups.
UC freshmen are completing their degrees faster than earlier cohorts, bringing average time to degree close to four years.
4.1.4 Freshman average time to degree by entering cohort
Undergraduate graduation rates dashboard | Graduation rates
source: UC Information Center
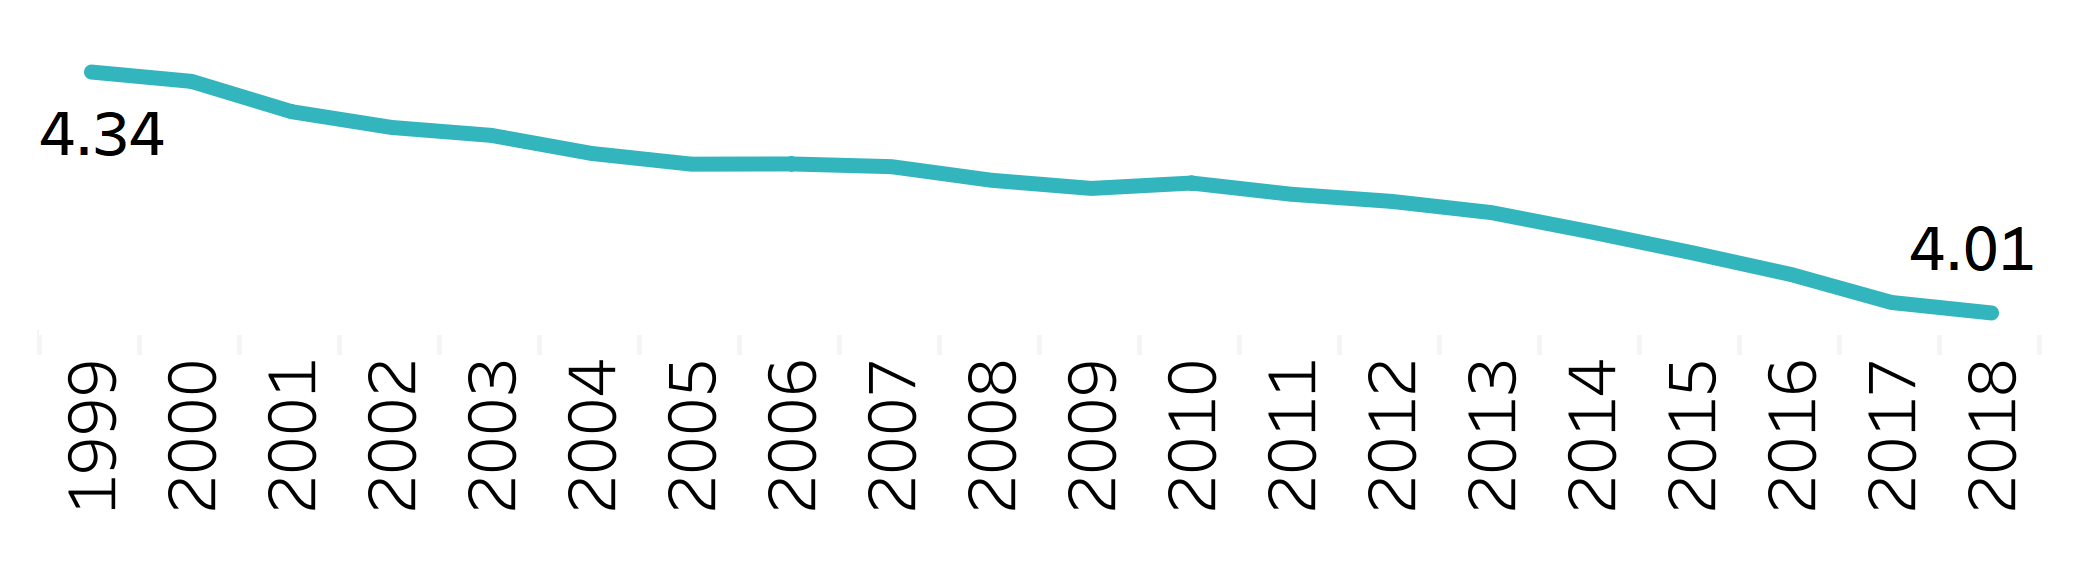
The average time to earn a bachelor’s degree at UC has decreased steadily since 1999. Students in the fall 2018 freshman entering cohort, which entered before the pandemic period, took an average of 4.01 years to complete their degree, down from 4.34 years for the 1999 entering cohort. This represents a decline of about one-third of a year, or nearly four months.
note: Average time to degree only includes students who graduated from UC within seven years.
More freshmen complete UC degrees in three years, especially students who enter with substantial pre-UC credit or complete summer coursework.
4.1.5 Freshman three-year graduation rates by entering cohort, 1999 to 2022
Freshman three-year graduation rates dashboard | Three-year graduation rates
source: UC Information Center
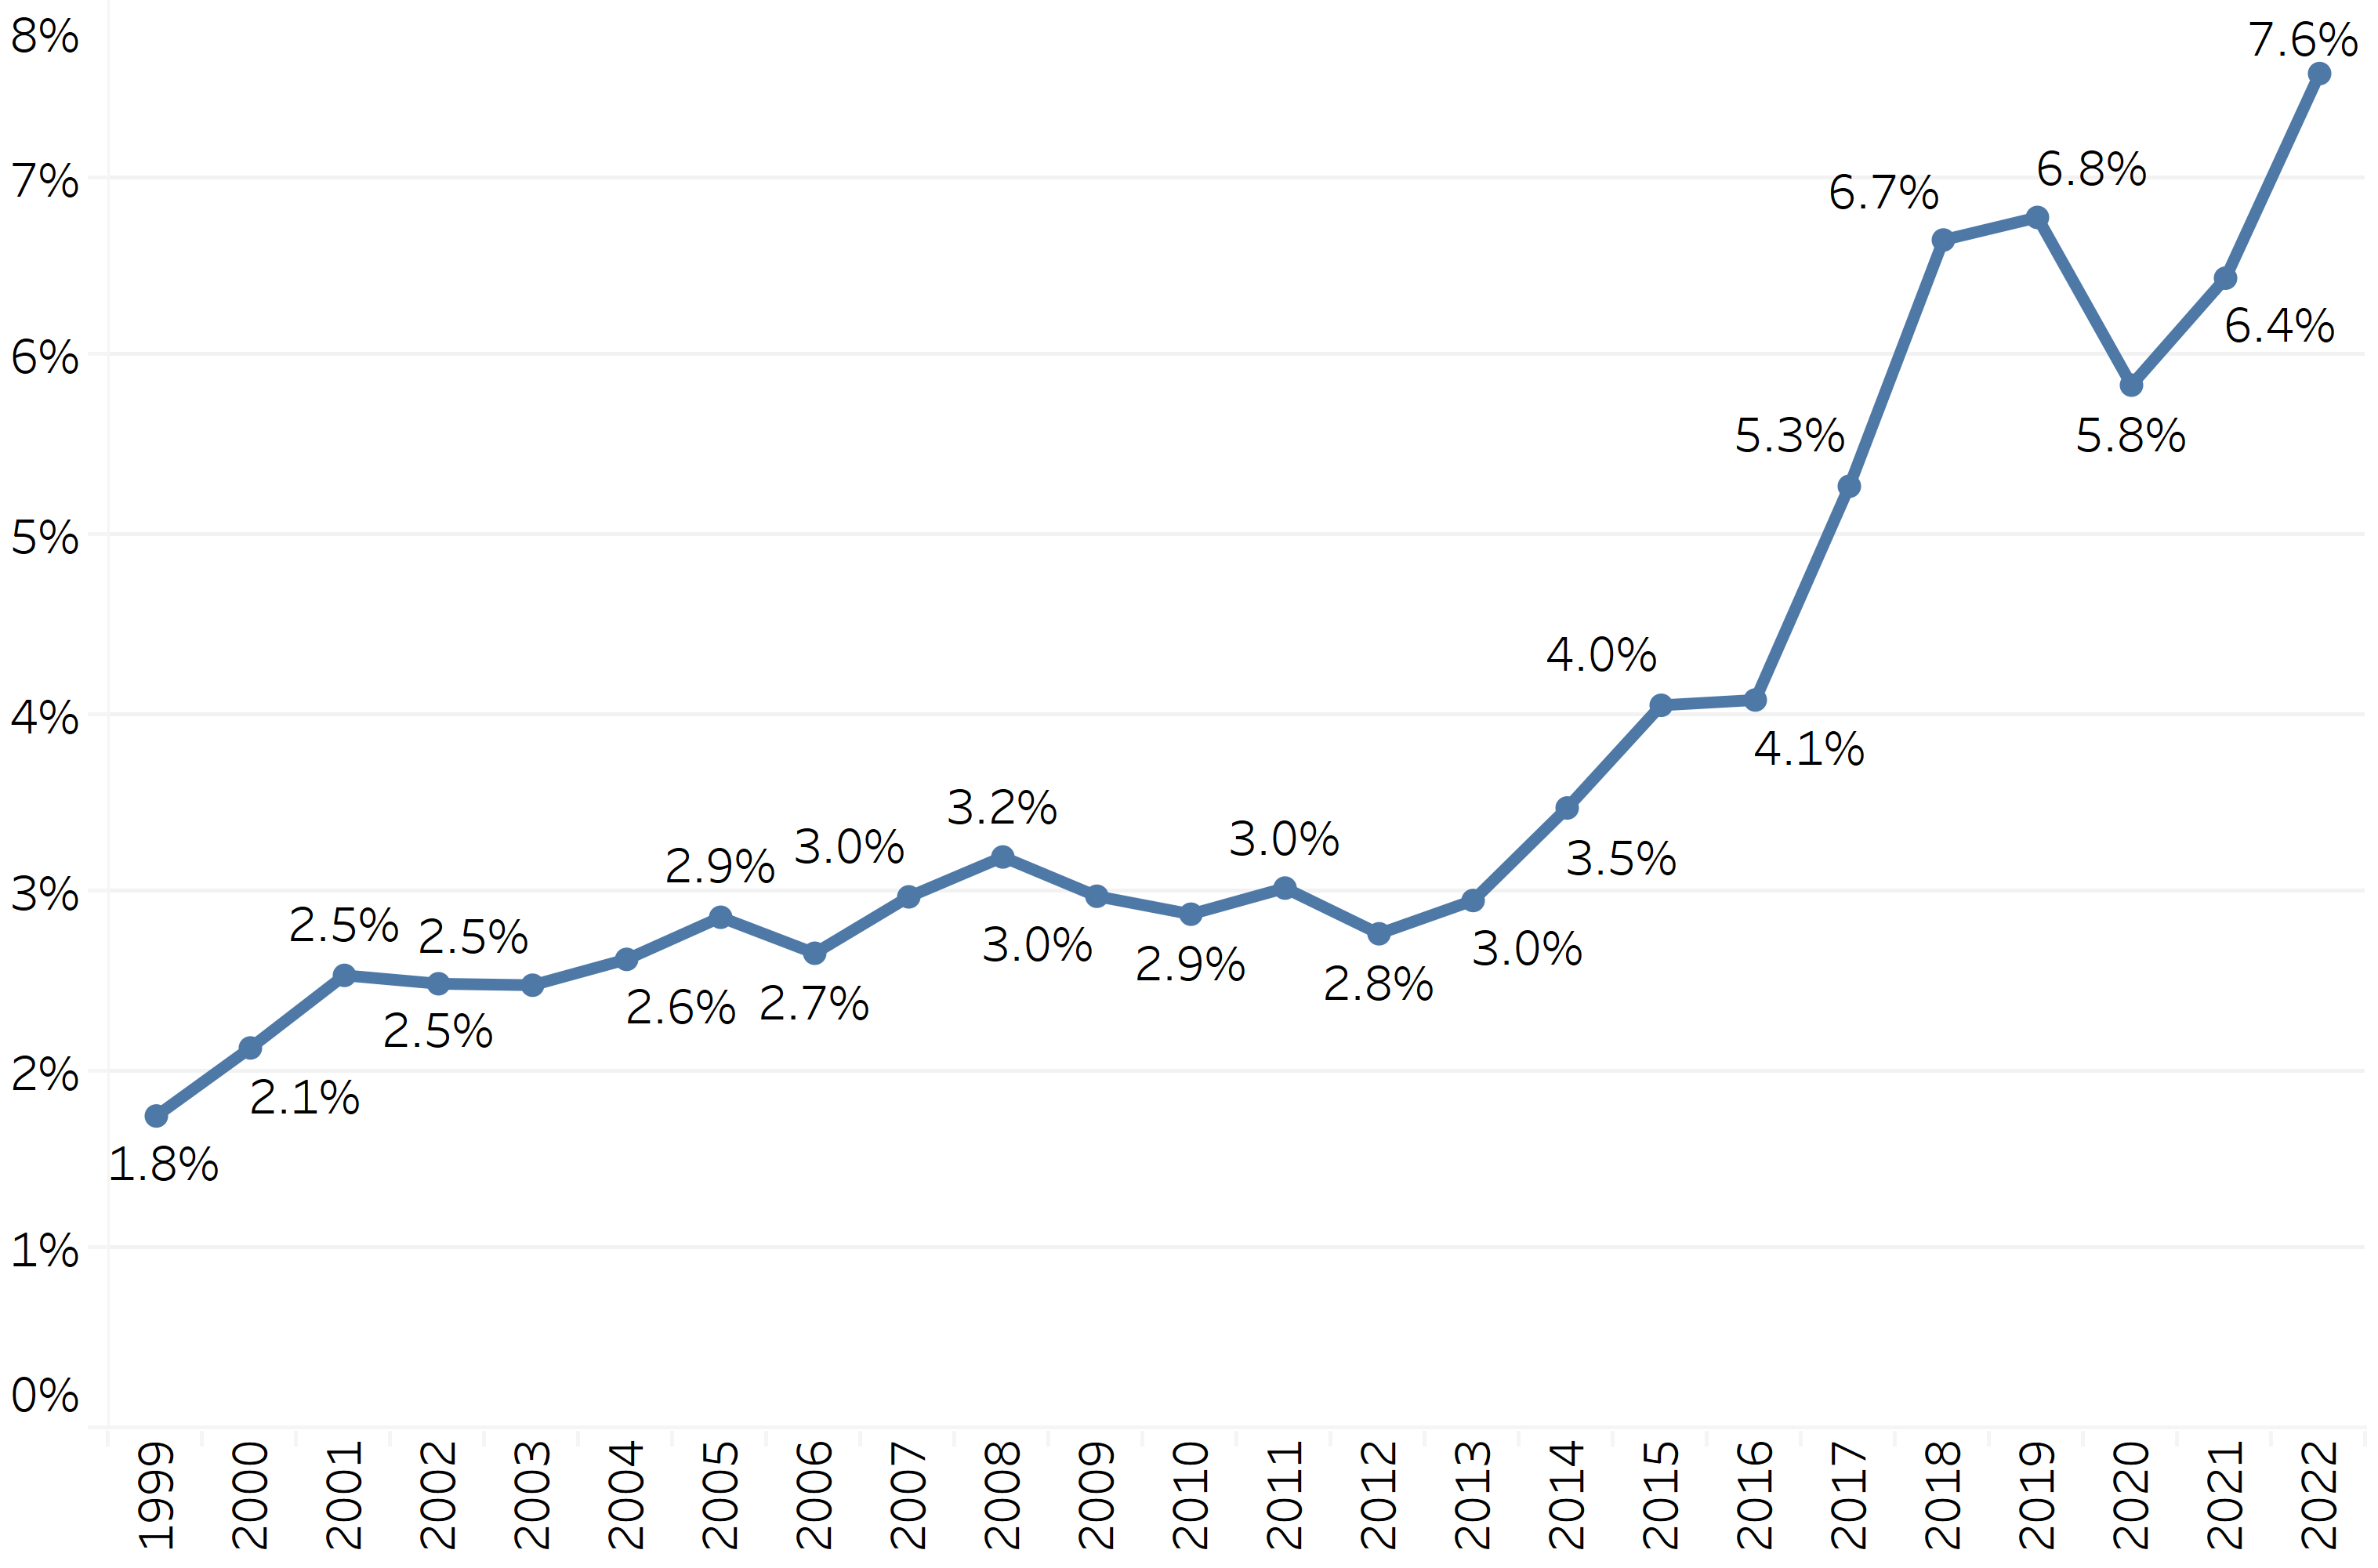
Three-year graduation remains less common than four-year or six-year completion, but it has increased substantially over time. The three-year graduation rate rose from 1.8 percent for the fall 1999 entering cohort to 7.6 percent for the fall 2022 entering cohort, which entered during the pandemic period.
Three-year completion is more common among freshmen who enter UC with substantial pre-UC credit or who complete more summer coursework after enrolling. Nearly 18 percent of students with more than 40 pre-UC units from AP and IB exams, honors courses, or college-level classes earned a bachelor’s degree within three years, compared with fewer than two percent of students without pre-UC units and about three percent of those with ten or fewer. Summer enrollment shows a similar pattern: nearly 20 percent of students who completed ten or more summer units graduated within three years, compared with less than seven percent of those who completed fewer than four. These patterns suggest that credits earned before and during UC enrollment play a key role in allowing students to graduate in three years.
UC freshmen graduate at higher rates than AAU public peers, demonstrating strong performance among public research universities.
4.1.6 Freshman graduation rates, UC and comparison institutions, cohorts entering fall 2019, 2020 and 2021; fall 2018 cohort for AAU comparison
sources: UC Data Warehouse and IPEDS
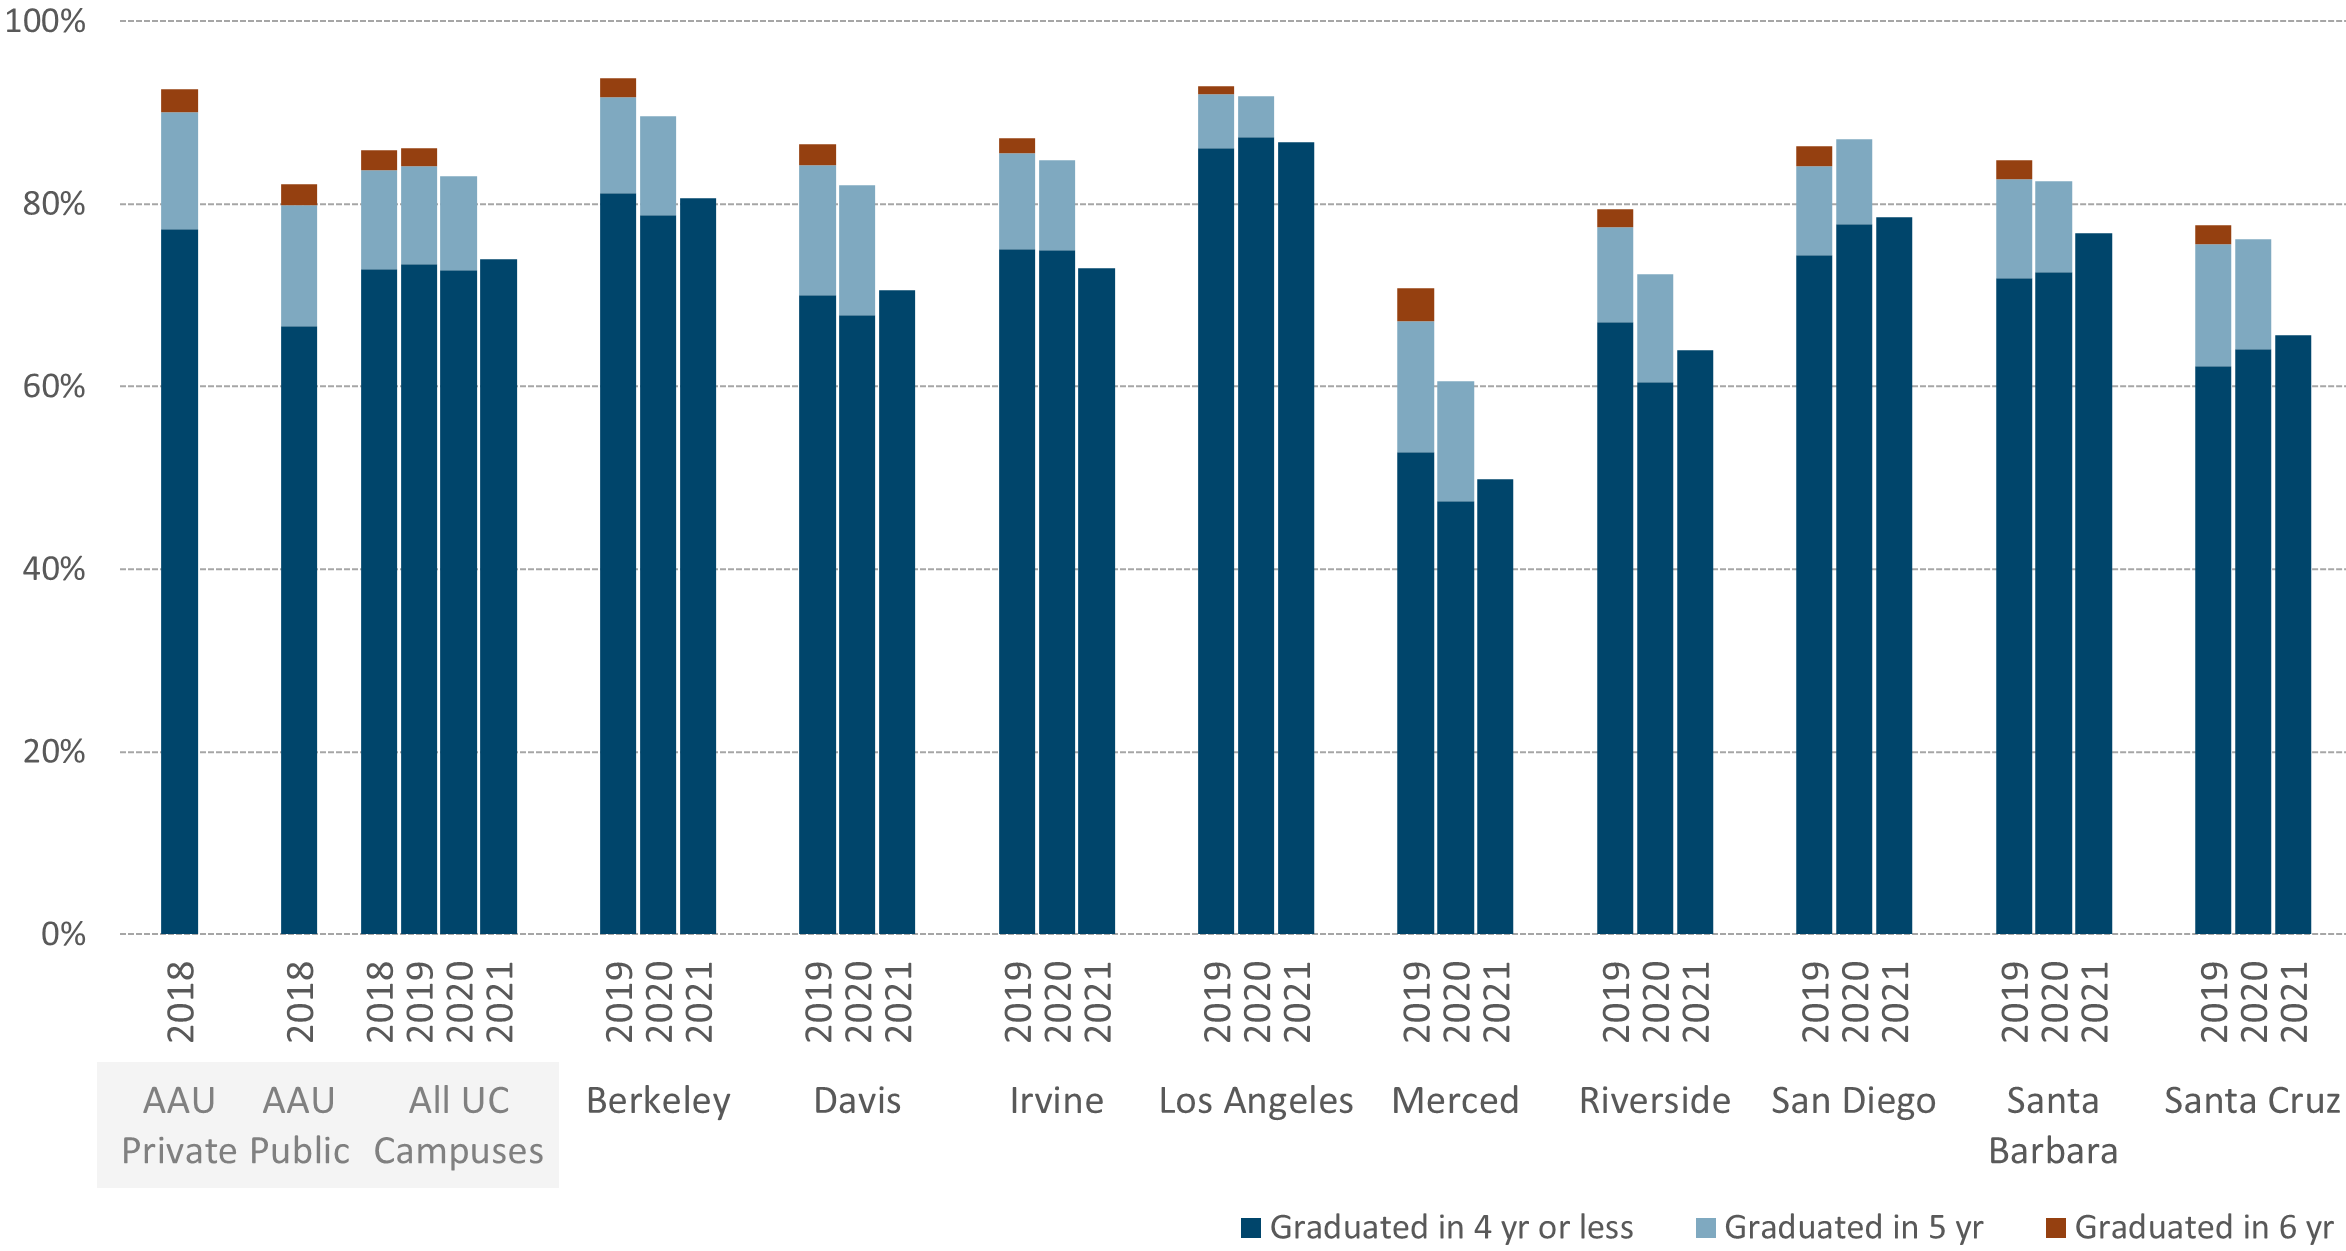
UC freshman graduation rates compare favorably with those of AAU public institutions. UC’s latest four-year rate reflects the fall 2021 entering cohort, which entered during the pandemic period, while UC’s latest six-year rate reflects the fall 2019 entering cohort, which entered before the pandemic period. The most recent AAU comparison data are for the fall 2018 entering cohort, which also entered before the pandemic period. UC’s rates remain below those of AAU private institutions, but the comparison shows that UC performs strongly among public research universities.
Graduation rates vary across UC campuses, but the systemwide pattern shows strong overall completion and continued progress toward timely graduation. The comparison also reinforces the importance of UC’s ongoing work to improve advising, course access, degree pathways, and academic support, with particular attention to improving outcomes for first-generation students, Pell Grant recipients, and students from racial/ethnic groups historically underrepresented in higher education.
note: Comparison IPEDS data are available for more limited years. The AAU comparison institutions are in the data glossary. AAU comparison is for the 2018 cohort, the most recent data available. Graduation rates are weighted by total cohort size. Institutions with missing data are excluded for that year. Freshmen are those students who entered a university directly from high school and who have not matriculated at another postsecondary institution prior to enrollment. UC statistics give credit to the originating campus for inter-UC campus transfers.
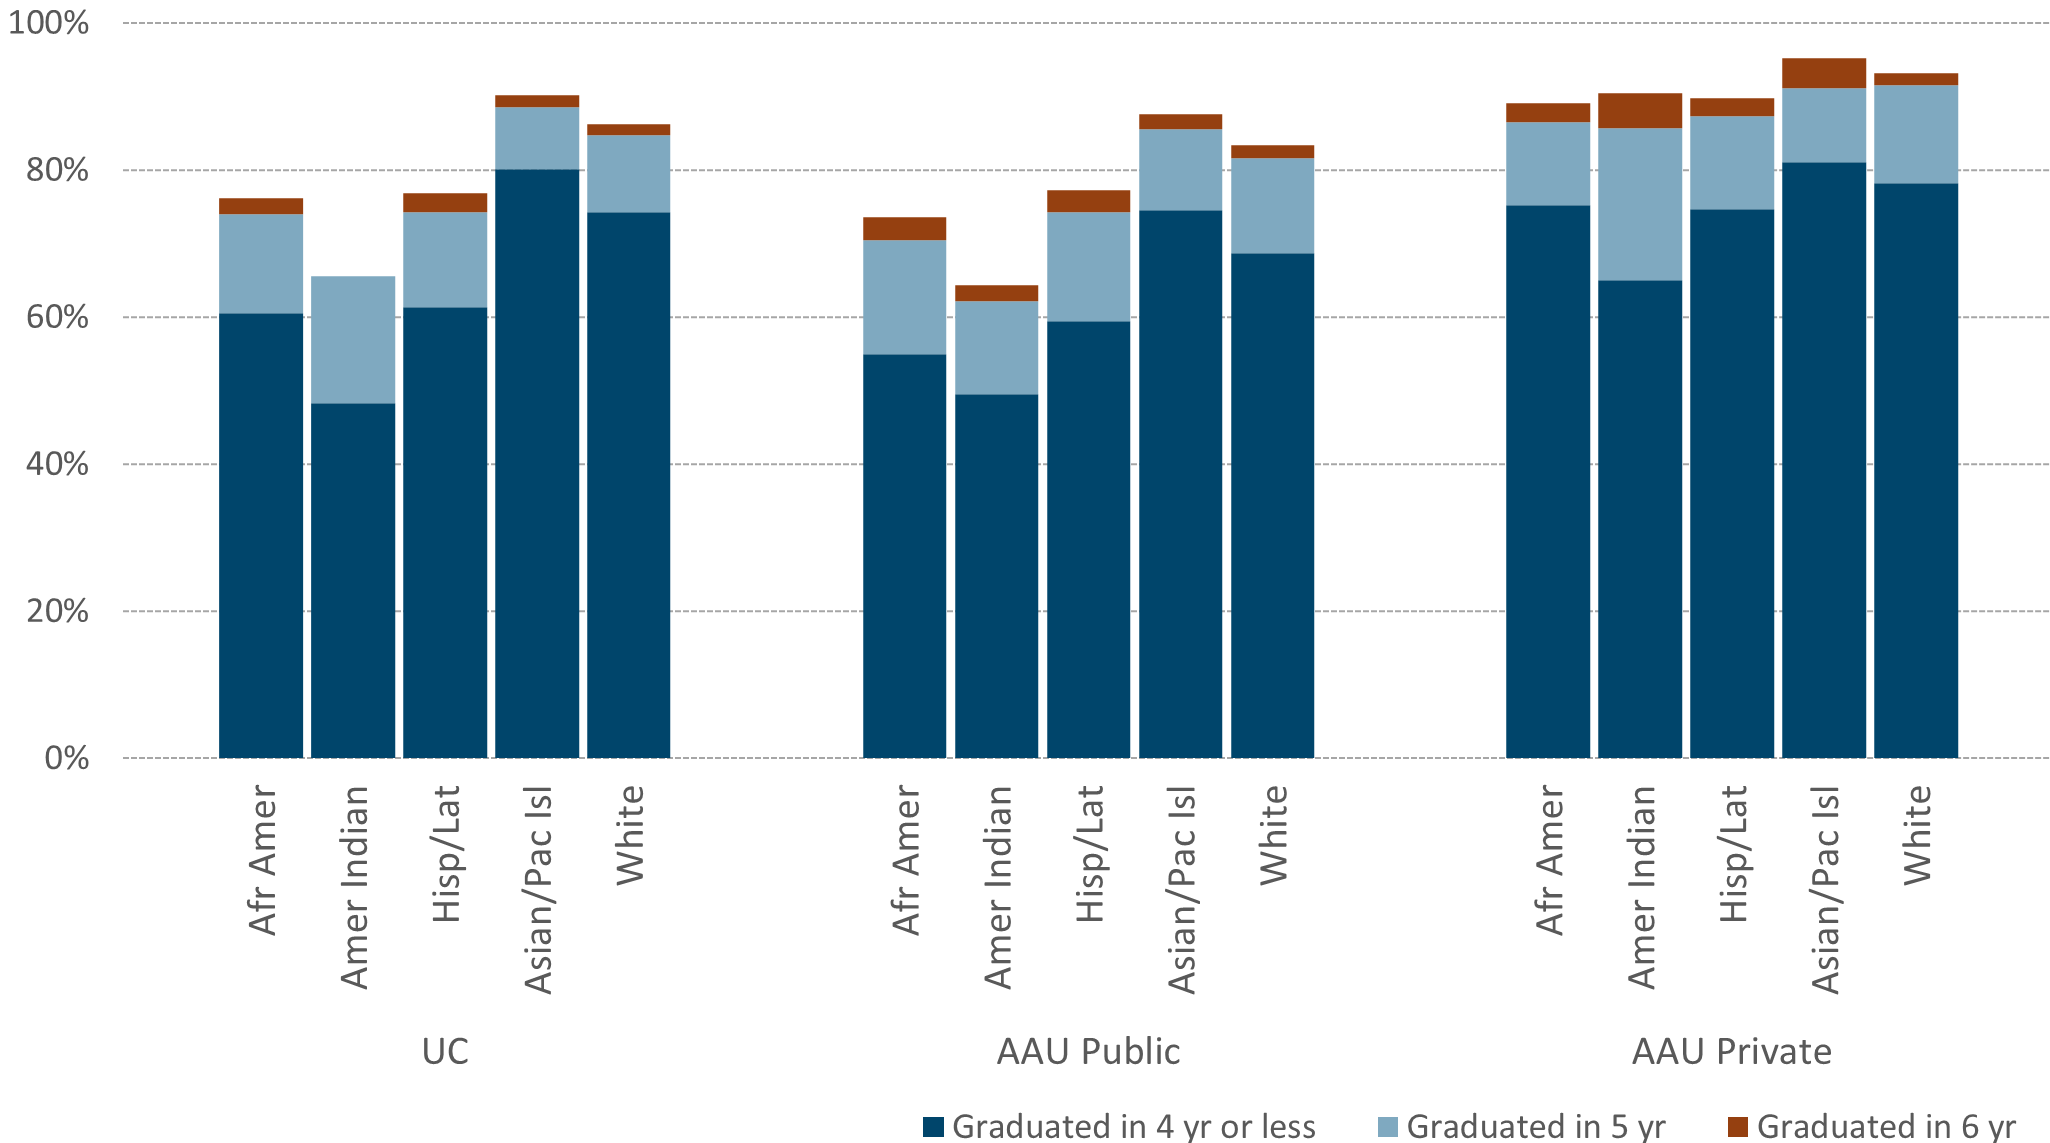
UC freshmen graduate at higher rates than AAU public peers within each racial/ethnic group shown, but timely graduation still varies across groups within UC.
4.1.7 Freshman graduation rates by race/ethnicity, UC and AAU comparison institutions, fall 2018 entering cohort
sources: UC Data Warehouse and IPEDS
For the fall 2018 entering cohort, which entered before the pandemic period, UC’s freshman graduation rates compare favorably with those of AAU public institutions across all racial/ethnic groups shown. Specifically, UC’s four- and six-year graduation rates for African American, American Indian, Hispanic/Latino(a), Asian/Pacific Islander, and White students are higher than the corresponding rates at AAU public institutions. AAU private institutions generally have higher graduation rates than both UC and AAU public institutions across groups.
Despite UC’s stronger performance compared with AAU public institutions, graduation rates differ across racial/ethnic groups within UC. Asian/Pacific Islander and White freshmen have the highest graduation rates, while African American, American Indian, and Hispanic/Latino(a) freshmen graduate at lower rates. These differences are especially visible in four-year graduation rates, reinforcing the earlier finding that timely completion remains the central area for improvement in freshman graduation outcomes. The next section examines how high school GPA relates to these graduation patterns.
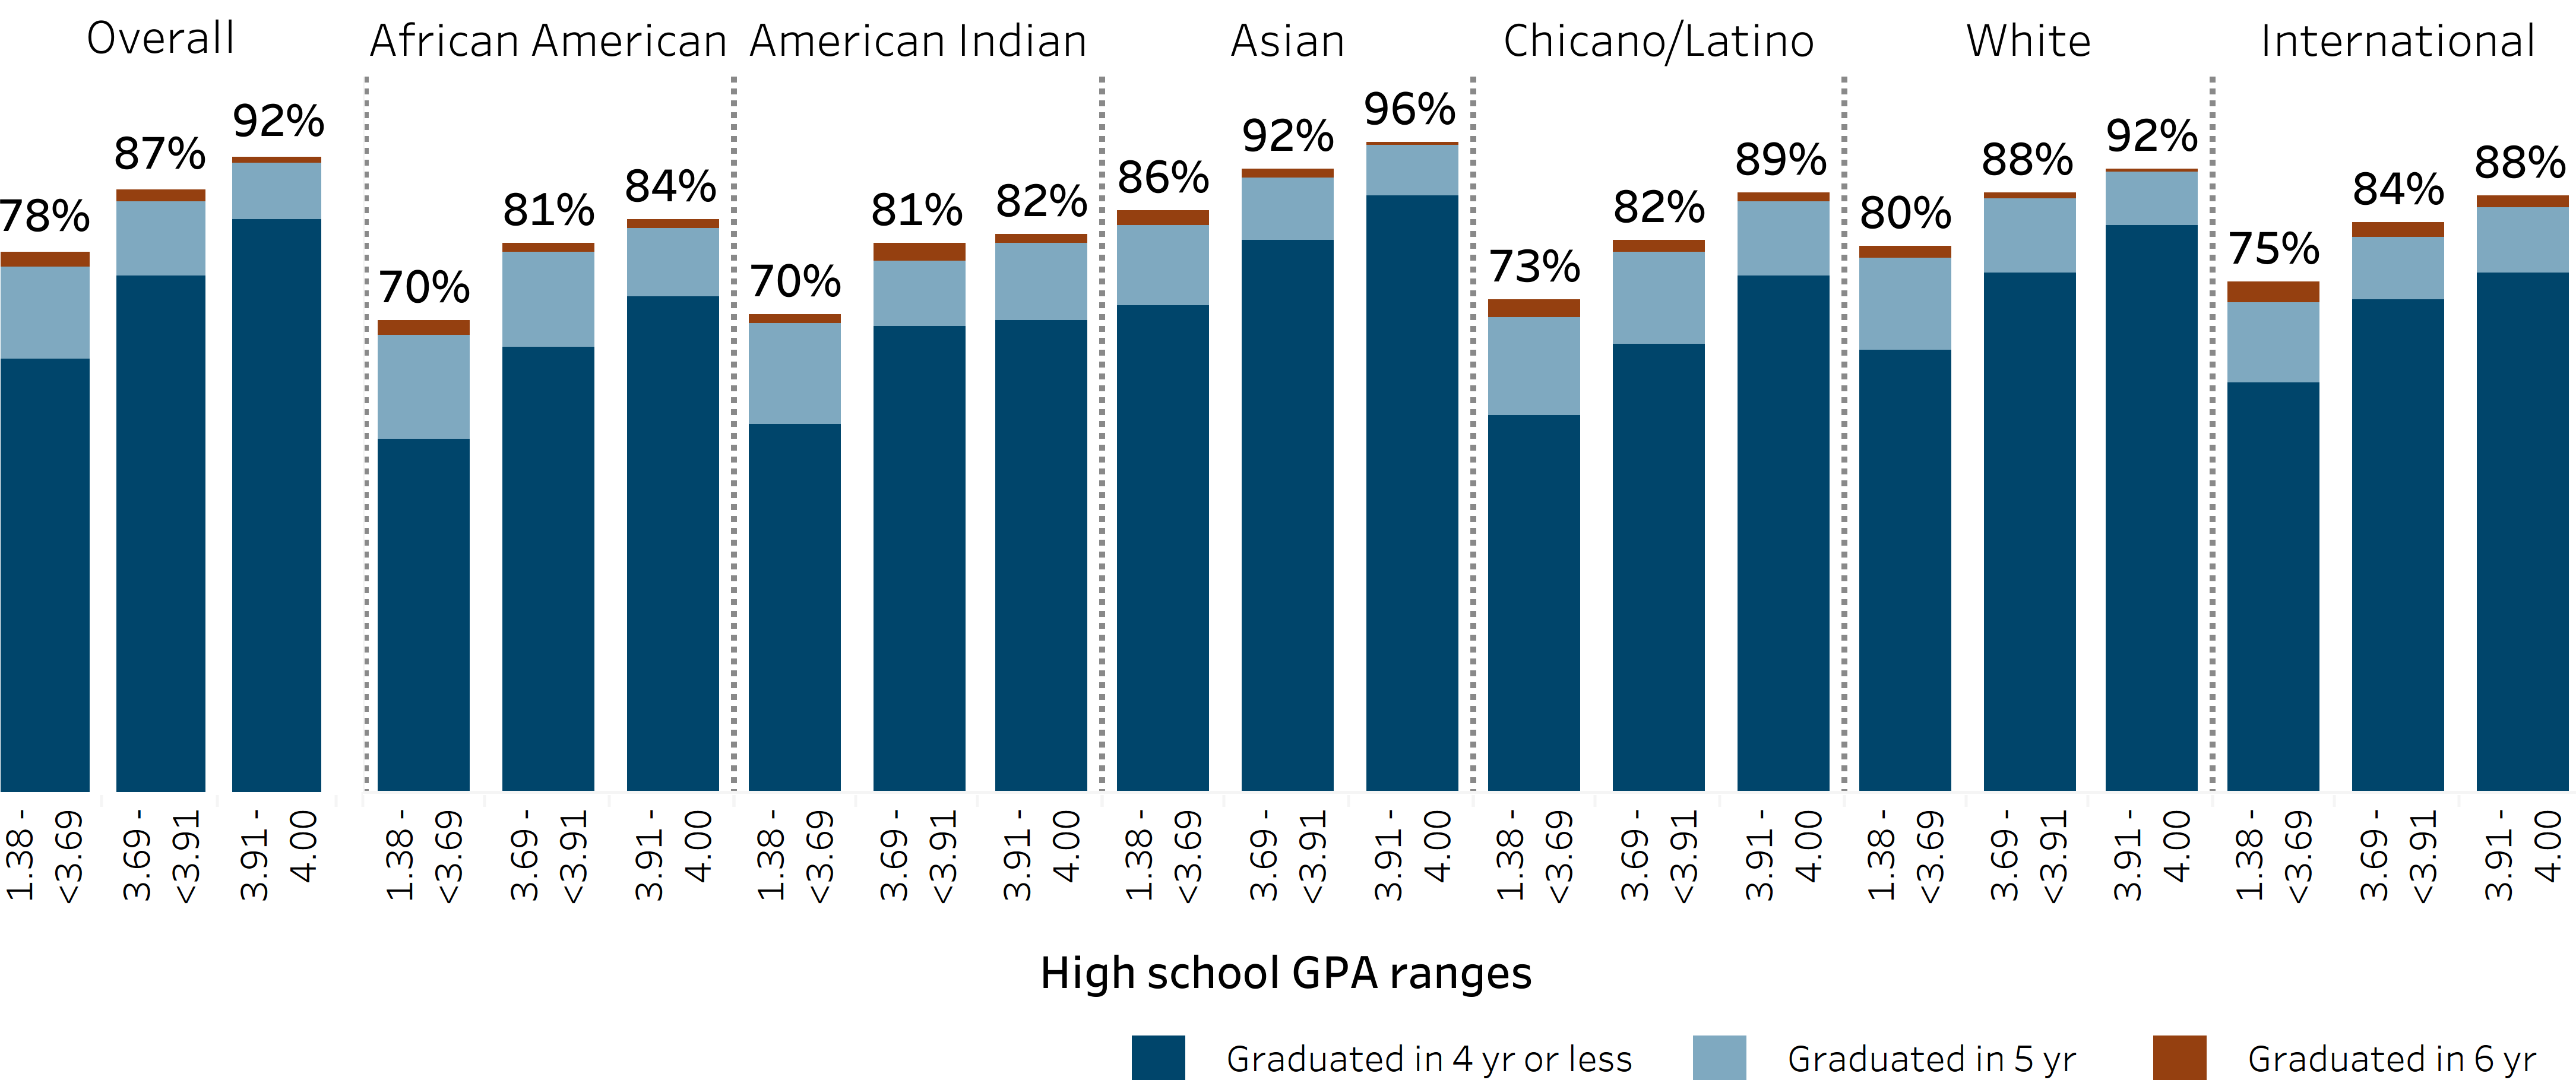
Higher high school GPA is associated with higher freshman graduation rates, but outcomes still vary within GPA ranges across student groups.
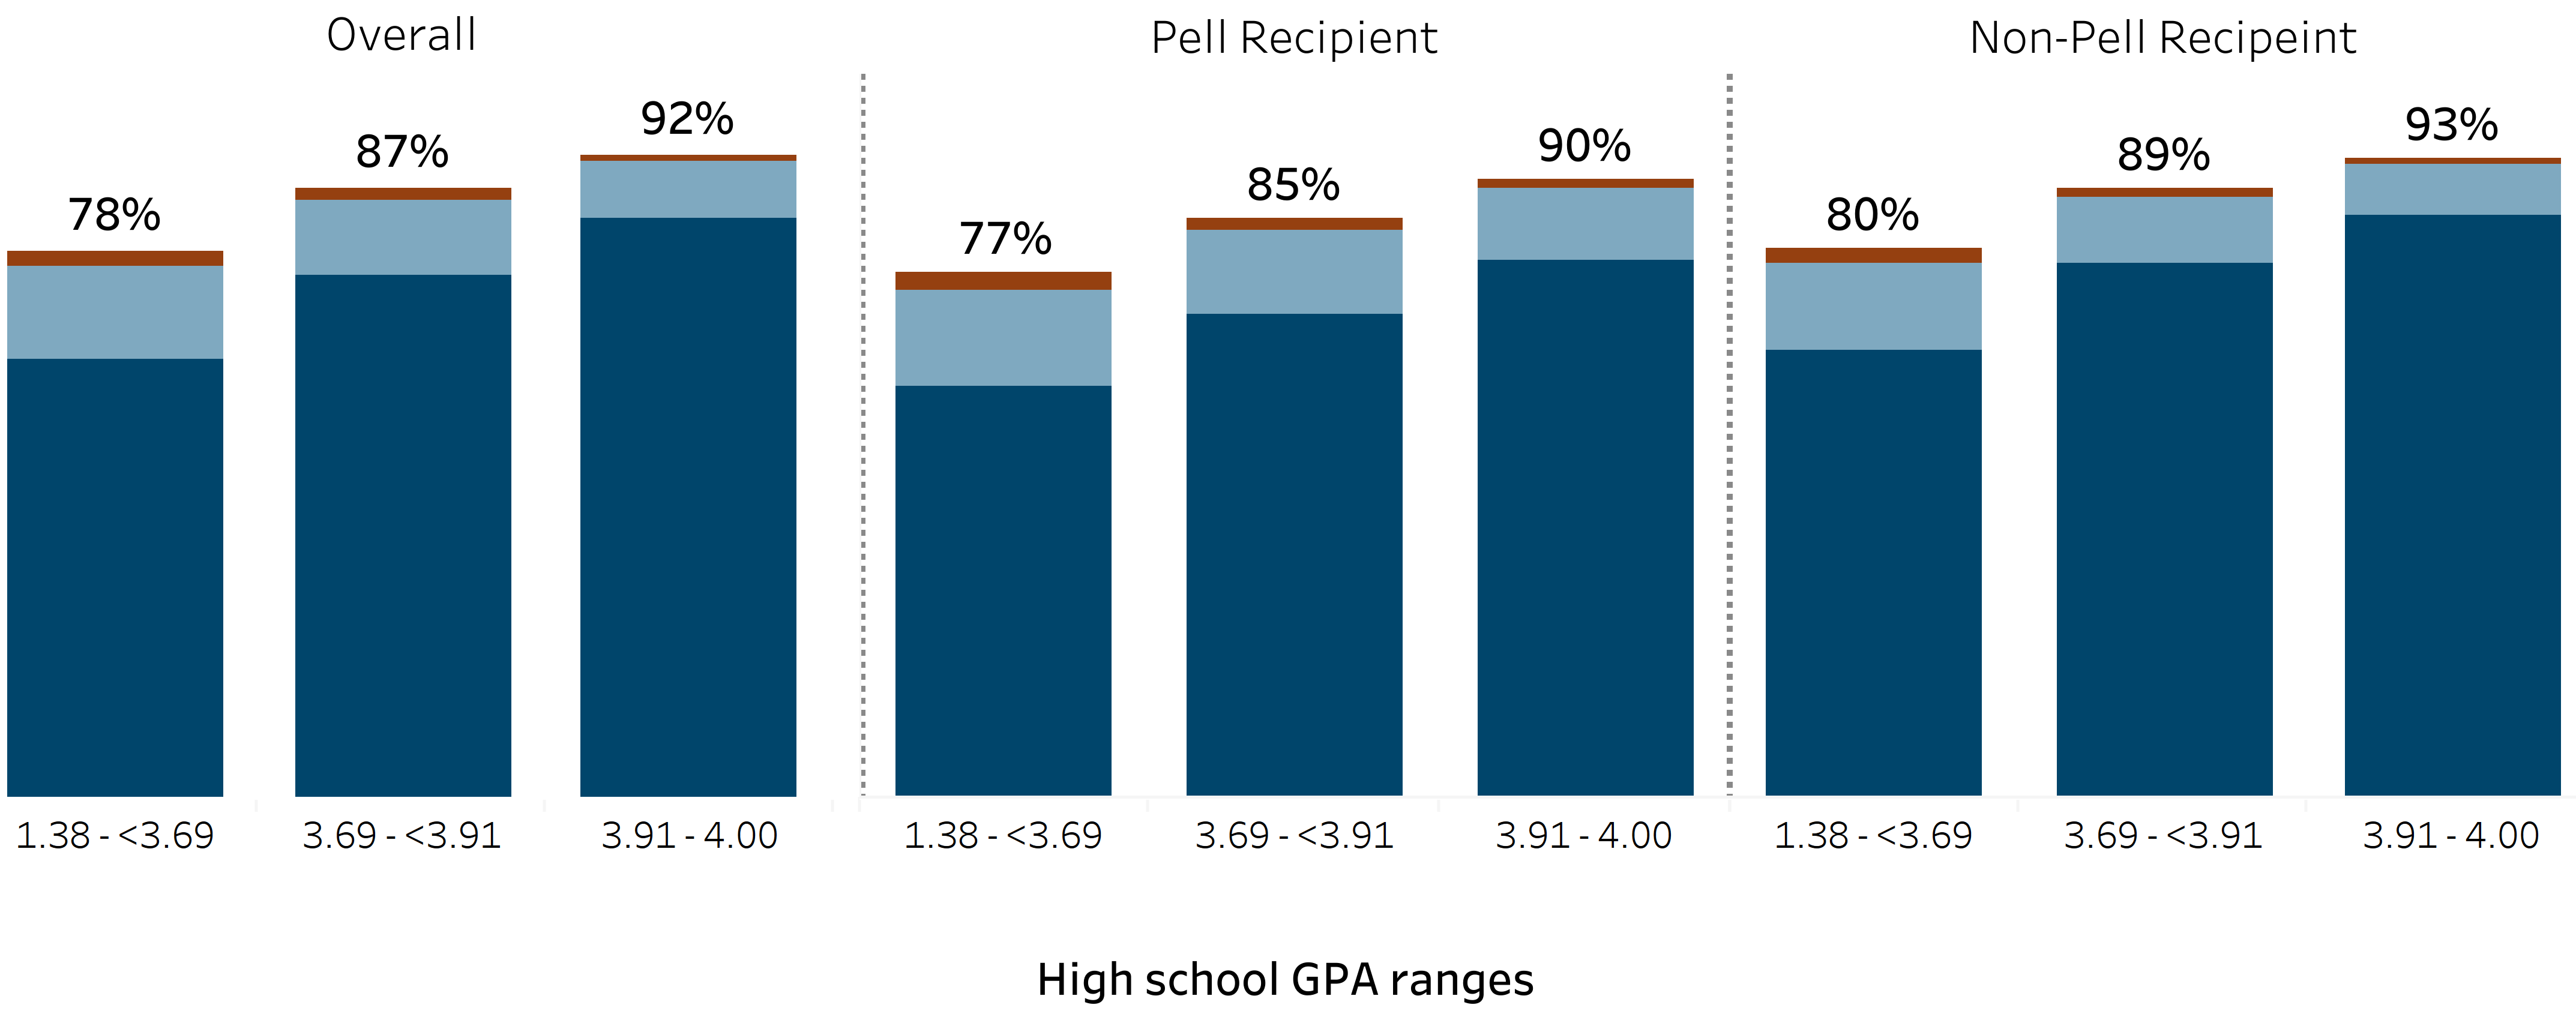
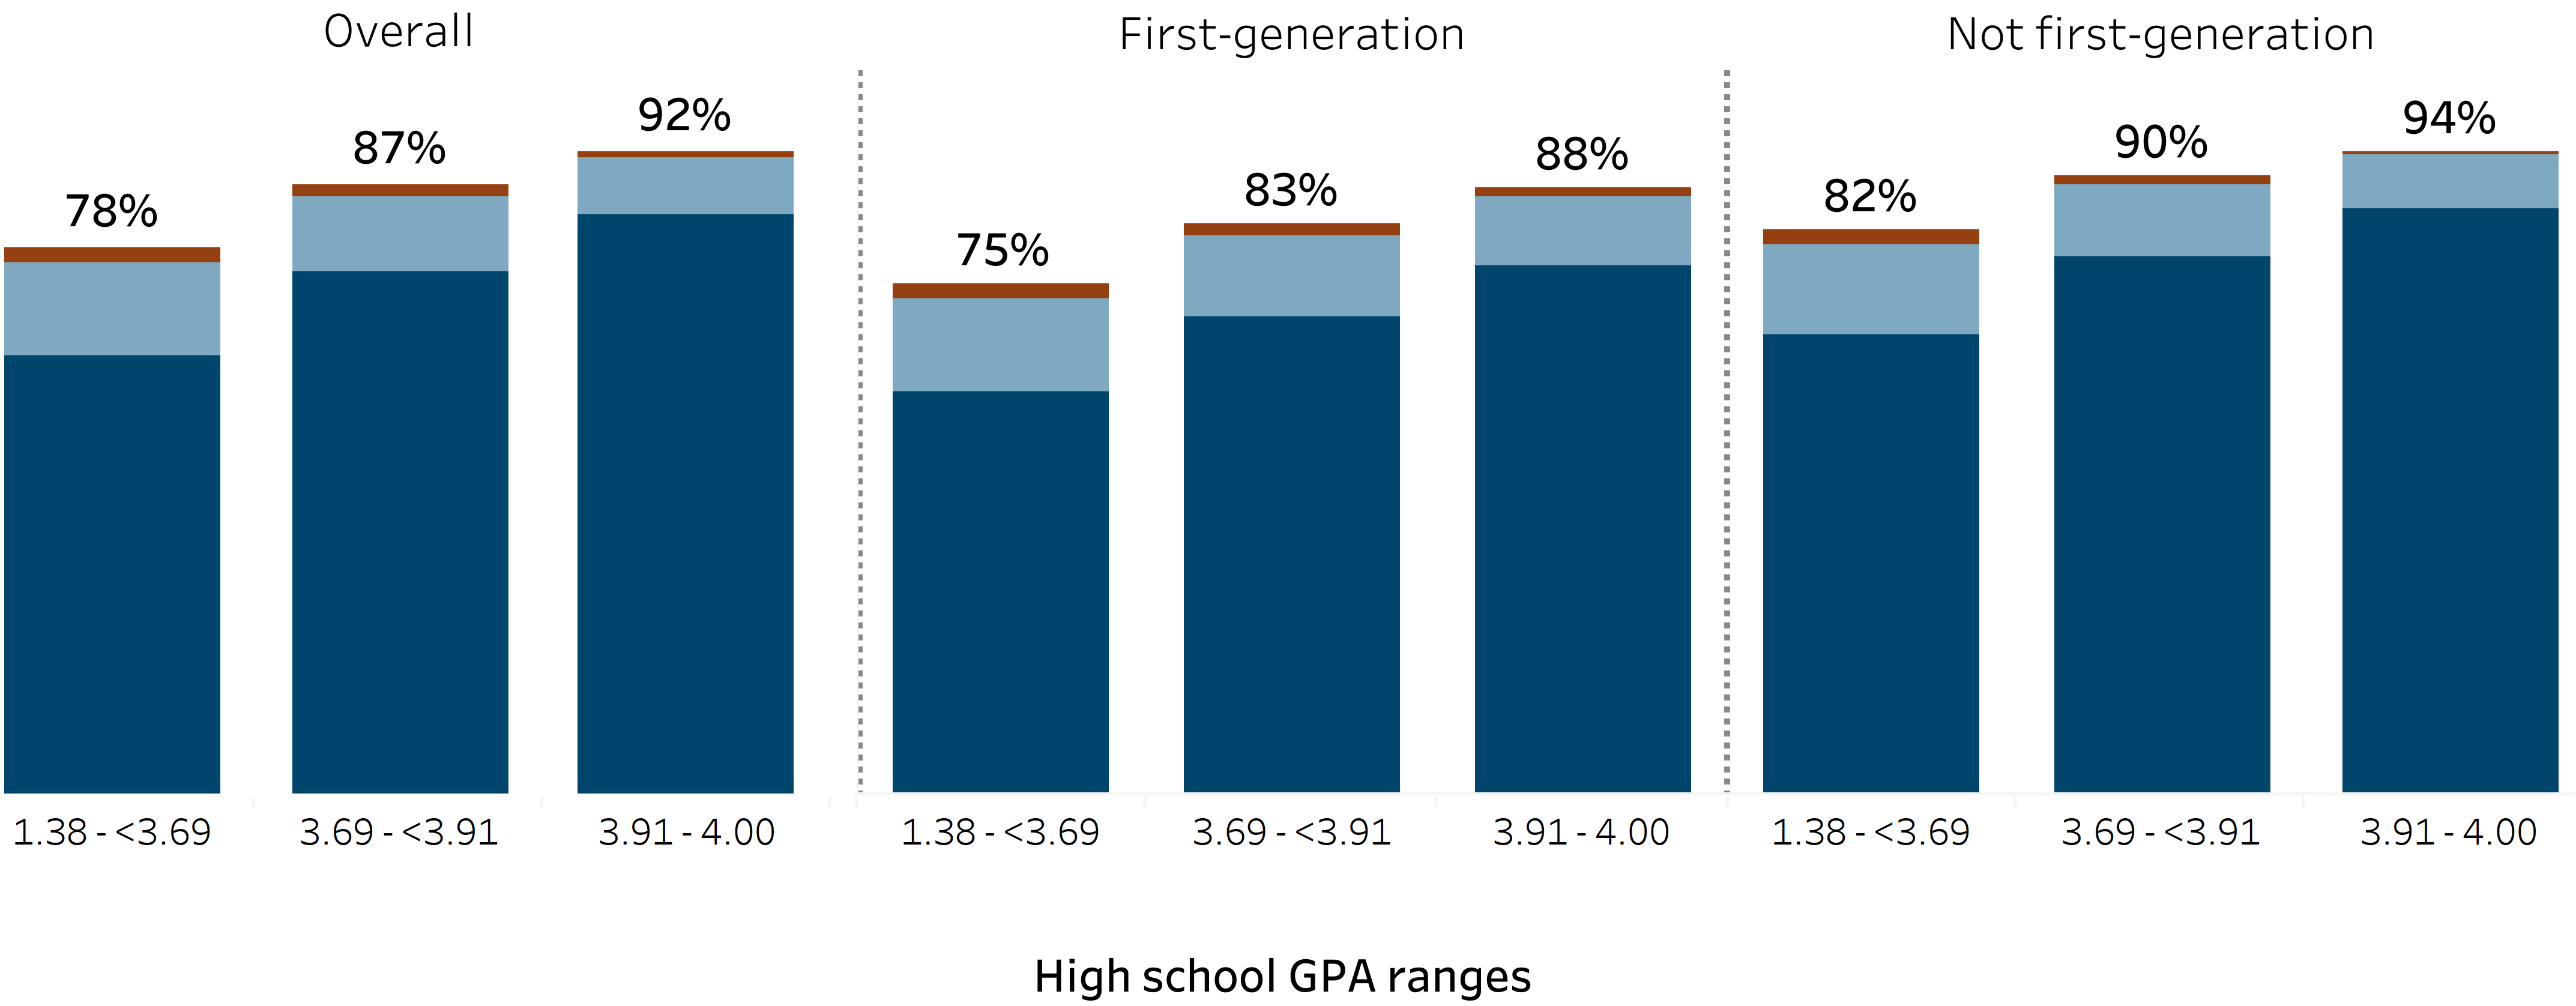
4.1.8 Freshman graduation rates by high school GPA and student group, fall 2019 entering cohort
Undergraduate graduation rates dashboard | Graduate rates by GPA groups
Ethnicity
Pell Grant
First-generation
source: UC Information Center
Incoming high school GPA is strongly associated with freshman graduation rates at UC. The GPA ranges shown here are cohort-specific tercile ranges: within each entering cohort, cutpoints are set at the 33.3rd and 66.7th percentiles of the systemwide unweighted high school GPA distribution, dividing students into approximately three equal-sized groups. For the fall 2019 entering cohort, these cutpoints produced three high school GPA ranges: 1.38 to below 3.69, 3.69 to below 3.91, and 3.91 to 4.00. Six-year graduation rates increased across these ranges, from 78 percent for students with high school GPAs below 3.69, to 87 percent for students with GPAs from 3.69 to below 3.91, and 92 percent for students with GPAs from 3.91 to 4.00. Similar patterns appear within racial/ethnic groups, among Pell Grant recipients and non-recipients, and among first-generation and non-first-generation students.
Differences in incoming high school GPA help explain some, but not all, of the variation in graduation rates across racial/ethnic groups, Pell Grant recipient status, and first-generation status. Graduation outcomes still vary within the same GPA ranges. For example, among students with high school GPAs from 3.91 to 4.00, six-year graduation rates were 90 percent for Pell Grant recipients compared with 93 percent for non-recipients, and 88 percent for first-generation students compared with 94 percent for non-first-generation students.
Together, these patterns suggest that students’ experiences both before and during college shape graduation outcomes. As UC works to improve freshman graduation rates across student groups, these findings point to the importance of equitable educational opportunity prior to enrollment and effective academic, financial, and institutional support after students arrive at UC.
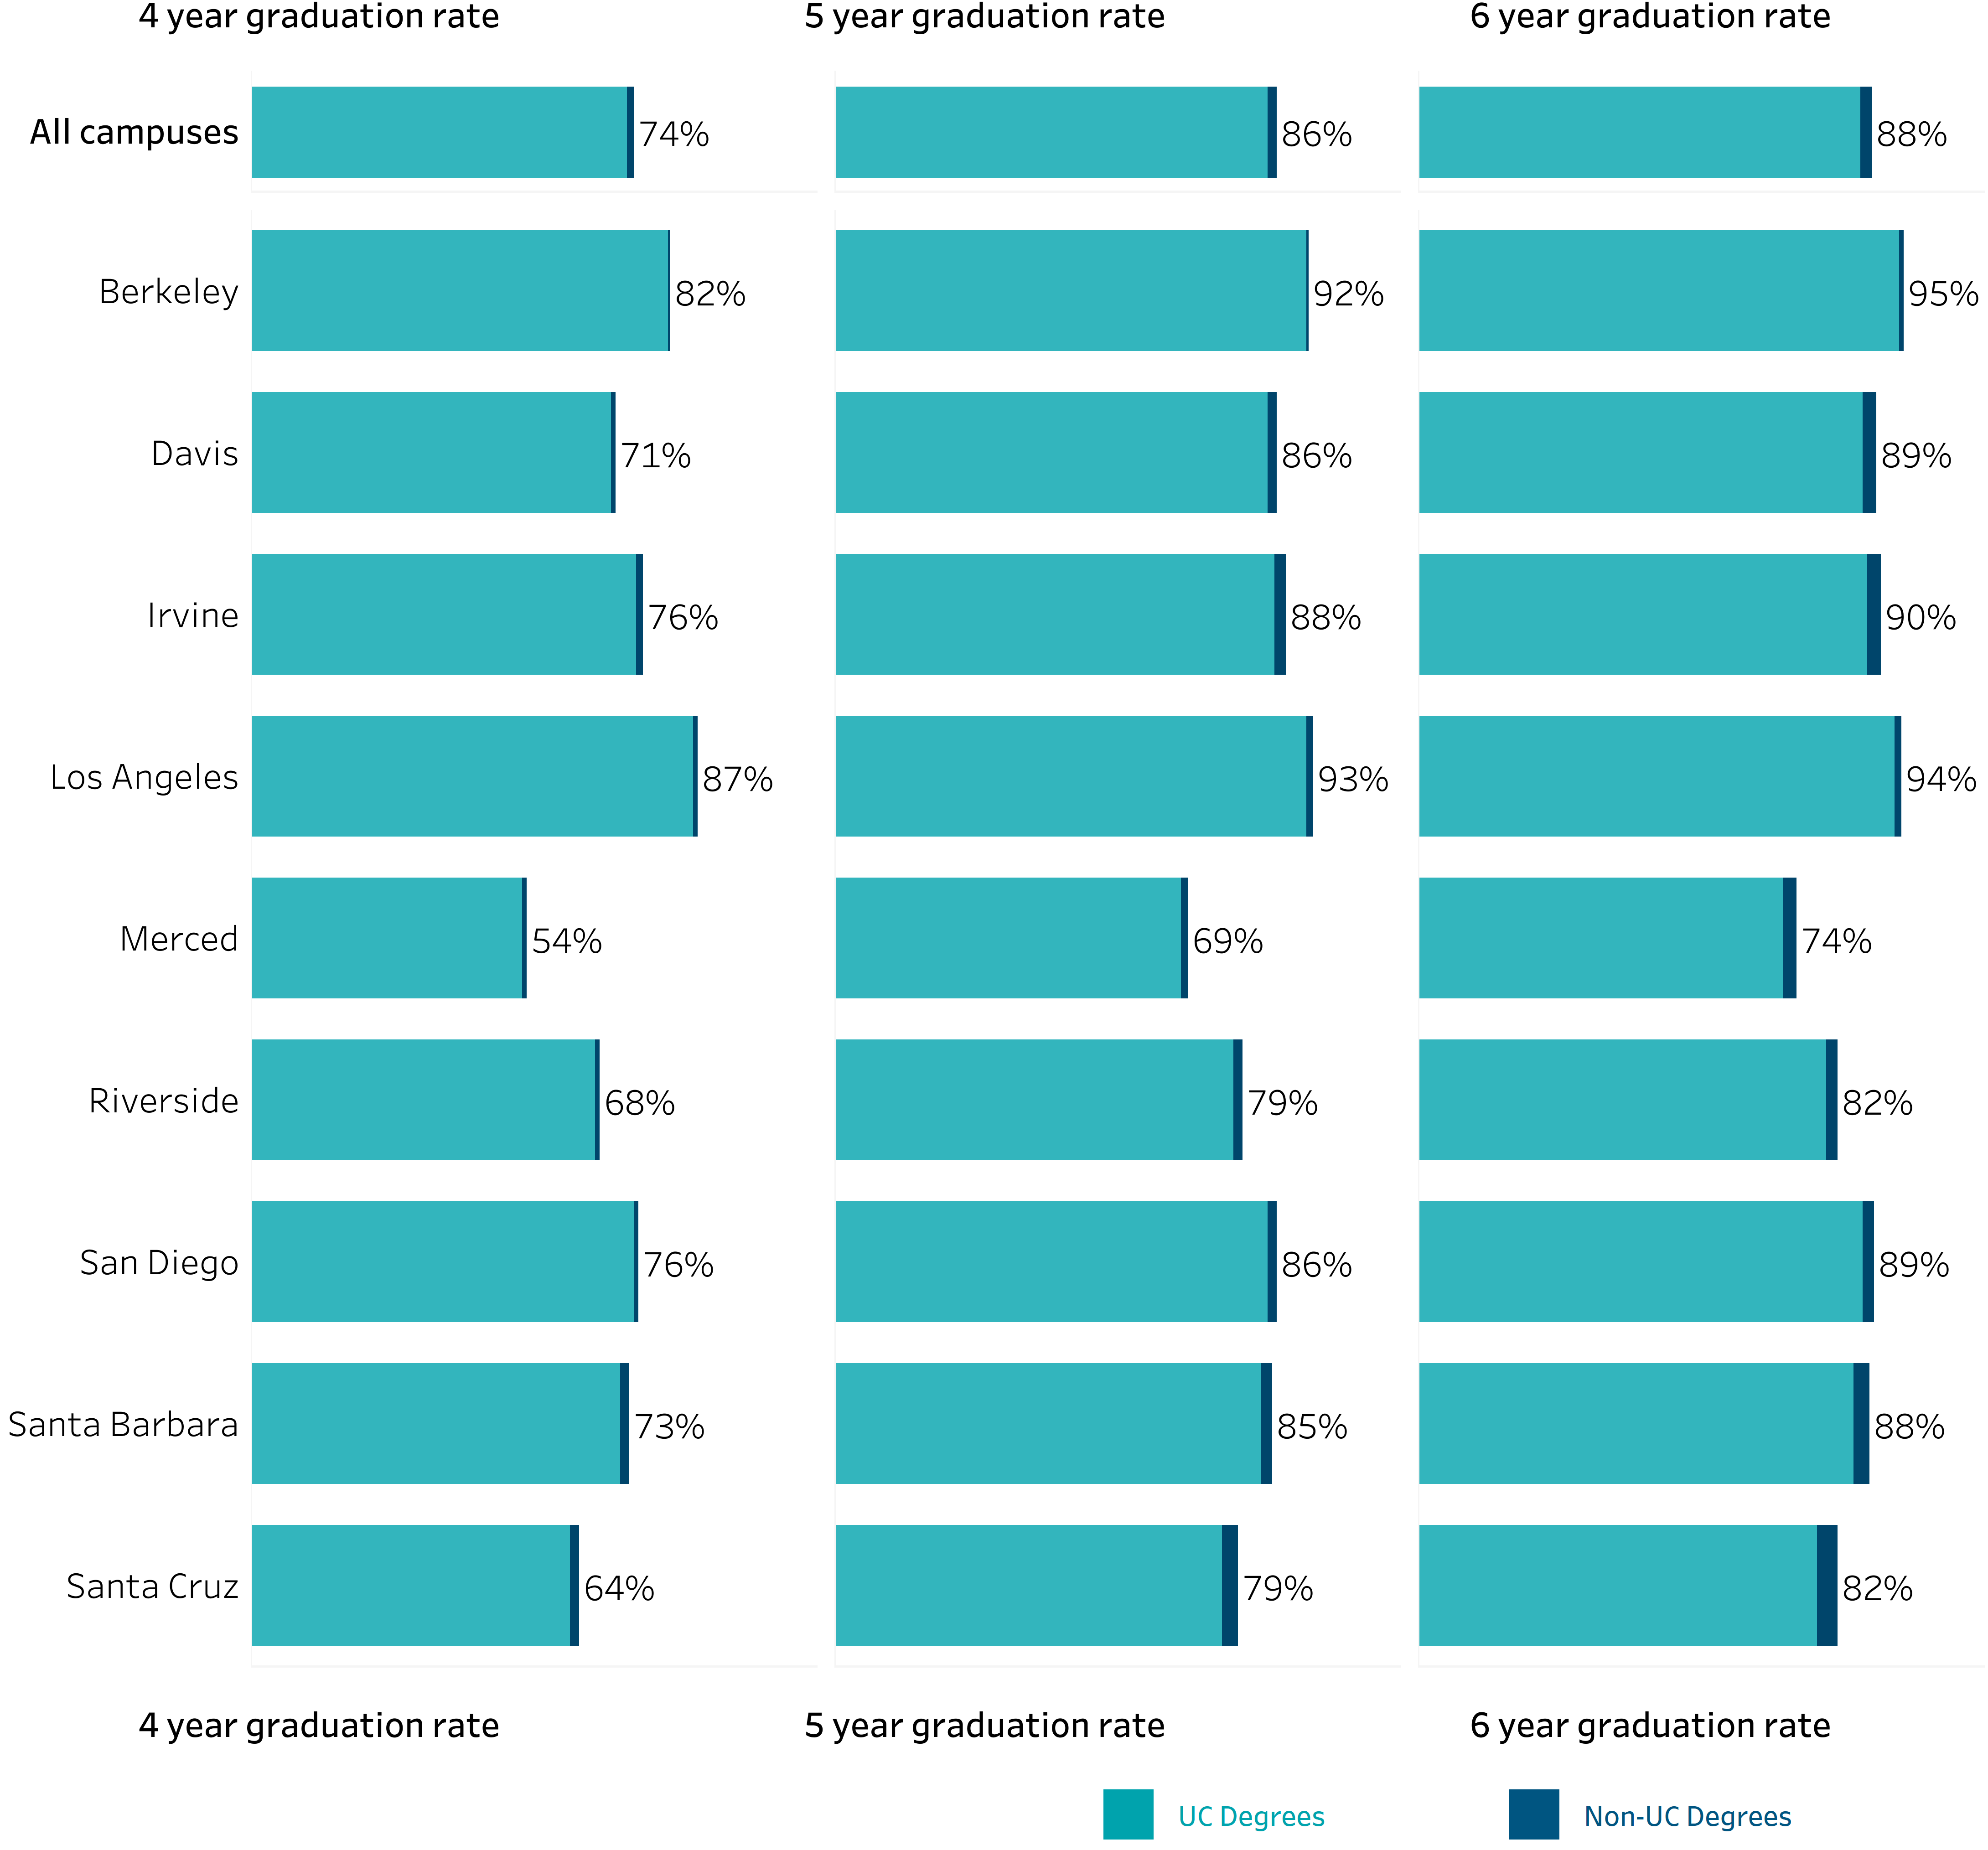
Including non-UC degree completions raises six-year completion for the fall 2019 freshman cohort to 88 percent.
4.1.9 Freshman extended graduation rates, including those who graduated from a non-UC institution, Universitywide and UC campuses, for cohort entering fall 2019
Undergraduate graduation rates dashboard | Non-UC graduation rates
source: UC Information Center
For the fall 2019 entering cohort, which entered before the pandemic period, 88 percent completed a bachelor’s degree within six years when non-UC degree completions are included, about two percentage points higher than the UC-only six-year graduation rate. Campus rates range from 74 percent at Merced to 95 percent at Berkeley, showing high overall completion with some variation across UC.
note: Intercampus transfers within UC are counted as graduates of their originating UC campus. In this graph, non-UC rates only include those who transferred to non-UC institutions and graduated with a bachelor’s degree.
UC’s first-year freshman retention rate remains high and exceeds the rate at AAU public comparison institutions, providing an early signal for future graduation outcomes.
4.1.10 First-year retention rates for UC freshmen and comparison institutions, fall 2024 entering cohort
source: Freshman data from IPEDS
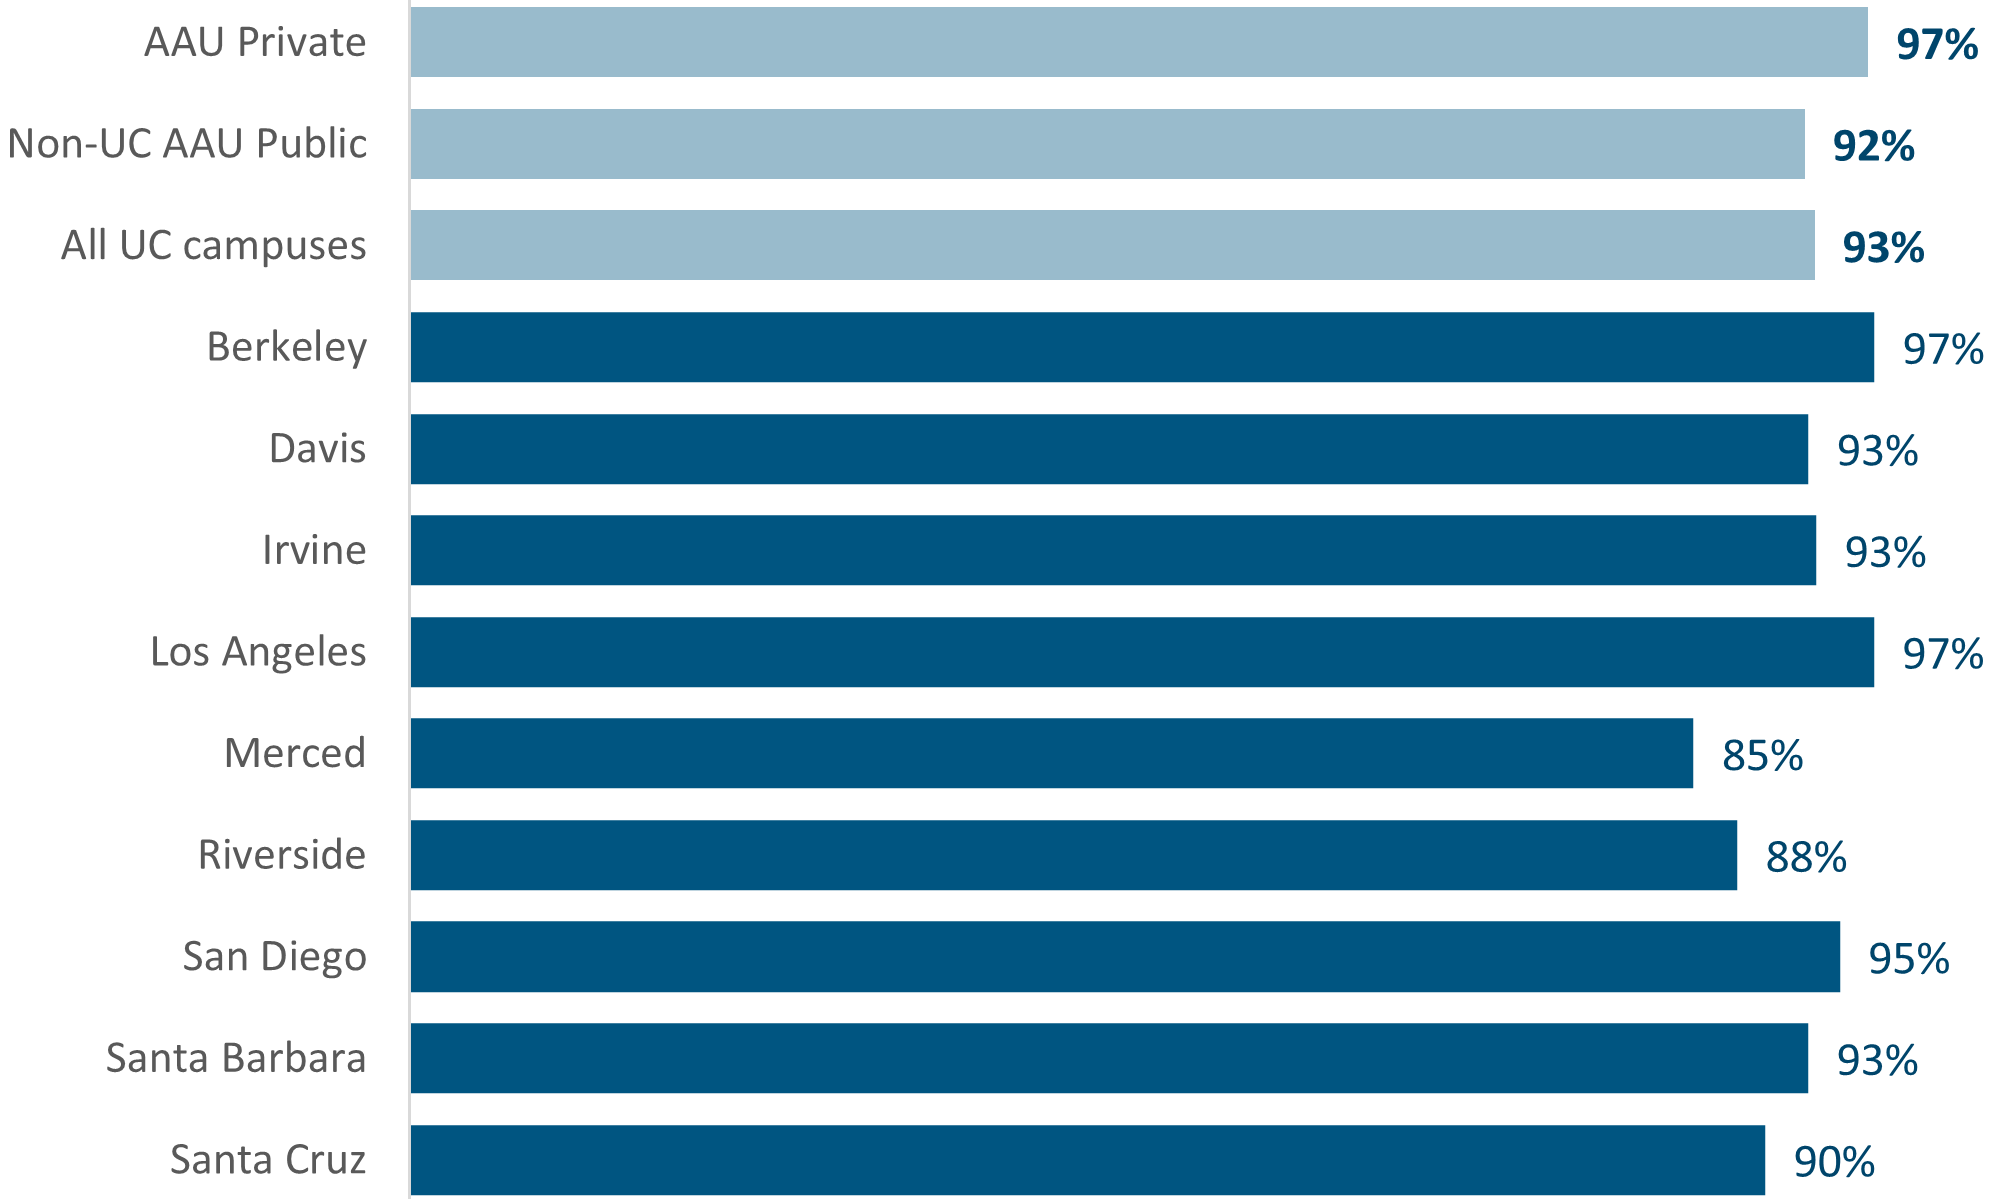
First-year retention is an early indicator of student success, while graduation rates reflect outcomes for earlier entering cohorts and are therefore a lagging indicator. For freshmen entering in fall 2024, after the pandemic period, UC’s first-year retention rate was 93 percent, one percentage point higher than non-UC AAU public institutions and four percentage points lower than AAU private institutions.
Although the most recent systemwide freshman retention rate increased only slightly from the prior year, it remains high after rebounding from pandemic-era declines. Across UC campuses, first-year freshman retention rates ranged from 85 percent at Merced to 97 percent at Berkeley and UCLA, with most campuses retaining at least 90 percent of freshmen after the first year.
Maintaining high first-year retention is important because students who continue after their first year are more likely to remain on track toward degree completion. The next section examines whether these strong retention outcomes are shared across first-generation students, Pell Grant recipients, and students from racial/ethnic groups historically underrepresented in higher education.
Freshman retention remains high across student groups, with smaller differences than in four- and six-year graduation outcomes.
4.1.11 First-year freshman retention rate by student group and entering cohort year
UC 2030 dashboard | Goal #2 - Retention rates
source: UC Information Center
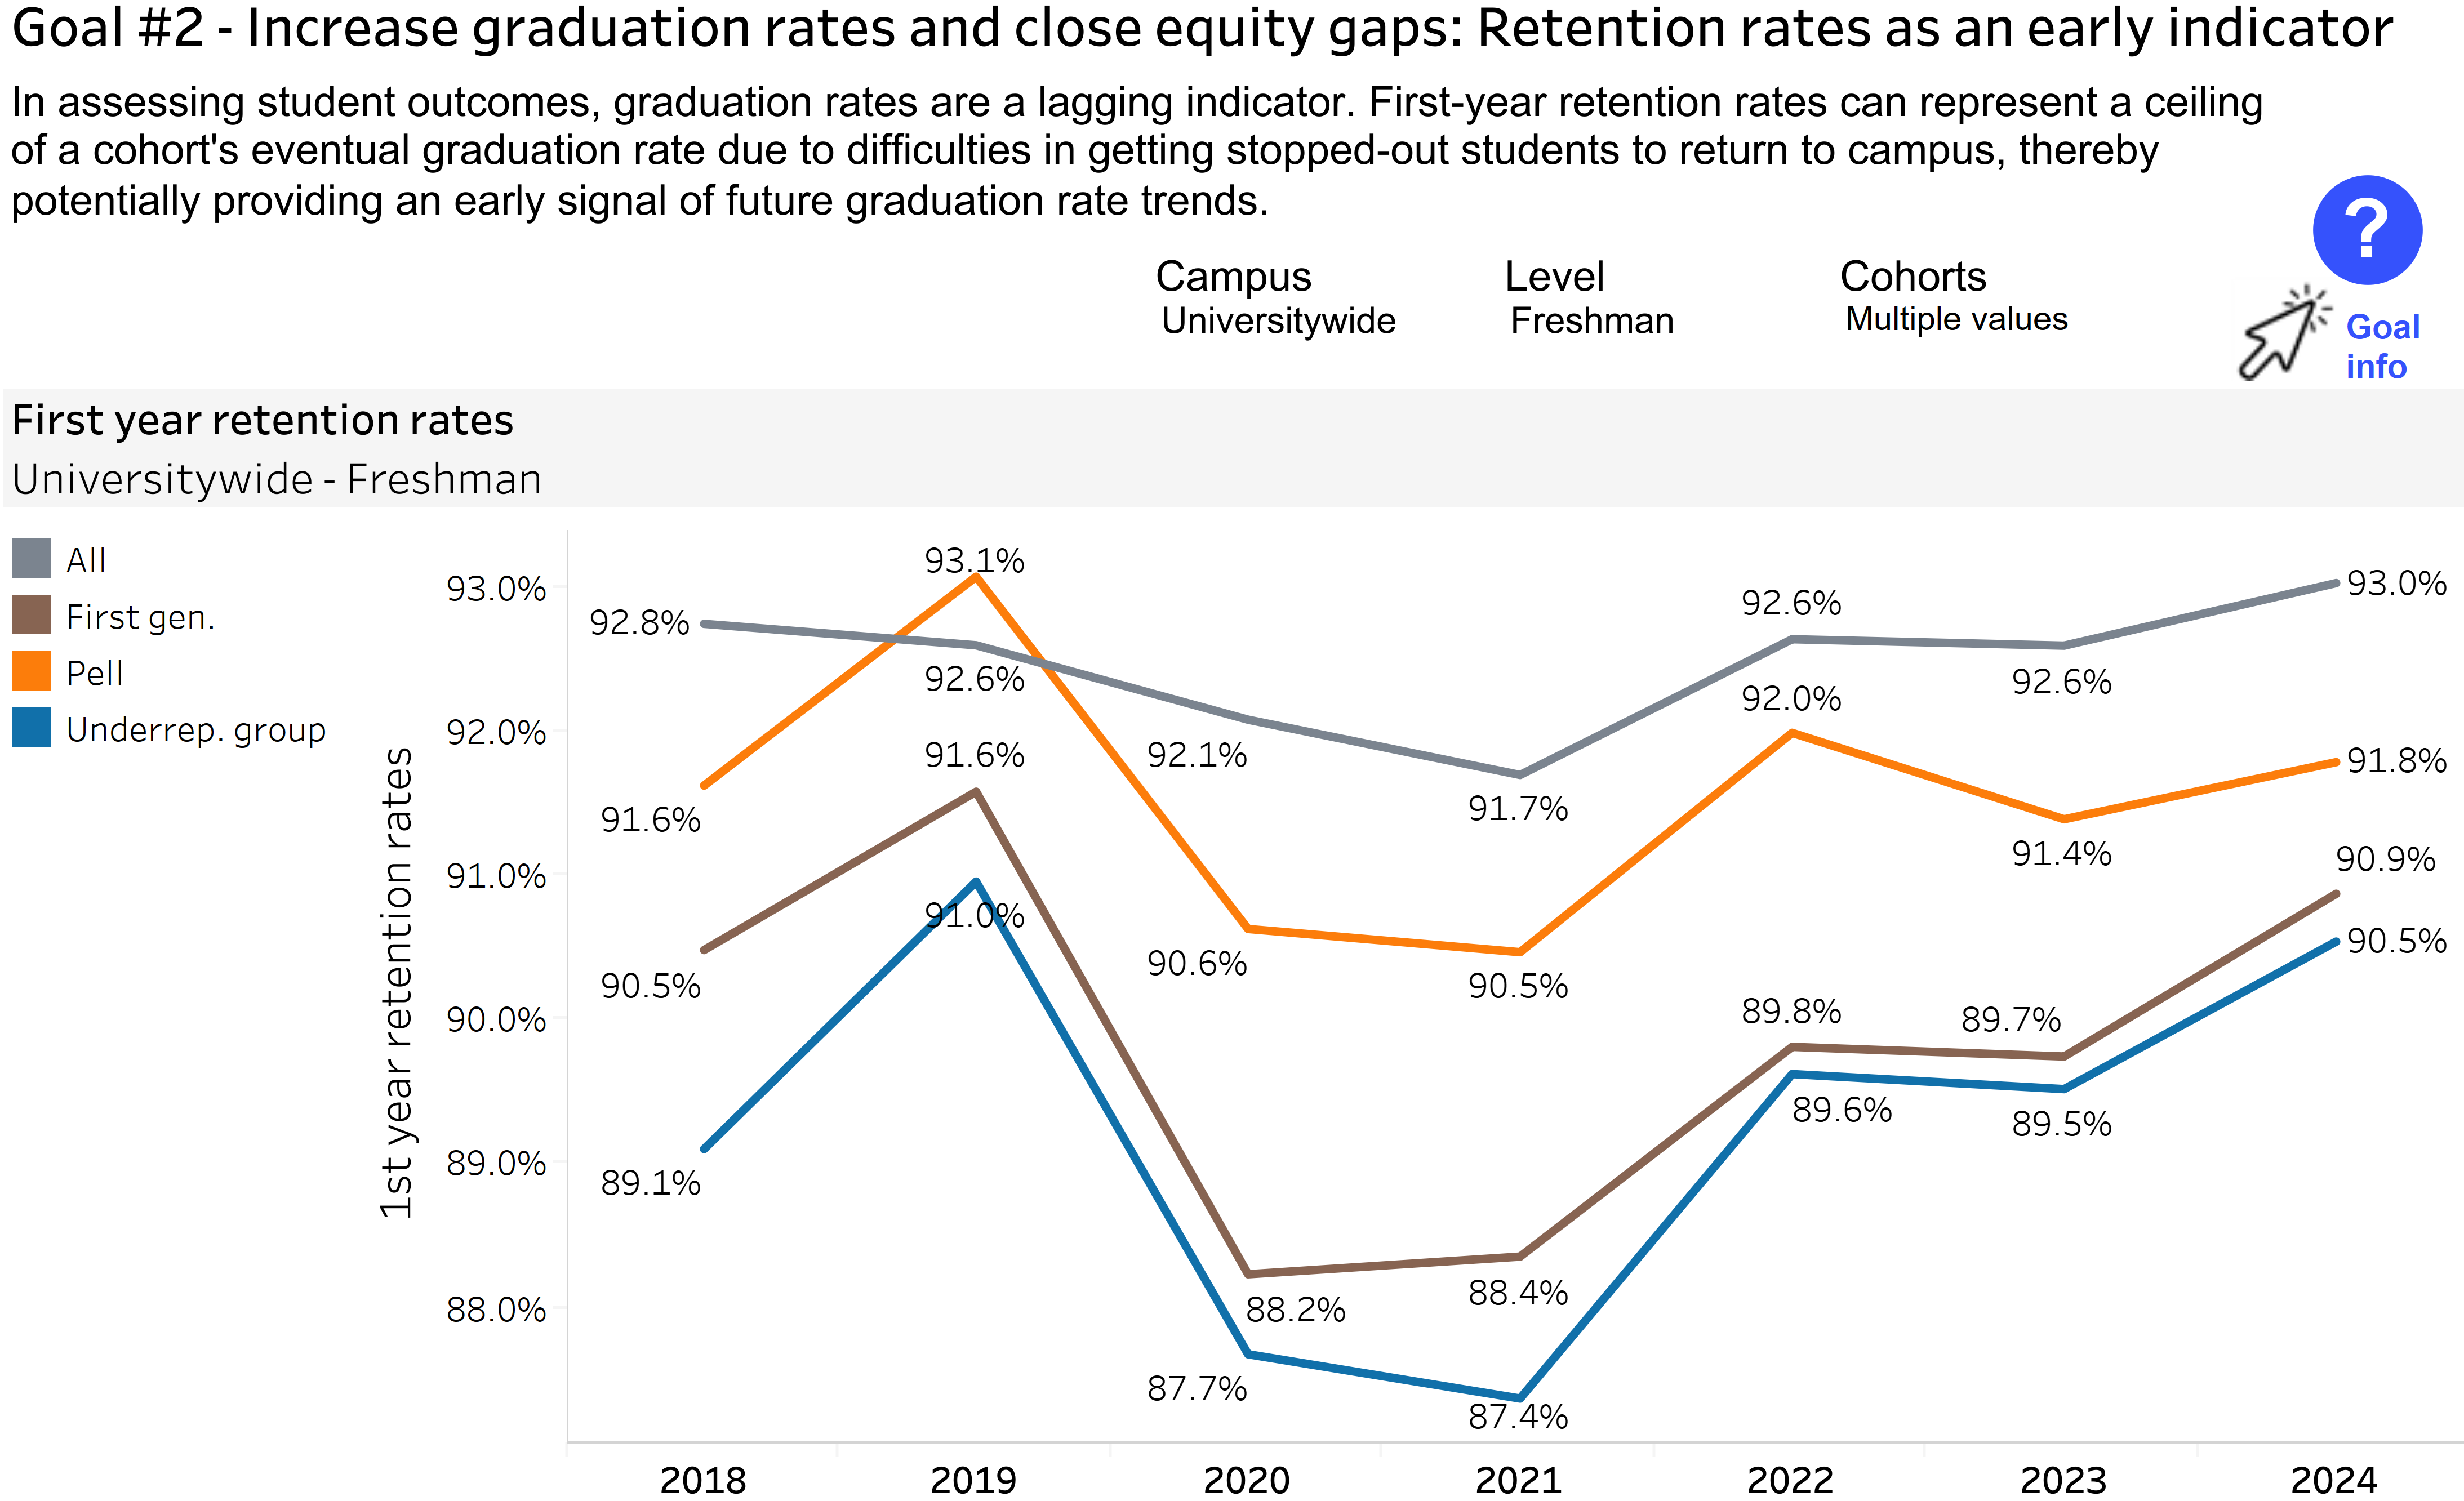
First-year retention rates for freshmen remain high across UC. For the fall 2024 entering cohort, which entered after the pandemic period, 93 percent of freshmen continued after their first year, following a rebound from the pandemic-era low for the fall 2021 cohort, which entered during the pandemic.
Retention has also improved for first-generation students, Pell Grant recipients, and students from racial/ethnic groups historically underrepresented in higher education since the pandemic-era lows, though small differences remain. For the fall 2024 entering cohort, first-year retention was 91 percent for first-generation students, 92 percent for Pell Grant recipients, and 91 percent for students in these racial/ethnic groups, compared with 93 percent overall. These differences are smaller than those observed in four- and six-year graduation outcomes, suggesting that most freshmen remain enrolled after the first year even as differences in timely graduation emerge later in students’ academic pathways.
UC has met the 2025–26 Compact goal and is nearing the 2030 goal, with relatively small differences across student groups compared with freshman four-year graduation.
4.2.1 Transfer two-year graduation rates by student group and exit cohort year
UC 2030 dashboard | Goal #2 - progress
source: UC Information Center
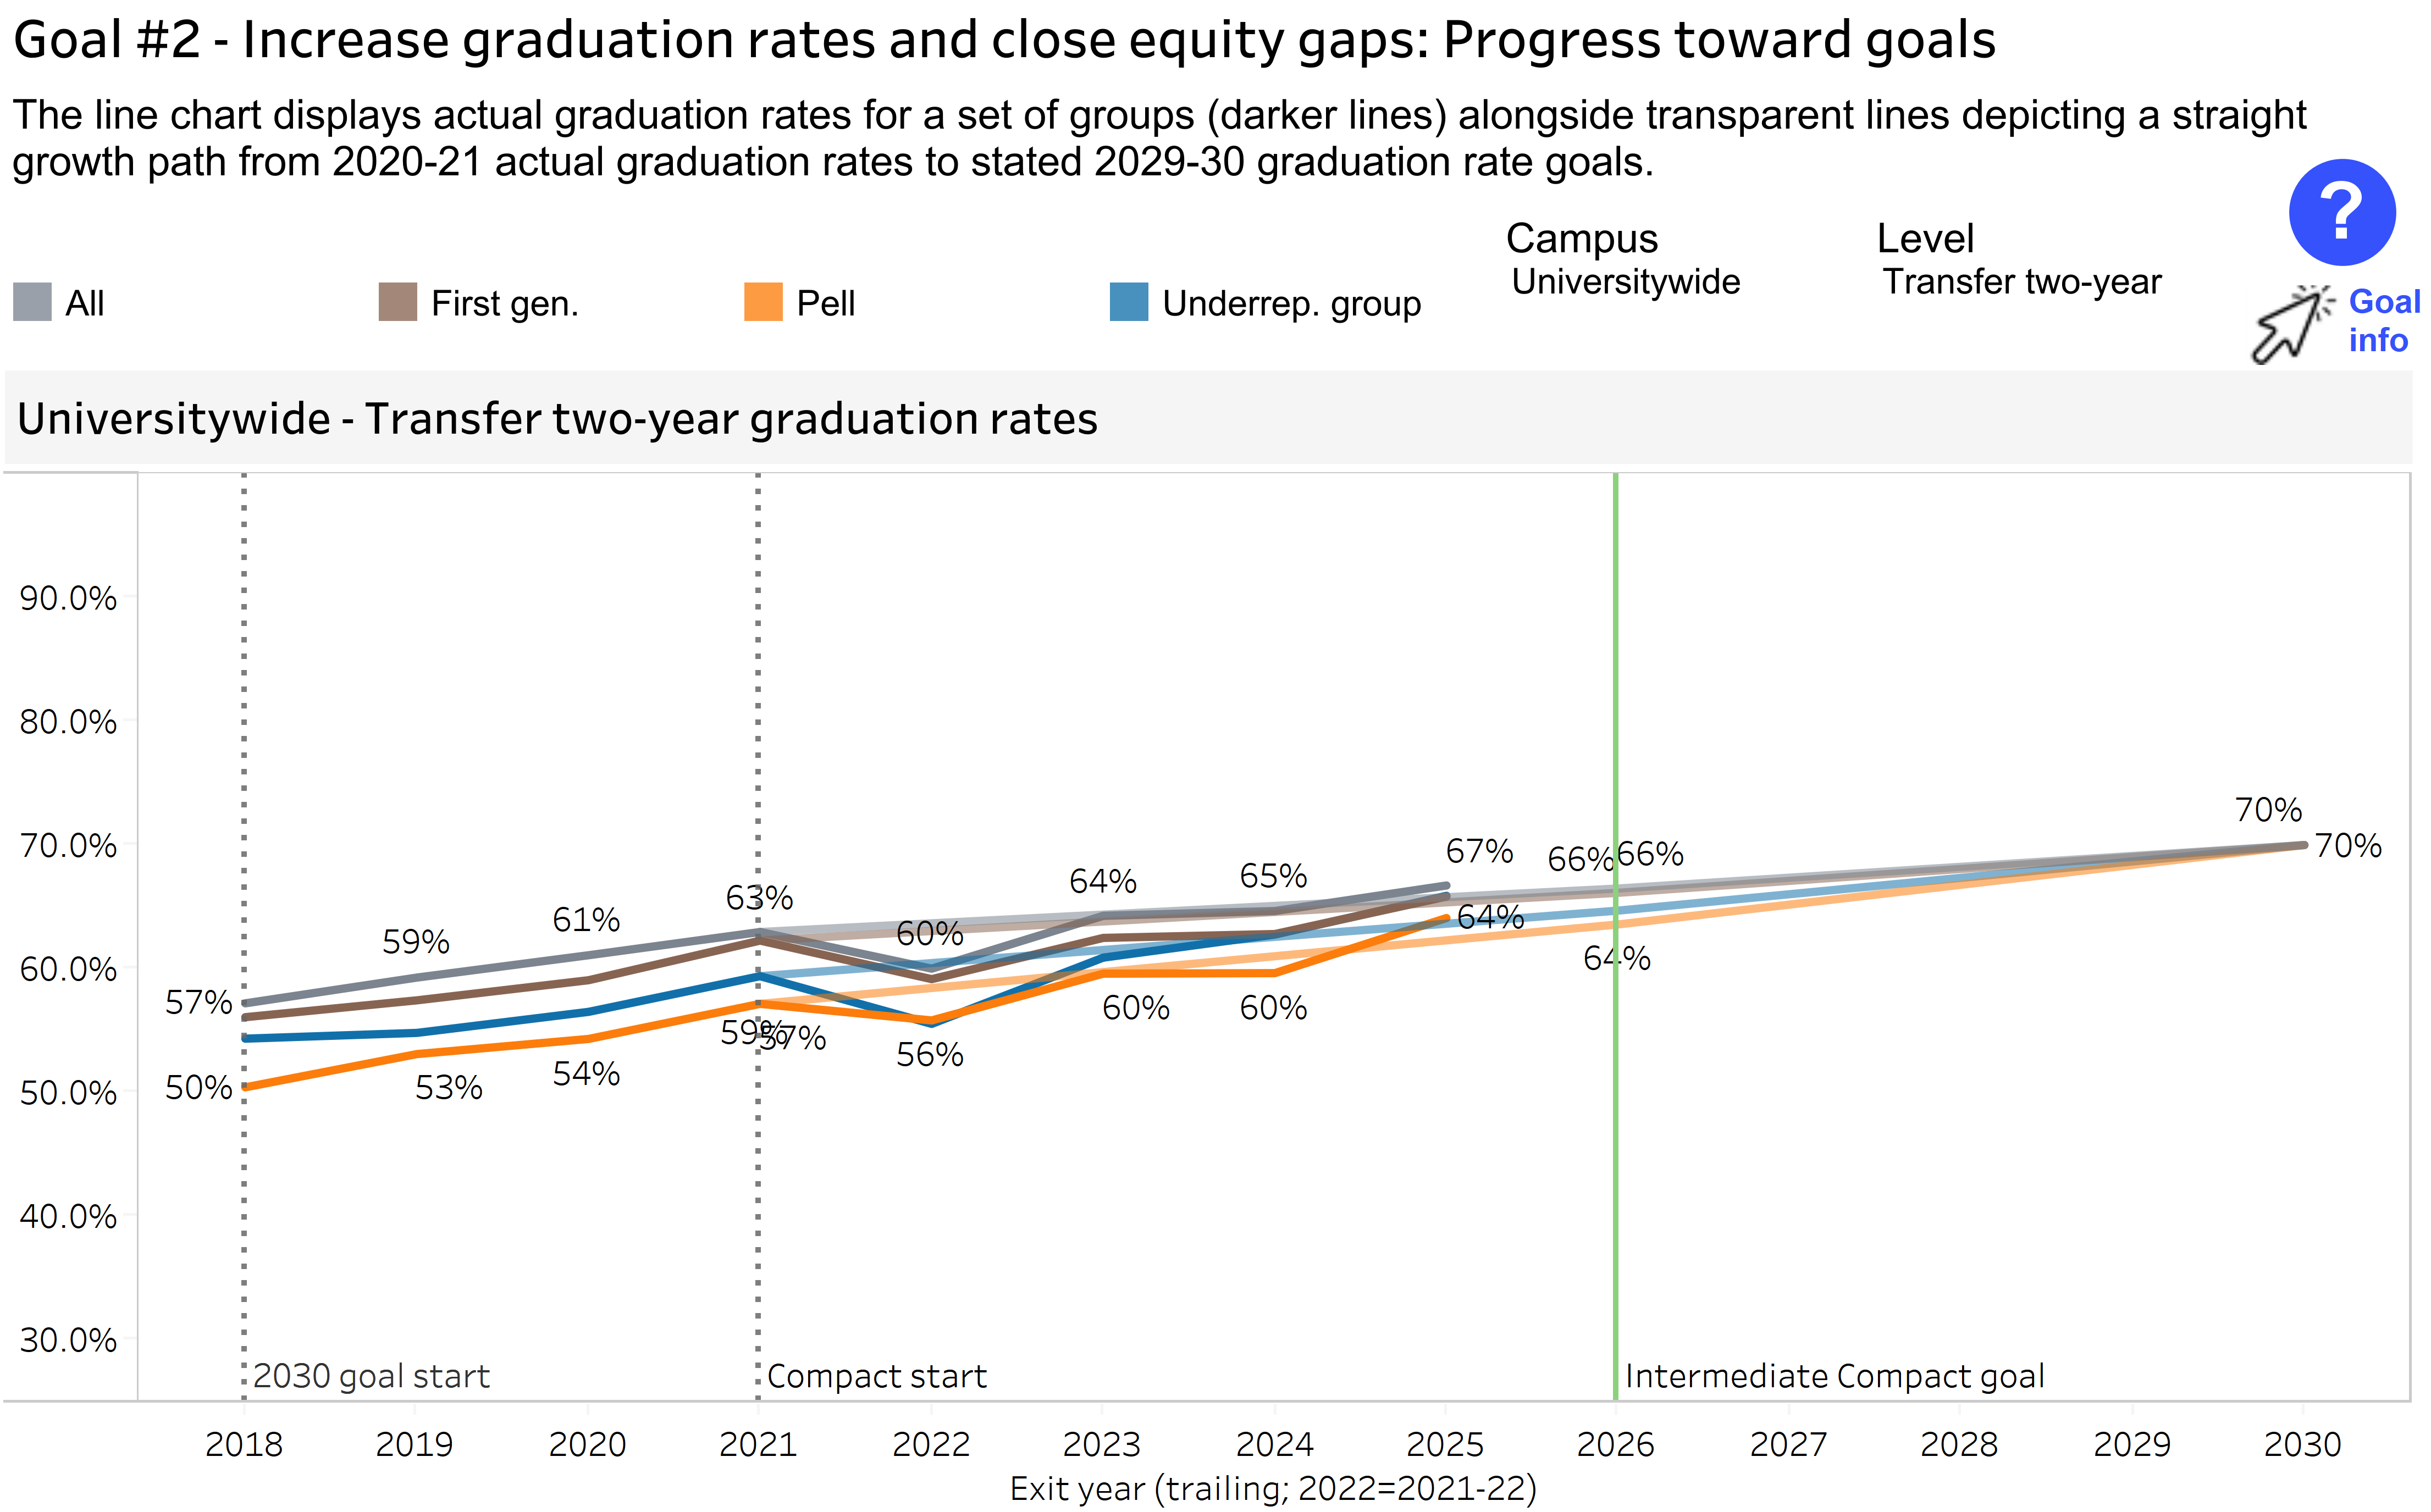
UC is working toward a 70 percent two-year transfer graduation rate by 2030. For the 2025 exit cohort, the two-year transfer graduation rate reflects students who entered UC as transfers in fall 2023, after the pandemic period. The current overall two-year transfer graduation rate is 67 percent, up from 65 percent for the prior cohort. This exceeds the 2025–26 intermediate Compact goal and places UC within three percentage points of the 2030 goal.
Differences in two-year transfer graduation outcomes remain relatively small compared with the freshman four-year differences. In the latest data, first-generation transfer students and transfer students from racial/ethnic groups historically underrepresented in higher education are within one percentage point of the overall transfer rate. Additional progress toward the 2030 goal will require raising the overall two-year transfer graduation rate while improving outcomes for Pell Grant recipients, whose rate remains furthest below the overall transfer rate.
note: The first two indicators in this section use exit cohorts to show the most recent UC 2030 Dashboard results for two- and four-year transfer graduation; the remaining indicators use entering cohorts to examine longer-term patterns in time to degree, GPA patterns, and retention.
4.2 TRANSFER GRADUATION RATES AND RETENTION
UC’s transfer four-year graduation rate is within one percentage point of the 2030 goal, and rates increased from the prior exit cohort for each student group shown.
4.2.2 Transfer four-year graduation rates by student group and exit cohort year
UC 2030 dashboard | Goal #2 - progress
source: UC Information Center
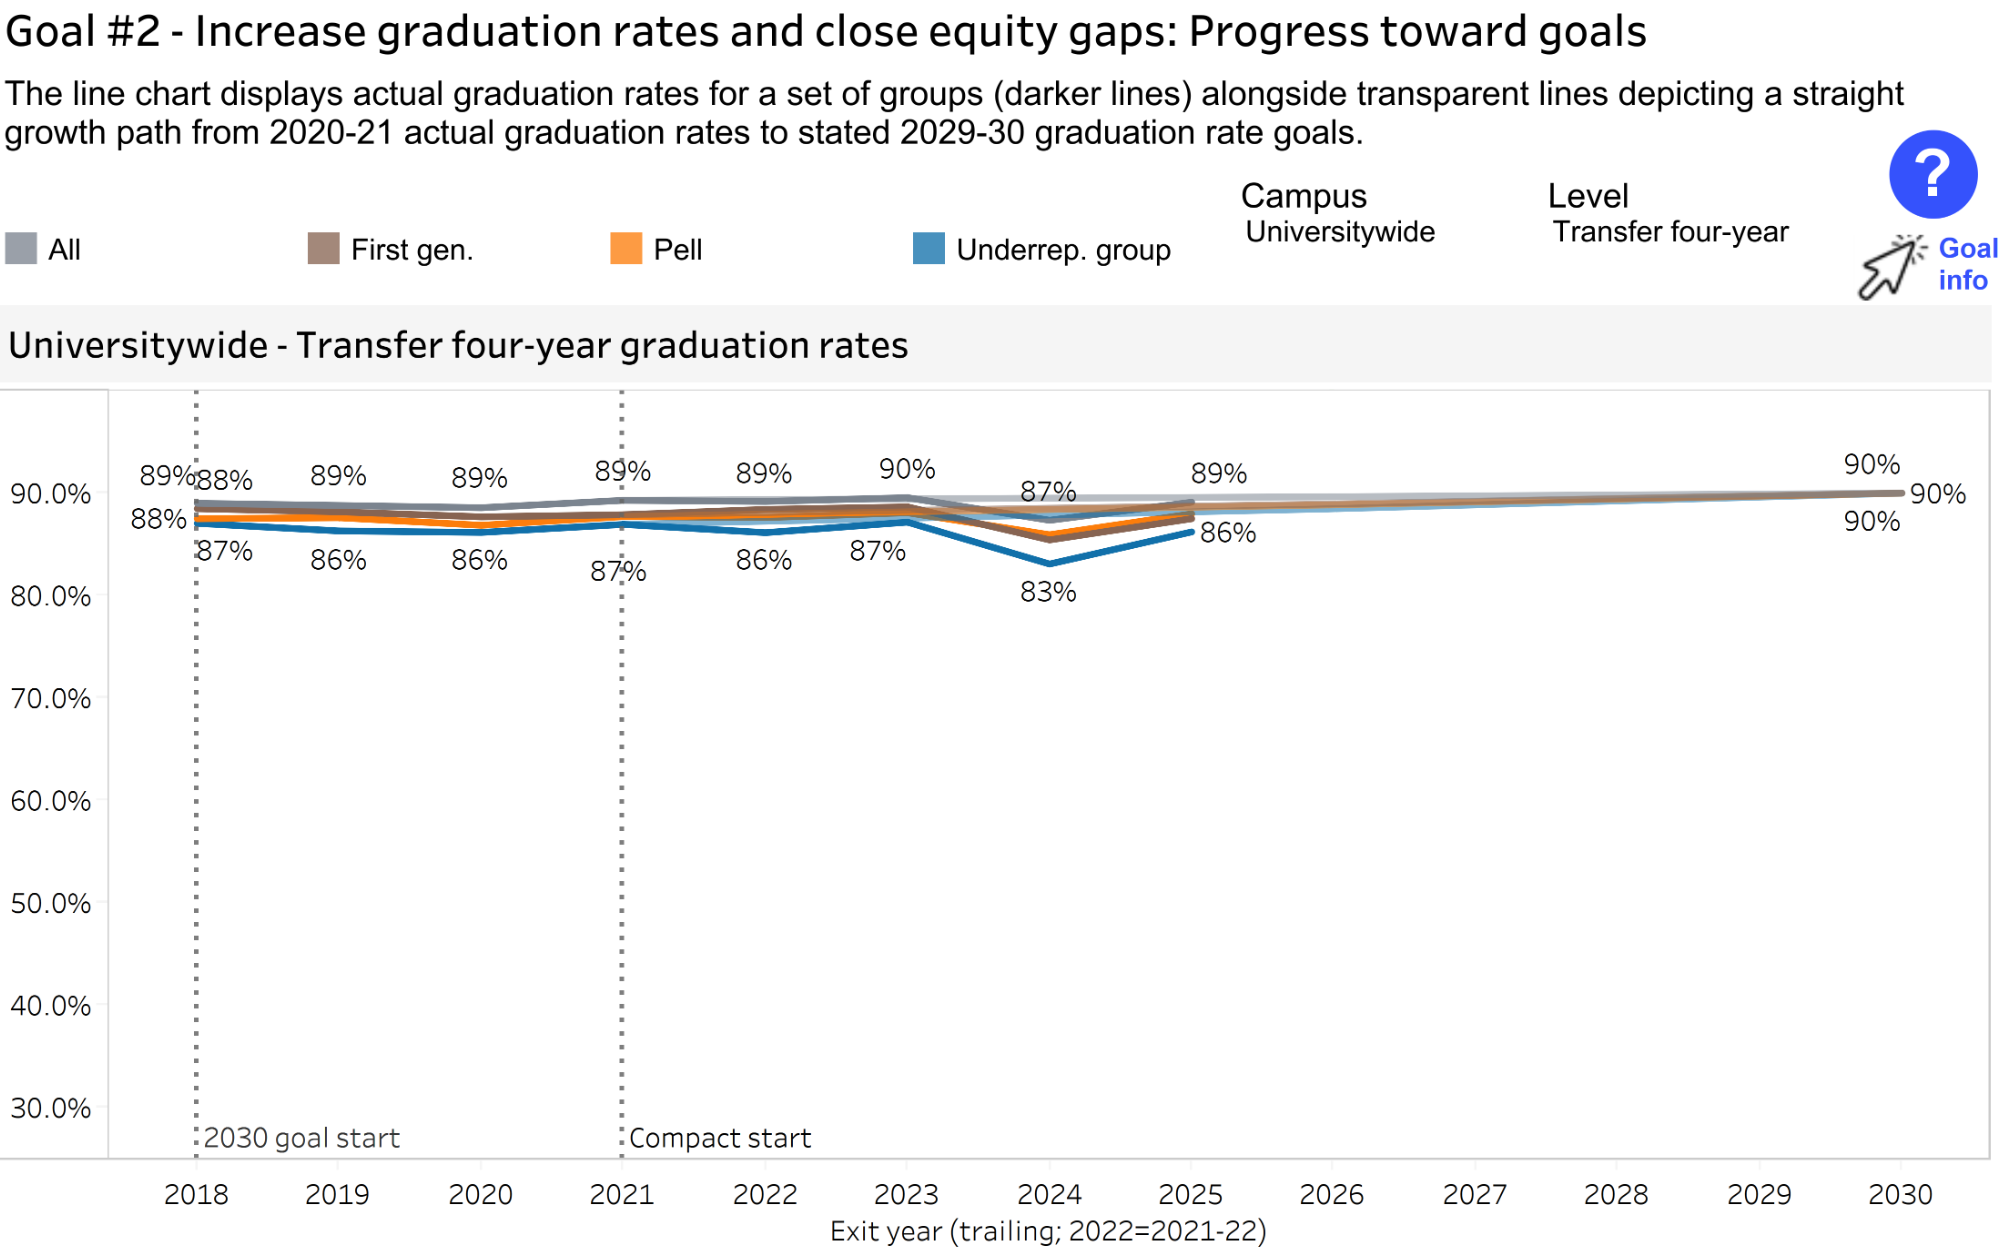
For the 2025 exit cohort, the four-year transfer rate reflects students who entered UC as transfers in fall 2021, during the pandemic period. The current overall transfer four-year graduation rate is 89 percent, up from 87 percent for the prior cohort and within one percentage point of the 2030 goal of 90 percent. This increase follows a decline for the previous cohort, which may have been affected by pandemic-era disruptions before and after transfer.
Four-year transfer graduation rates also increased in the latest year for first-generation students, Pell Grant recipients, and students from racial/ethnic groups historically underrepresented in higher education. In the 2025 exit cohort, first-generation students and Pell Grant recipients are within one percentage point of the overall transfer rate, while students in these racial/ethnic groups are three percentage points below the overall rate.
Transfer graduation rates are close to UC’s 2030 goals, and differences across student groups are smaller than those seen for freshmen.
4.2.3 Overall transfer two- and four-year graduation rates by student group, fall 2023 and fall 2021 entering cohort
Undergraduate graduation rates dashboard
source: UC Information Center
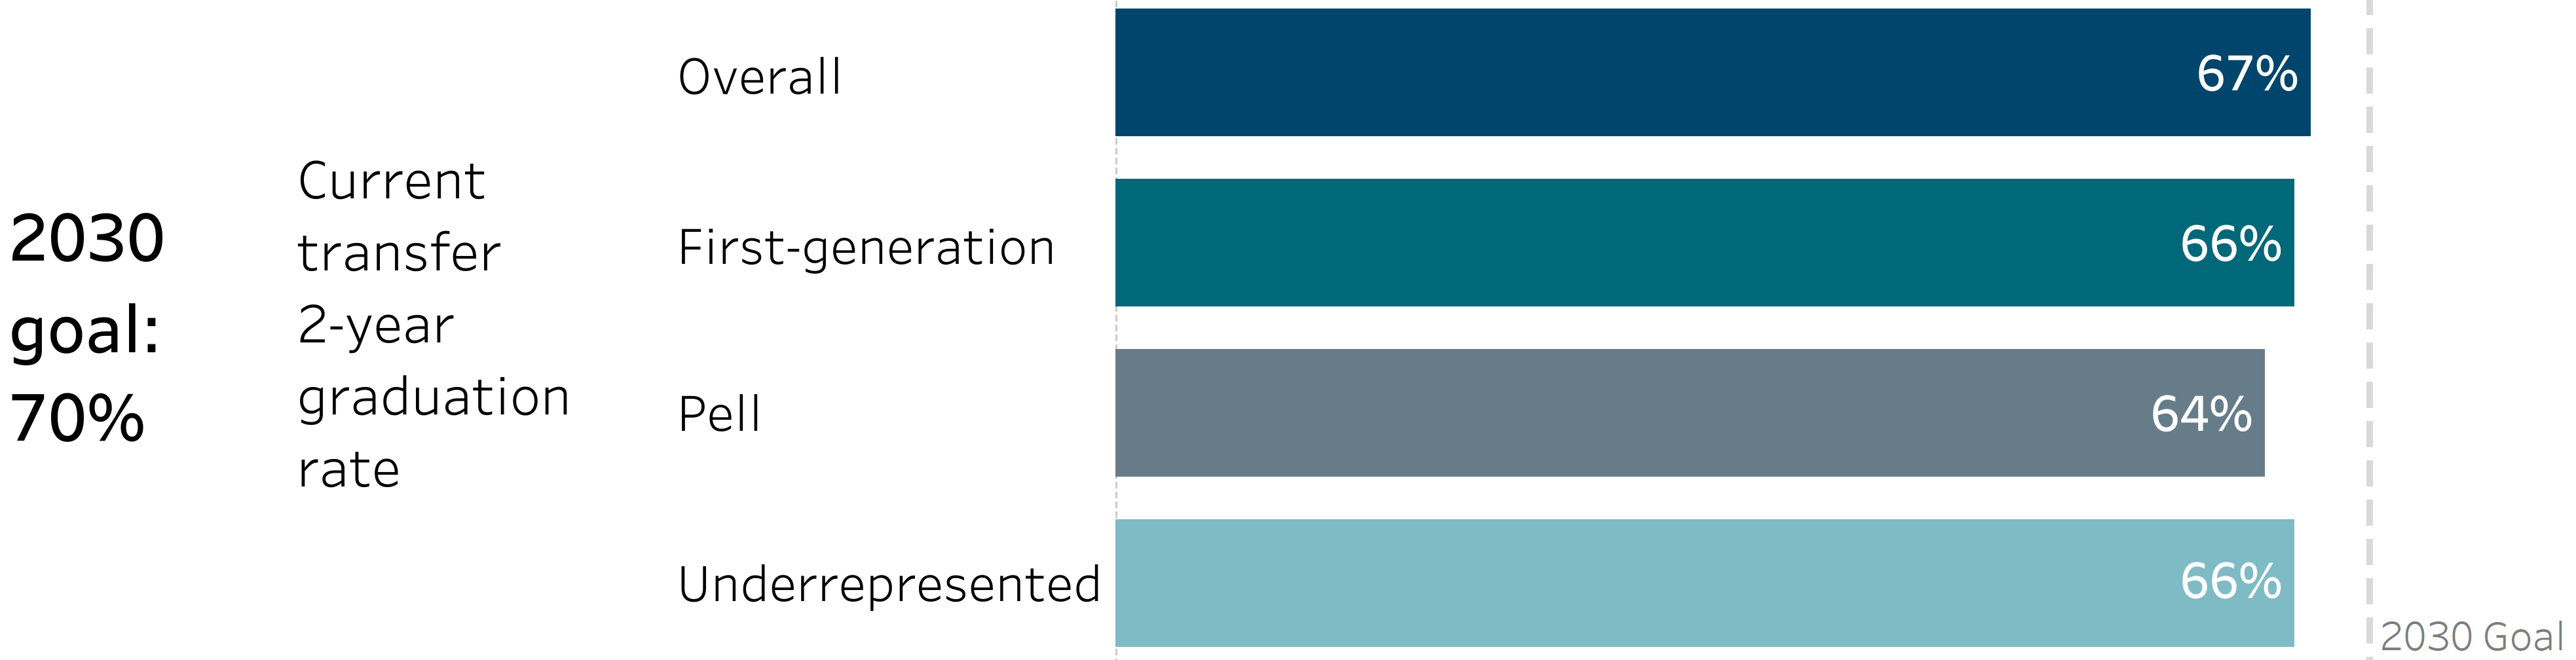
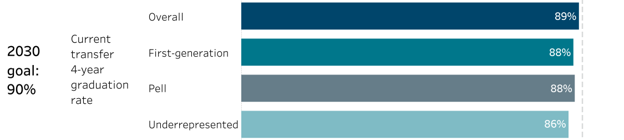
UC’s 2030 goals include increasing the two-year transfer graduation rate to 70 percent and the four-year transfer graduation rate to 90 percent, while ensuring that first-generation students, Pell Grant recipients, and students from racial/ethnic groups historically underrepresented in higher education have outcomes comparable to the overall transfer graduation rate. Current transfer graduation rates are within a few percentage points of these goals. The two-year transfer graduation rate is 67 percent, three percentage points below the 2030 goal, and the four-year transfer graduation rate is 89 percent, one percentage point below the 2030 goal.
Differences across student groups are smaller for transfer students than for freshmen, particularly in four-year graduation rates. Two-year graduation rates are 66 percent for first-generation students, 64 percent for Pell Grant recipients, and 66 percent for students from racial/ethnic groups historically underrepresented in higher education, compared with 67 percent overall. Four-year graduation rates are 88 percent for first-generation students and Pell Grant recipients, and 86 percent for students in these racial/ethnic groups, compared with 89 percent overall.
These results show that UC is very close to its transfer completion goals. Graduation rates are not yet comparable across all transfer student groups, but differences across groups are smaller than in freshman graduation outcomes.
note: Beginning with this indicator, the remaining indicators in this section use entering cohorts rather than exit cohorts to examine transfer graduation, time to degree, GPA patterns, and retention across cohorts and student groups.
Transfer students are completing UC degrees faster than earlier cohorts, bringing average time to degree closer to two years after transfer.
4.2.4 Transfer average time to degree by entering cohort
Undergraduate graduation rates dashboard | Graduation rates
source: UC Information Center
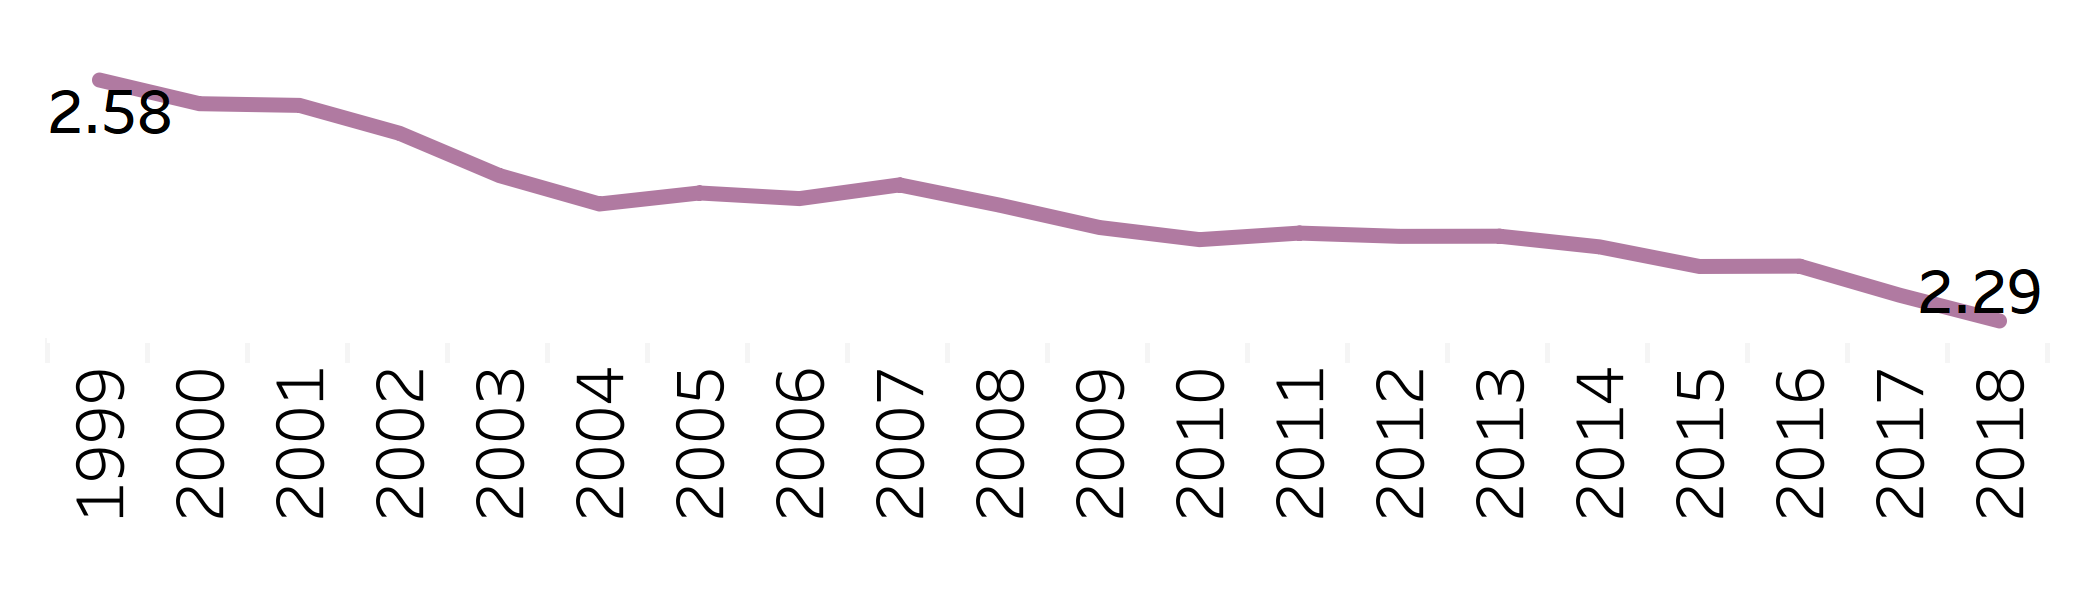
Average time to degree for UC transfer students has declined steadily since 1999. Students in the fall 2018 transfer entering cohort, which entered before the pandemic period, completed their bachelor’s degrees in an average of 2.29 years, compared with 2.58 years for the fall 1999 cohort. This decline of 0.29 years, or about three and a half months, brings average completion closer to the expected two-year timeframe after transfer.
note: Average time to degree only includes students who graduated from UC within seven years.
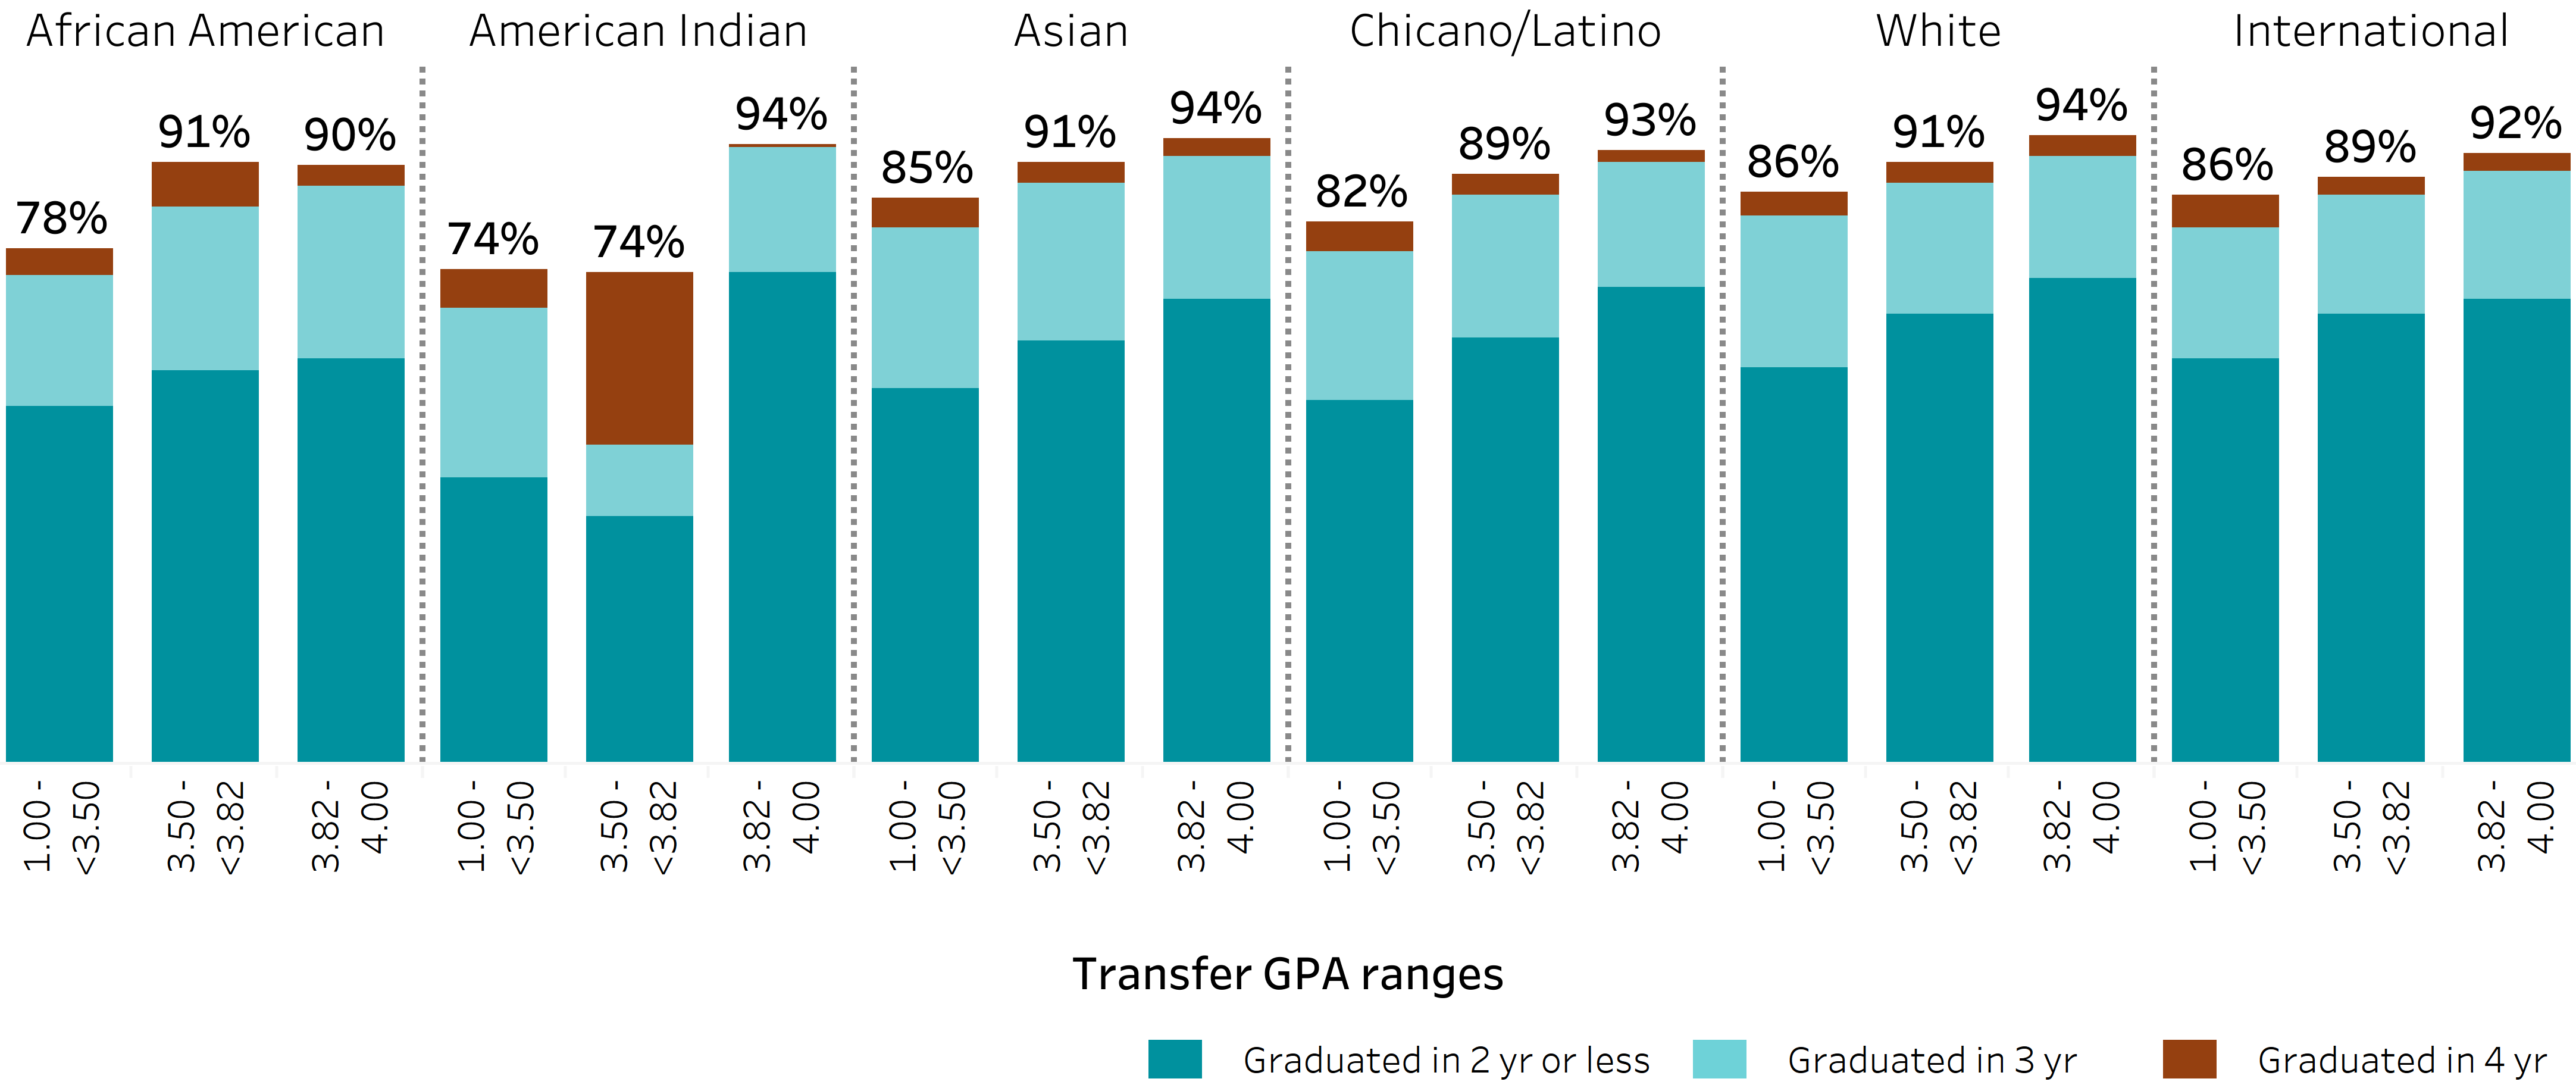
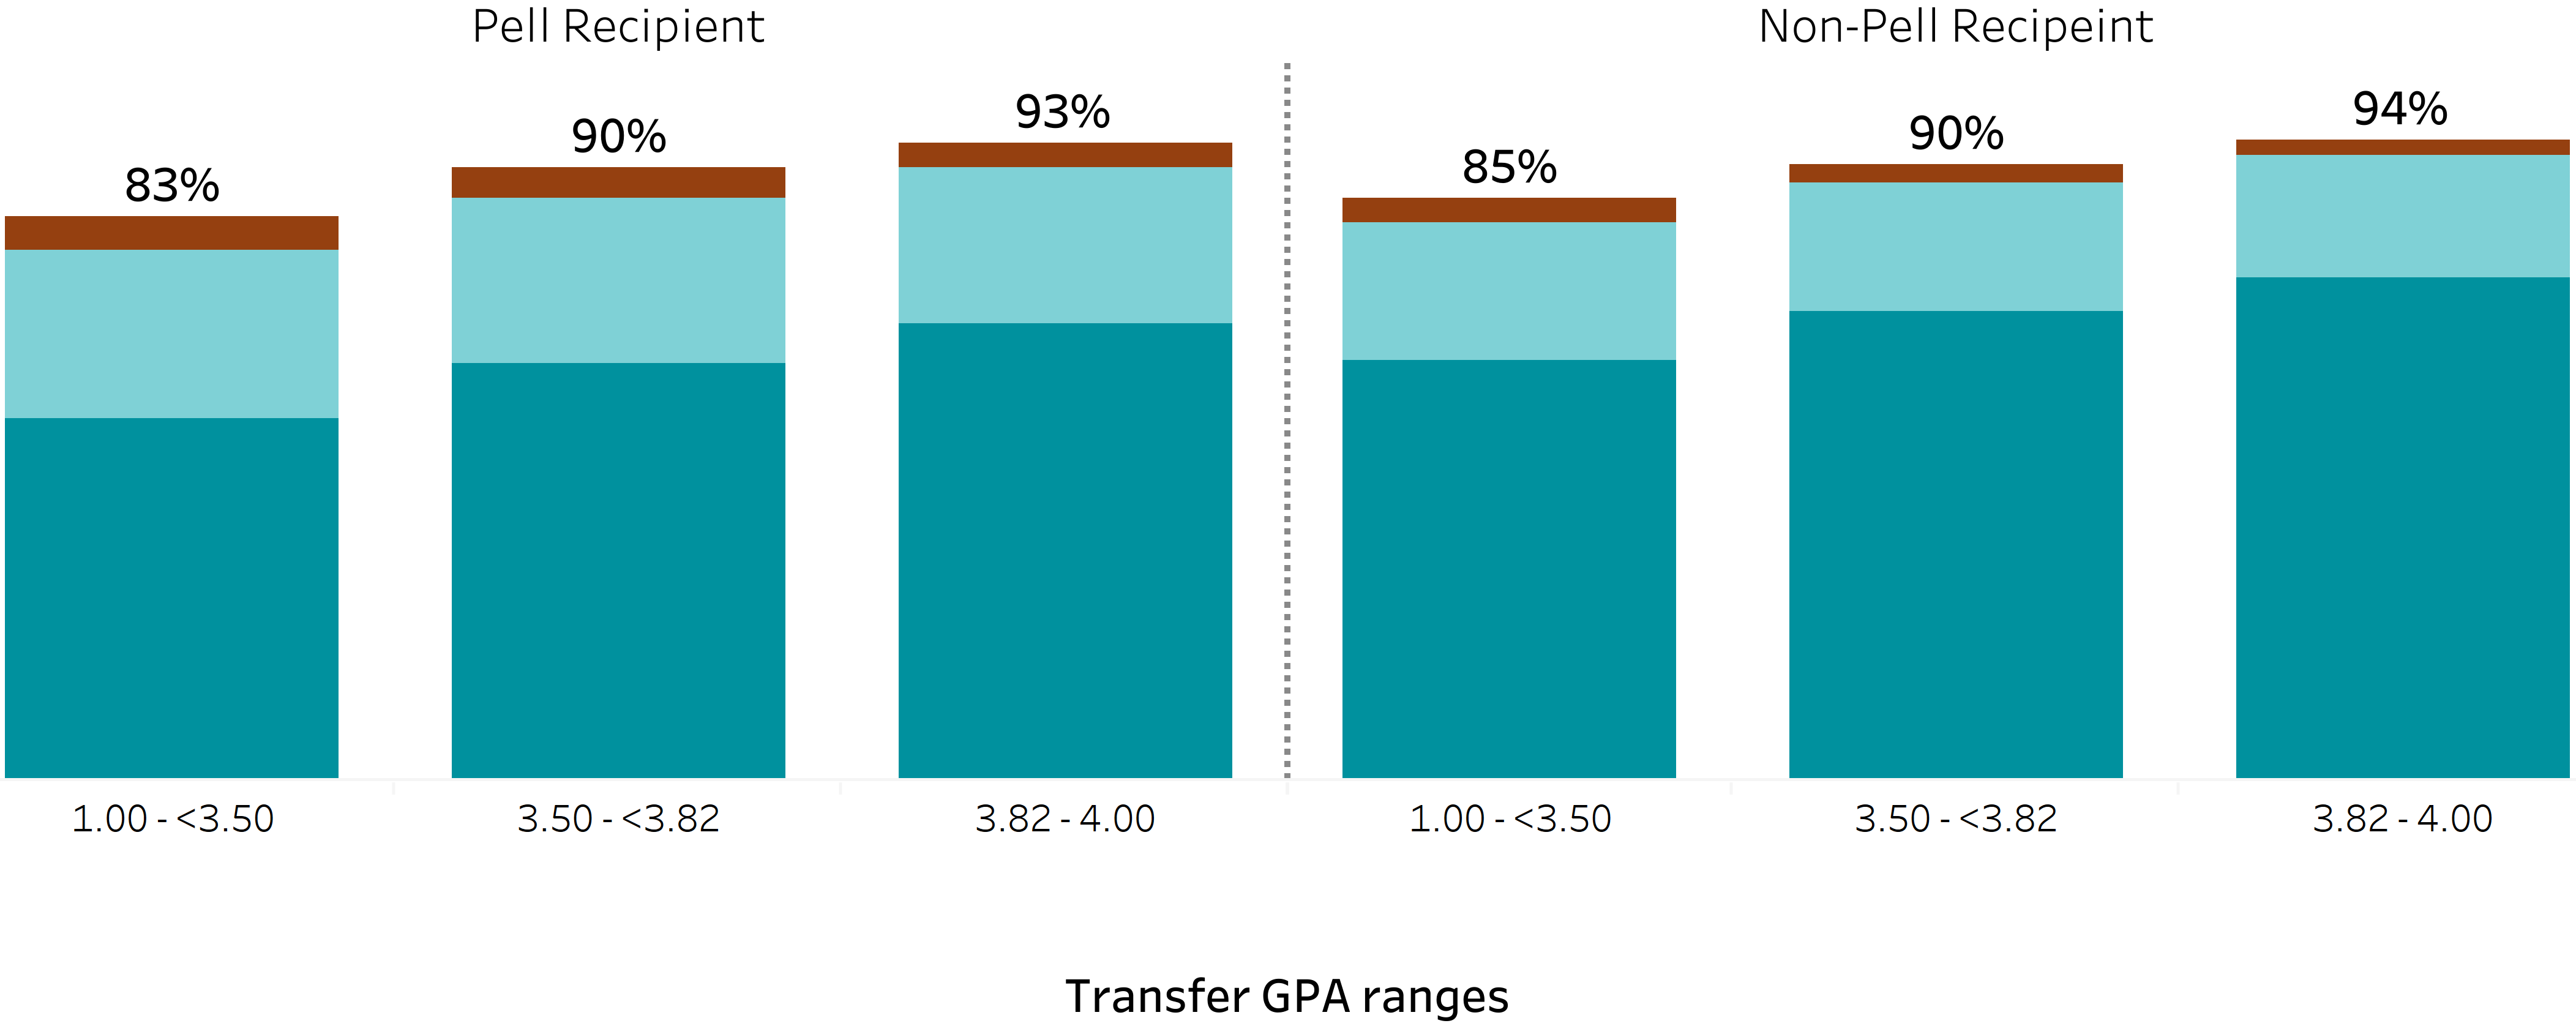
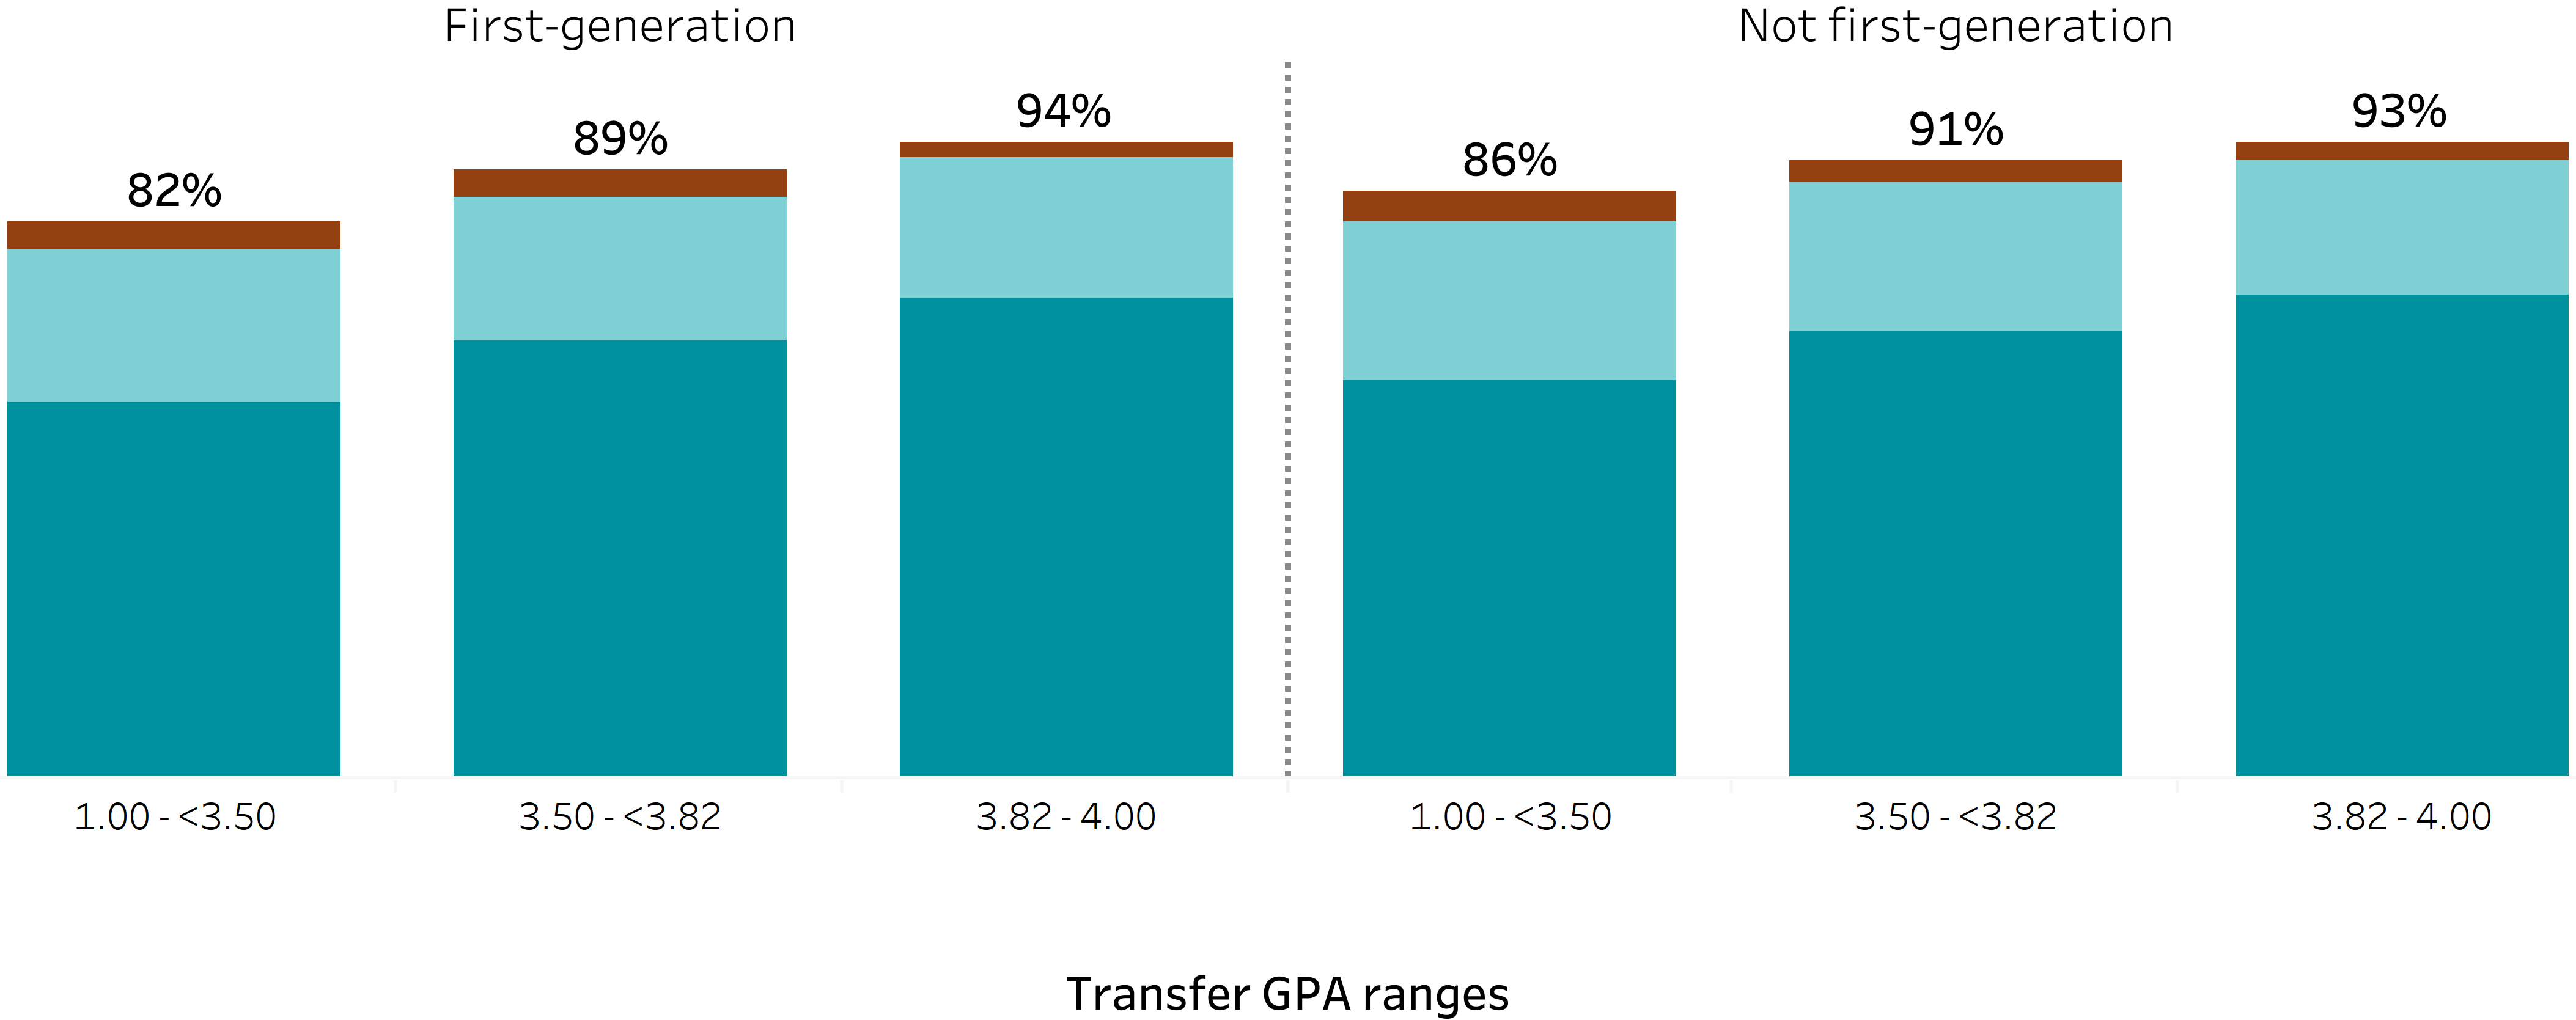
Higher transfer GPA is associated with higher four-year completion, but transfer graduation outcomes still vary within GPA ranges across student groups.
4.2.5 Transfer four-year graduation rates by transfer GPA and student group, fall 2021 entering cohort
Undergraduate graduation rates dashboard | Graduation rates by GPA groups
Ethnicity
Pell Grant
First-generation
source: UC Information Center
Incoming transfer GPA is strongly associated with four-year graduation outcomes for transfer students. The GPA ranges shown here are cohort-specific tercile ranges: within each transfer entering cohort, cutpoints are set at the 33.3rd and 66.7th percentiles of the systemwide unweighted incoming transfer GPA distribution, creating approximately three equal-sized groups. For the fall 2021 transfer entering cohort, these cutpoints produced three GPA ranges: 1.00 to below 3.50, 3.50 to below 3.82, and 3.82 to 4.00.
Across the student groups shown, four-year graduation rates generally rise as incoming transfer GPA ranges increase. For example, rates increased from 82 percent to 89 percent to 94 percent for first-generation transfer students, and from 86 percent to 91 percent to 93 percent for non-first-generation transfer students. Similar patterns are visible for Pell Grant recipients and non-recipients and across most racial/ethnic groups shown, though rates still differ by student group within the same GPA range.
These patterns suggest that incoming transfer GPA is important but does not fully explain transfer graduation outcomes. Students with similar incoming transfer GPAs can have different completion rates by race/ethnicity, Pell Grant recipient status, and first-generation status. As UC works to improve transfer graduation rates across student groups, these findings point to the importance of equitable educational opportunity prior to transfer, as well as effective advising, course access, financial assistance, and institutional practices that support transfer students after they arrive at UC.
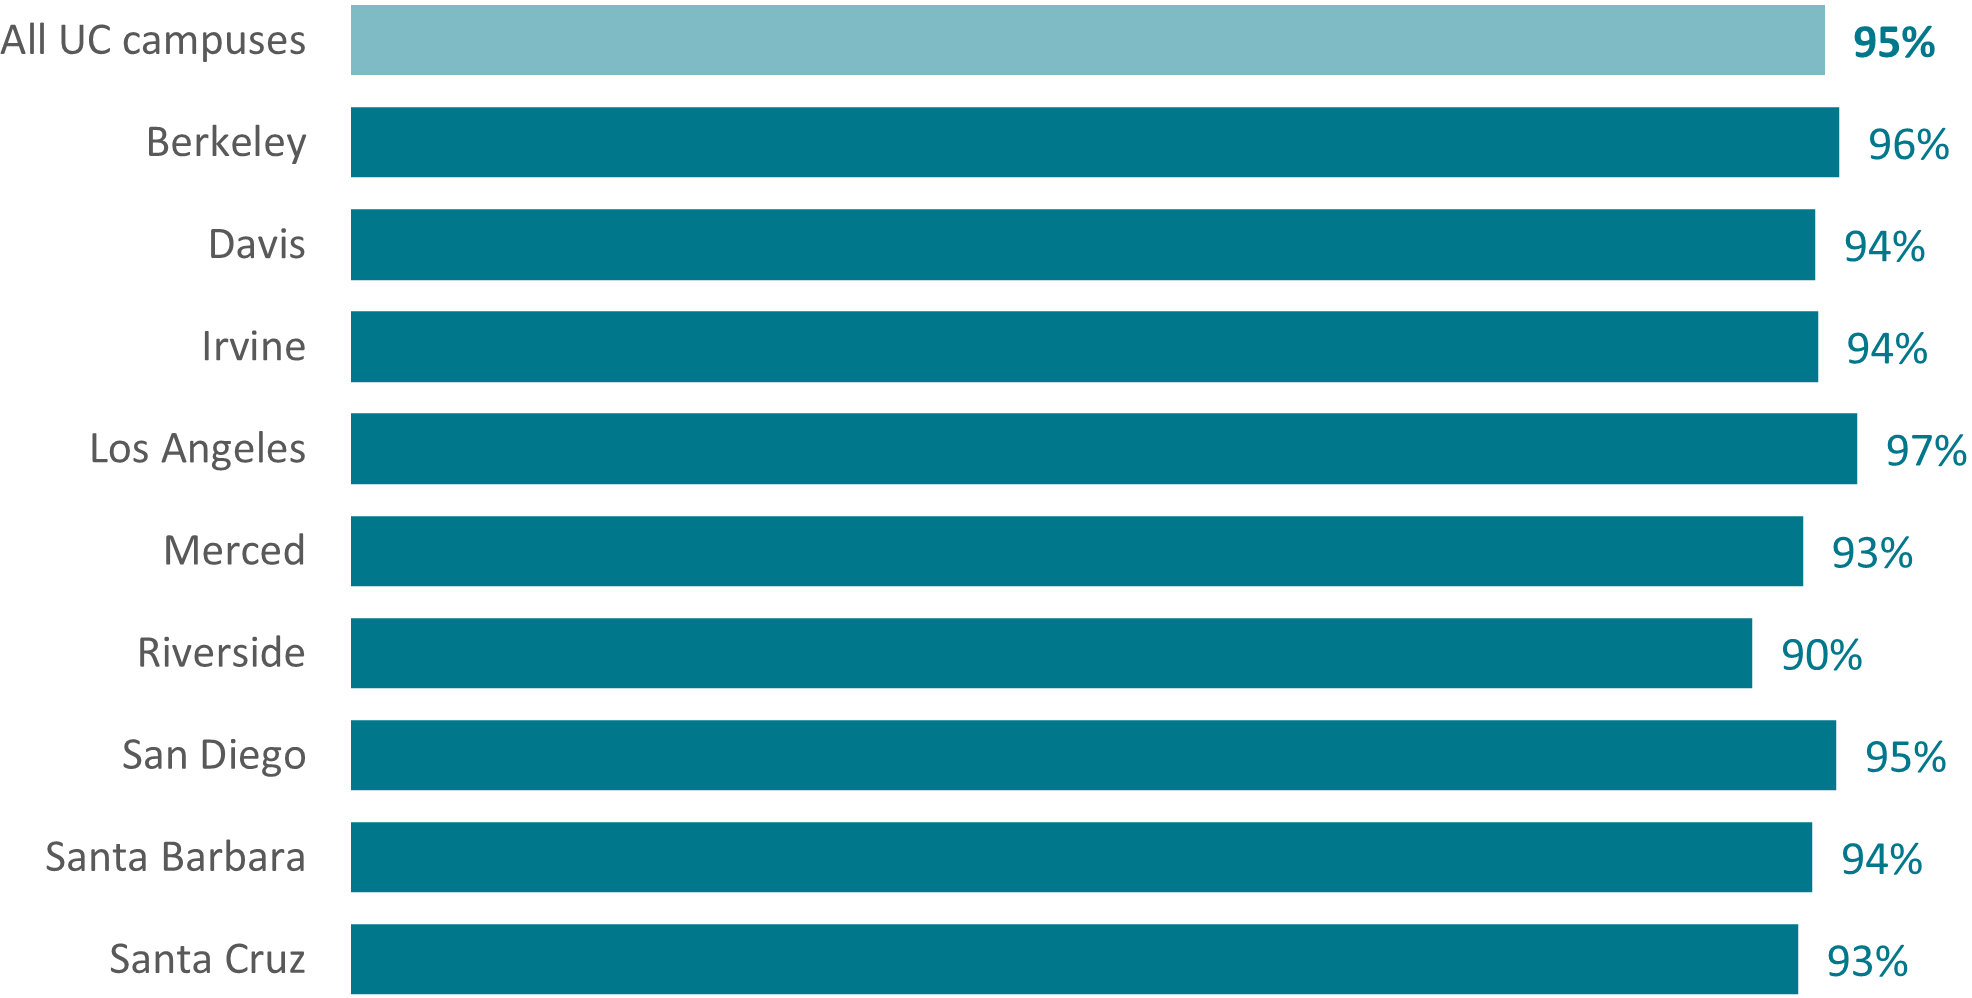
Transfer retention remains high across UC campuses, supporting continued progress toward transfer graduation goals.
4.2.6 First-year retention rates for UC transfer students, fall 2024 entering cohort
source: Transfer data from UC Data Warehouse
First-year retention rates for transfer students are high across UC. For transfer students entering in fall 2024, the Universitywide first-year retention rate was 95 percent. Campus rates ranged from 90 percent at Riverside to 97 percent at UCLA, and every UC campus retained at least 90 percent of transfer students after the first year.
Strong first-year retention is an encouraging early indicator of transfer student success and may support continued progress toward UC’s transfer graduation goals. The next section examines whether these high retention rates are shared across first-generation students, Pell Grant recipients, and students from racial/ethnic groups historically underrepresented in higher education.
note: Comparison data are not available for transfers.
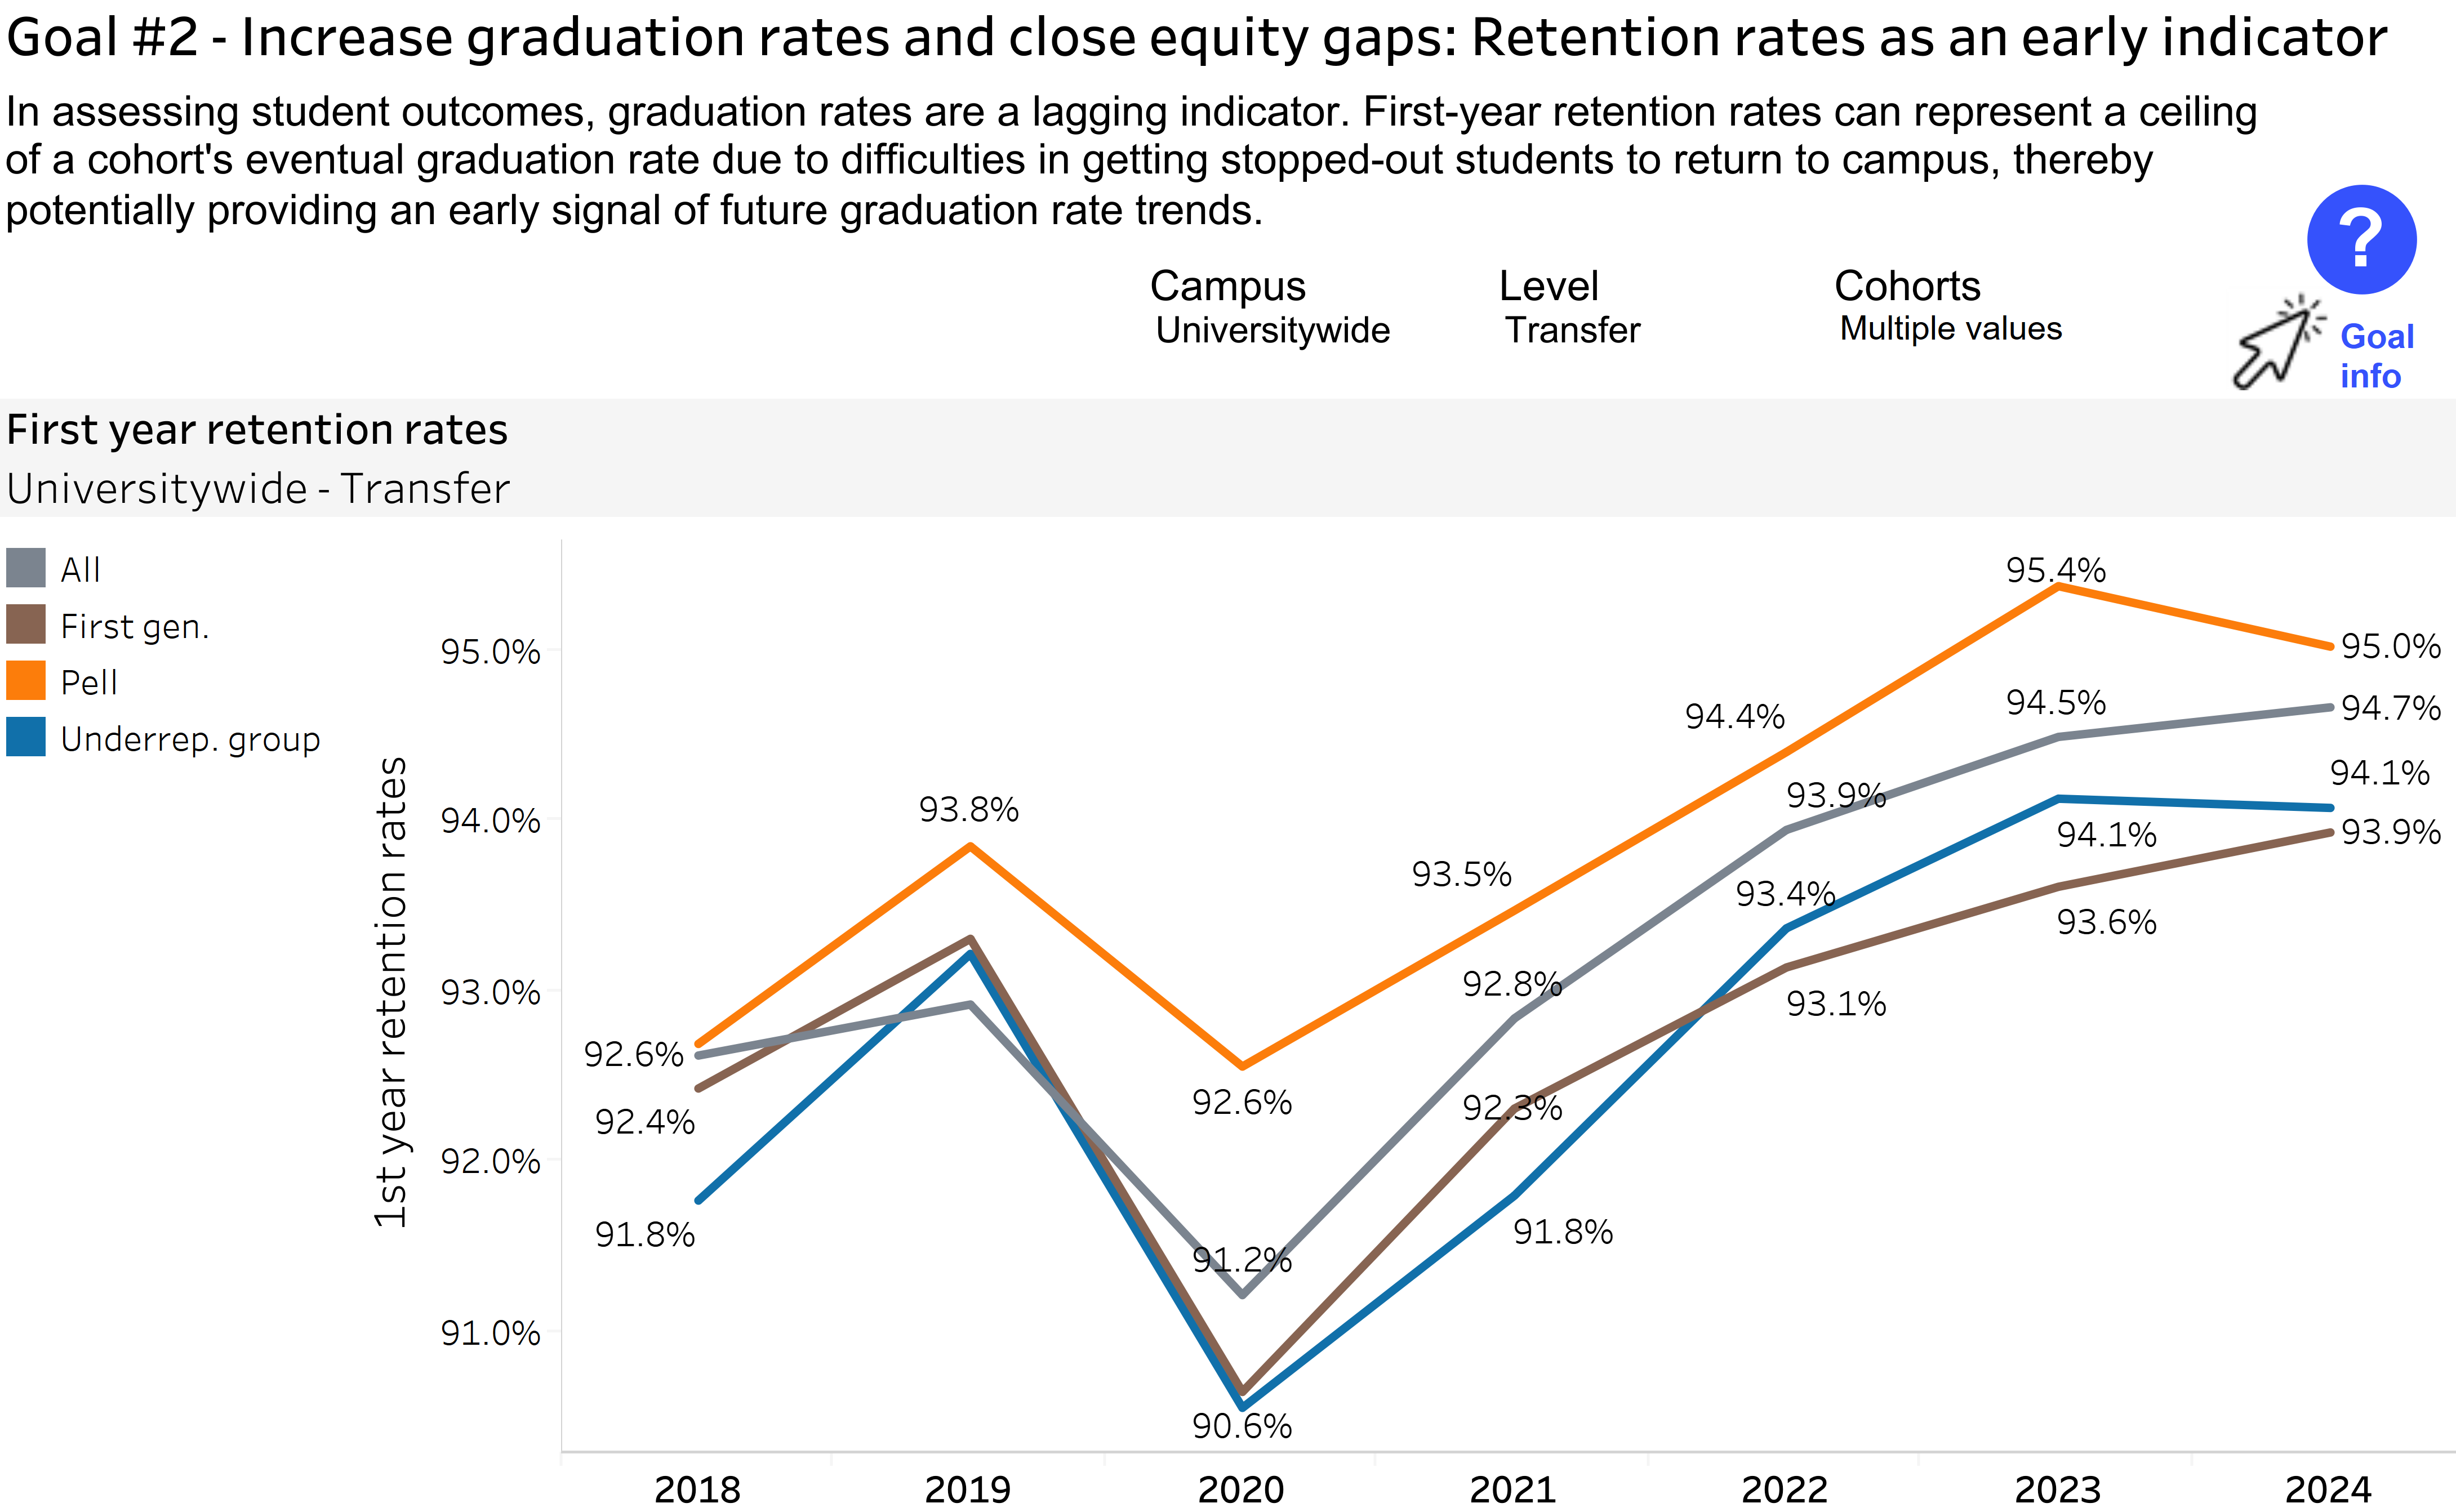
Transfer retention is high across student groups, with all groups within about one percentage point of the overall rate.
4.2.7 First-year transfer retention rate by student group
UC 2030 dashboard | Goal #2 - Retention rates
source: UC Information Center
First-year retention rates for transfer students remain high across UC and have recovered from the decline seen for the fall 2020 cohort, which entered during the pandemic period. For the fall 2024 transfer entering cohort, which entered after the pandemic period, the overall first-year transfer retention rate was 95 percent. Retention for first-generation students, Pell Grant recipients, and students from racial/ethnic groups historically underrepresented in higher education was within about one percentage point of the overall rate, with Pell Grant recipients slightly exceeding it.
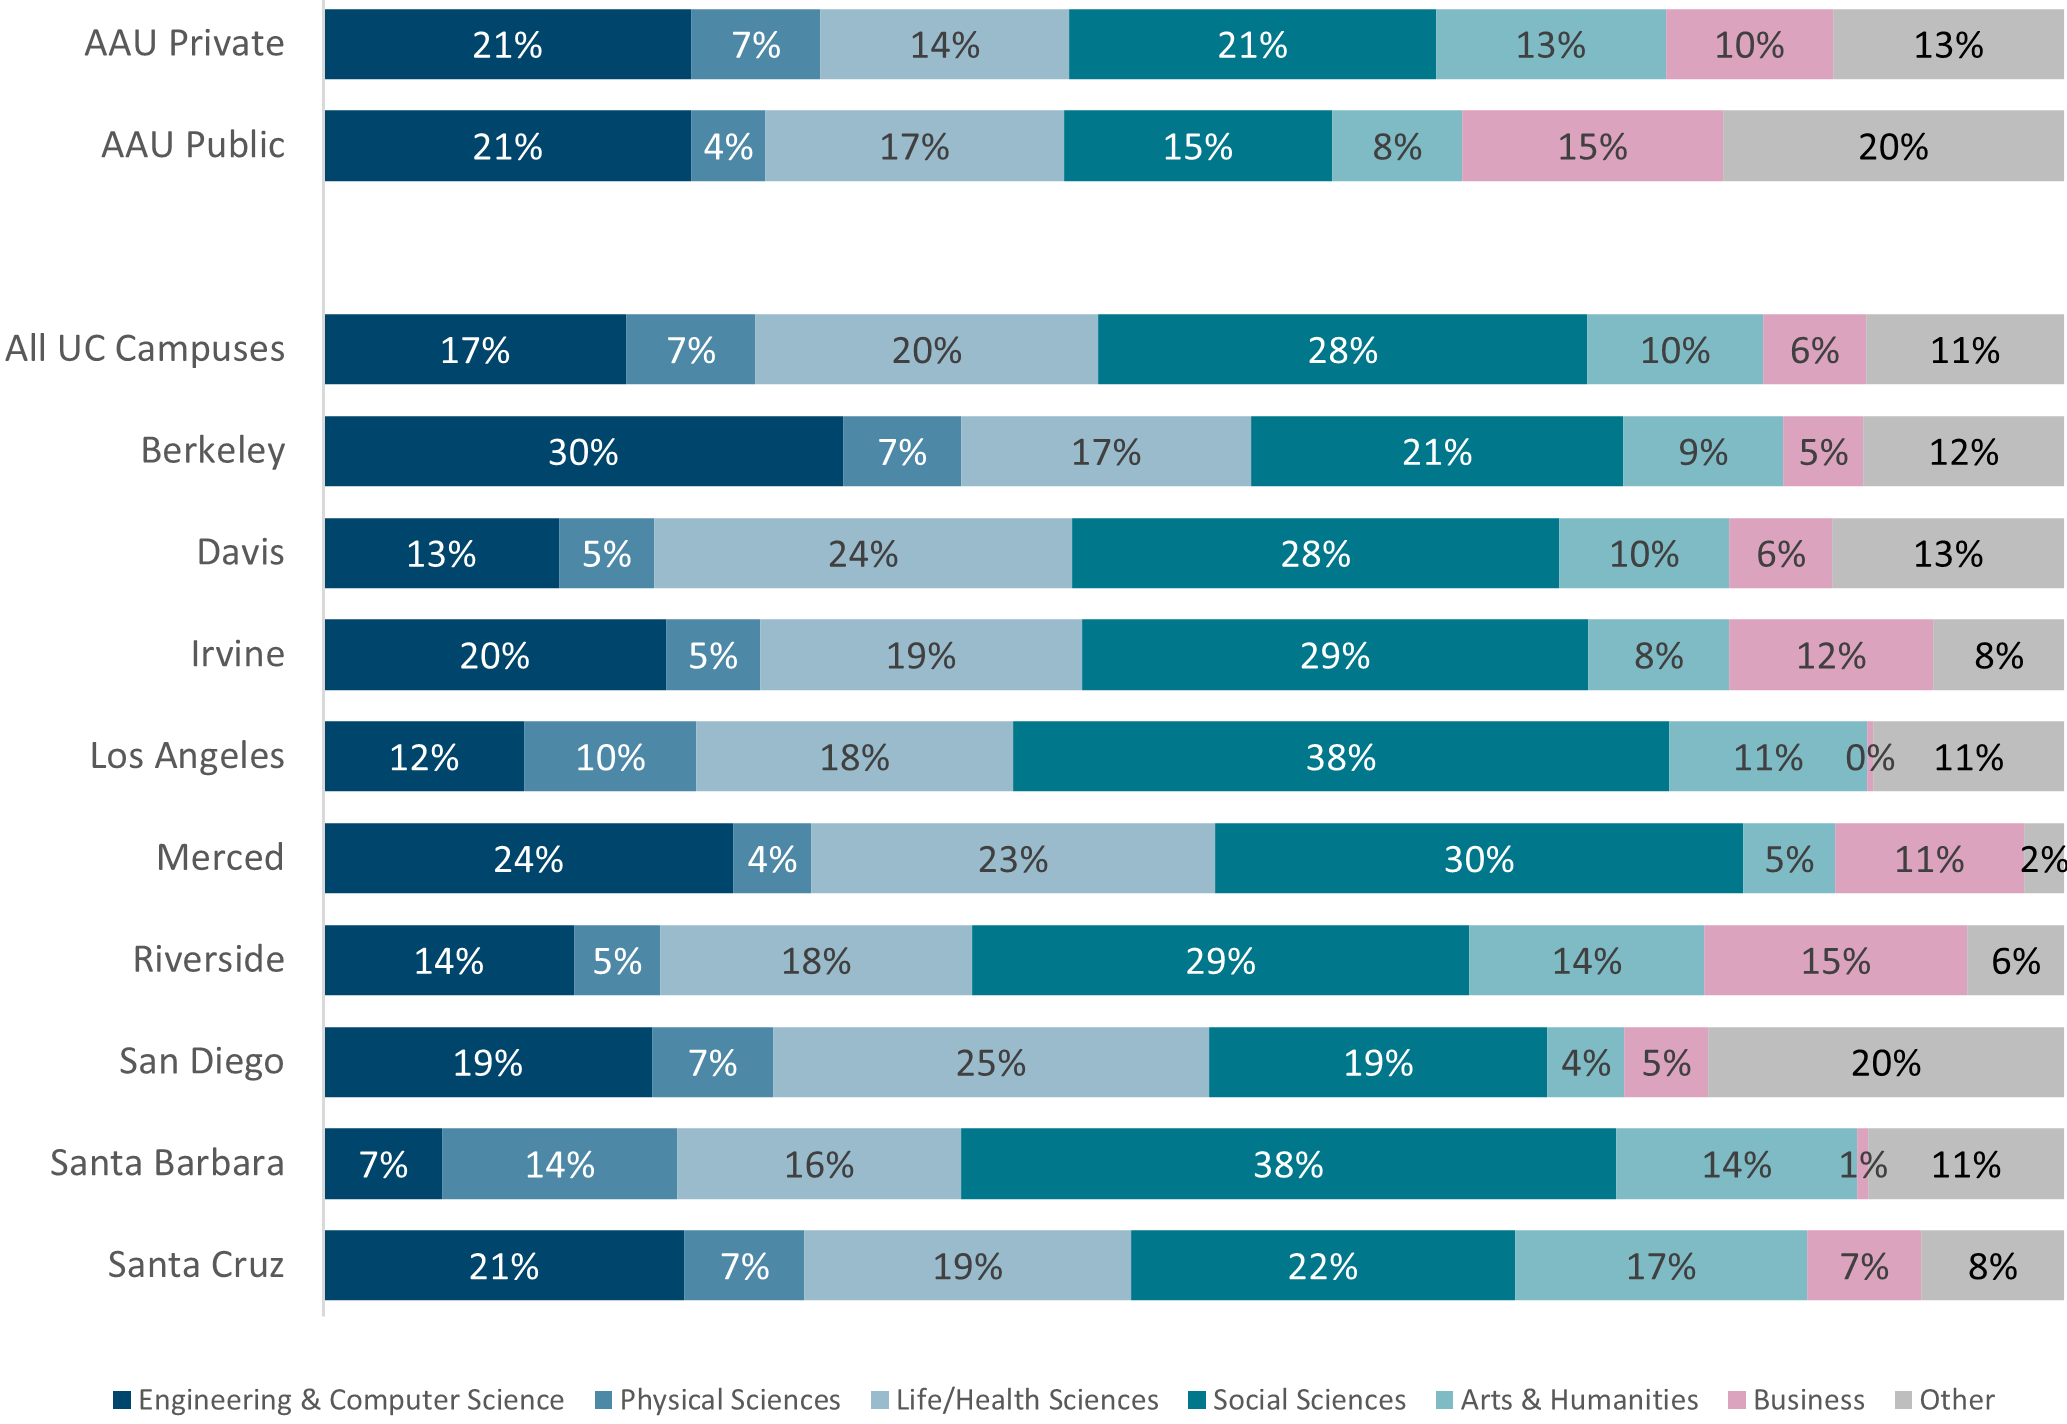
UC awards degrees across a broad range of fields, with social sciences, life/health sciences, and engineering and computer science accounting for the largest shares. UC’s STEM share is similar to that of AAU comparison institutions.
4.3.1 Undergraduate degrees awarded by discipline, UC and comparison institutions, 2022–23
source: IPEDS
UC awards bachelor’s degrees across a broad range of disciplines, with the largest shares in social sciences, life/health sciences, and engineering and computer science. In 2022–23, social sciences accounted for 28 percent of UC undergraduate degrees, followed by life/health sciences at 20 percent and engineering and computer science at 17 percent. Together with physical sciences, STEM fields accounted for 44 percent of UC undergraduate degrees.
UC’s overall STEM share is similar to that of AAU public and private comparison institutions, but UC’s discipline mix differs in some areas. UC awards a larger share of degrees in social sciences than AAU public and private institutions and a smaller share in business and “other” fields. Across UC campuses, the distribution of degrees varies, reflecting differences in campus academic programs, student interests, and enrollment patterns.
More information on degrees awarded can be found at the UC degrees awarded data tables dashboard on the UC Information Center.
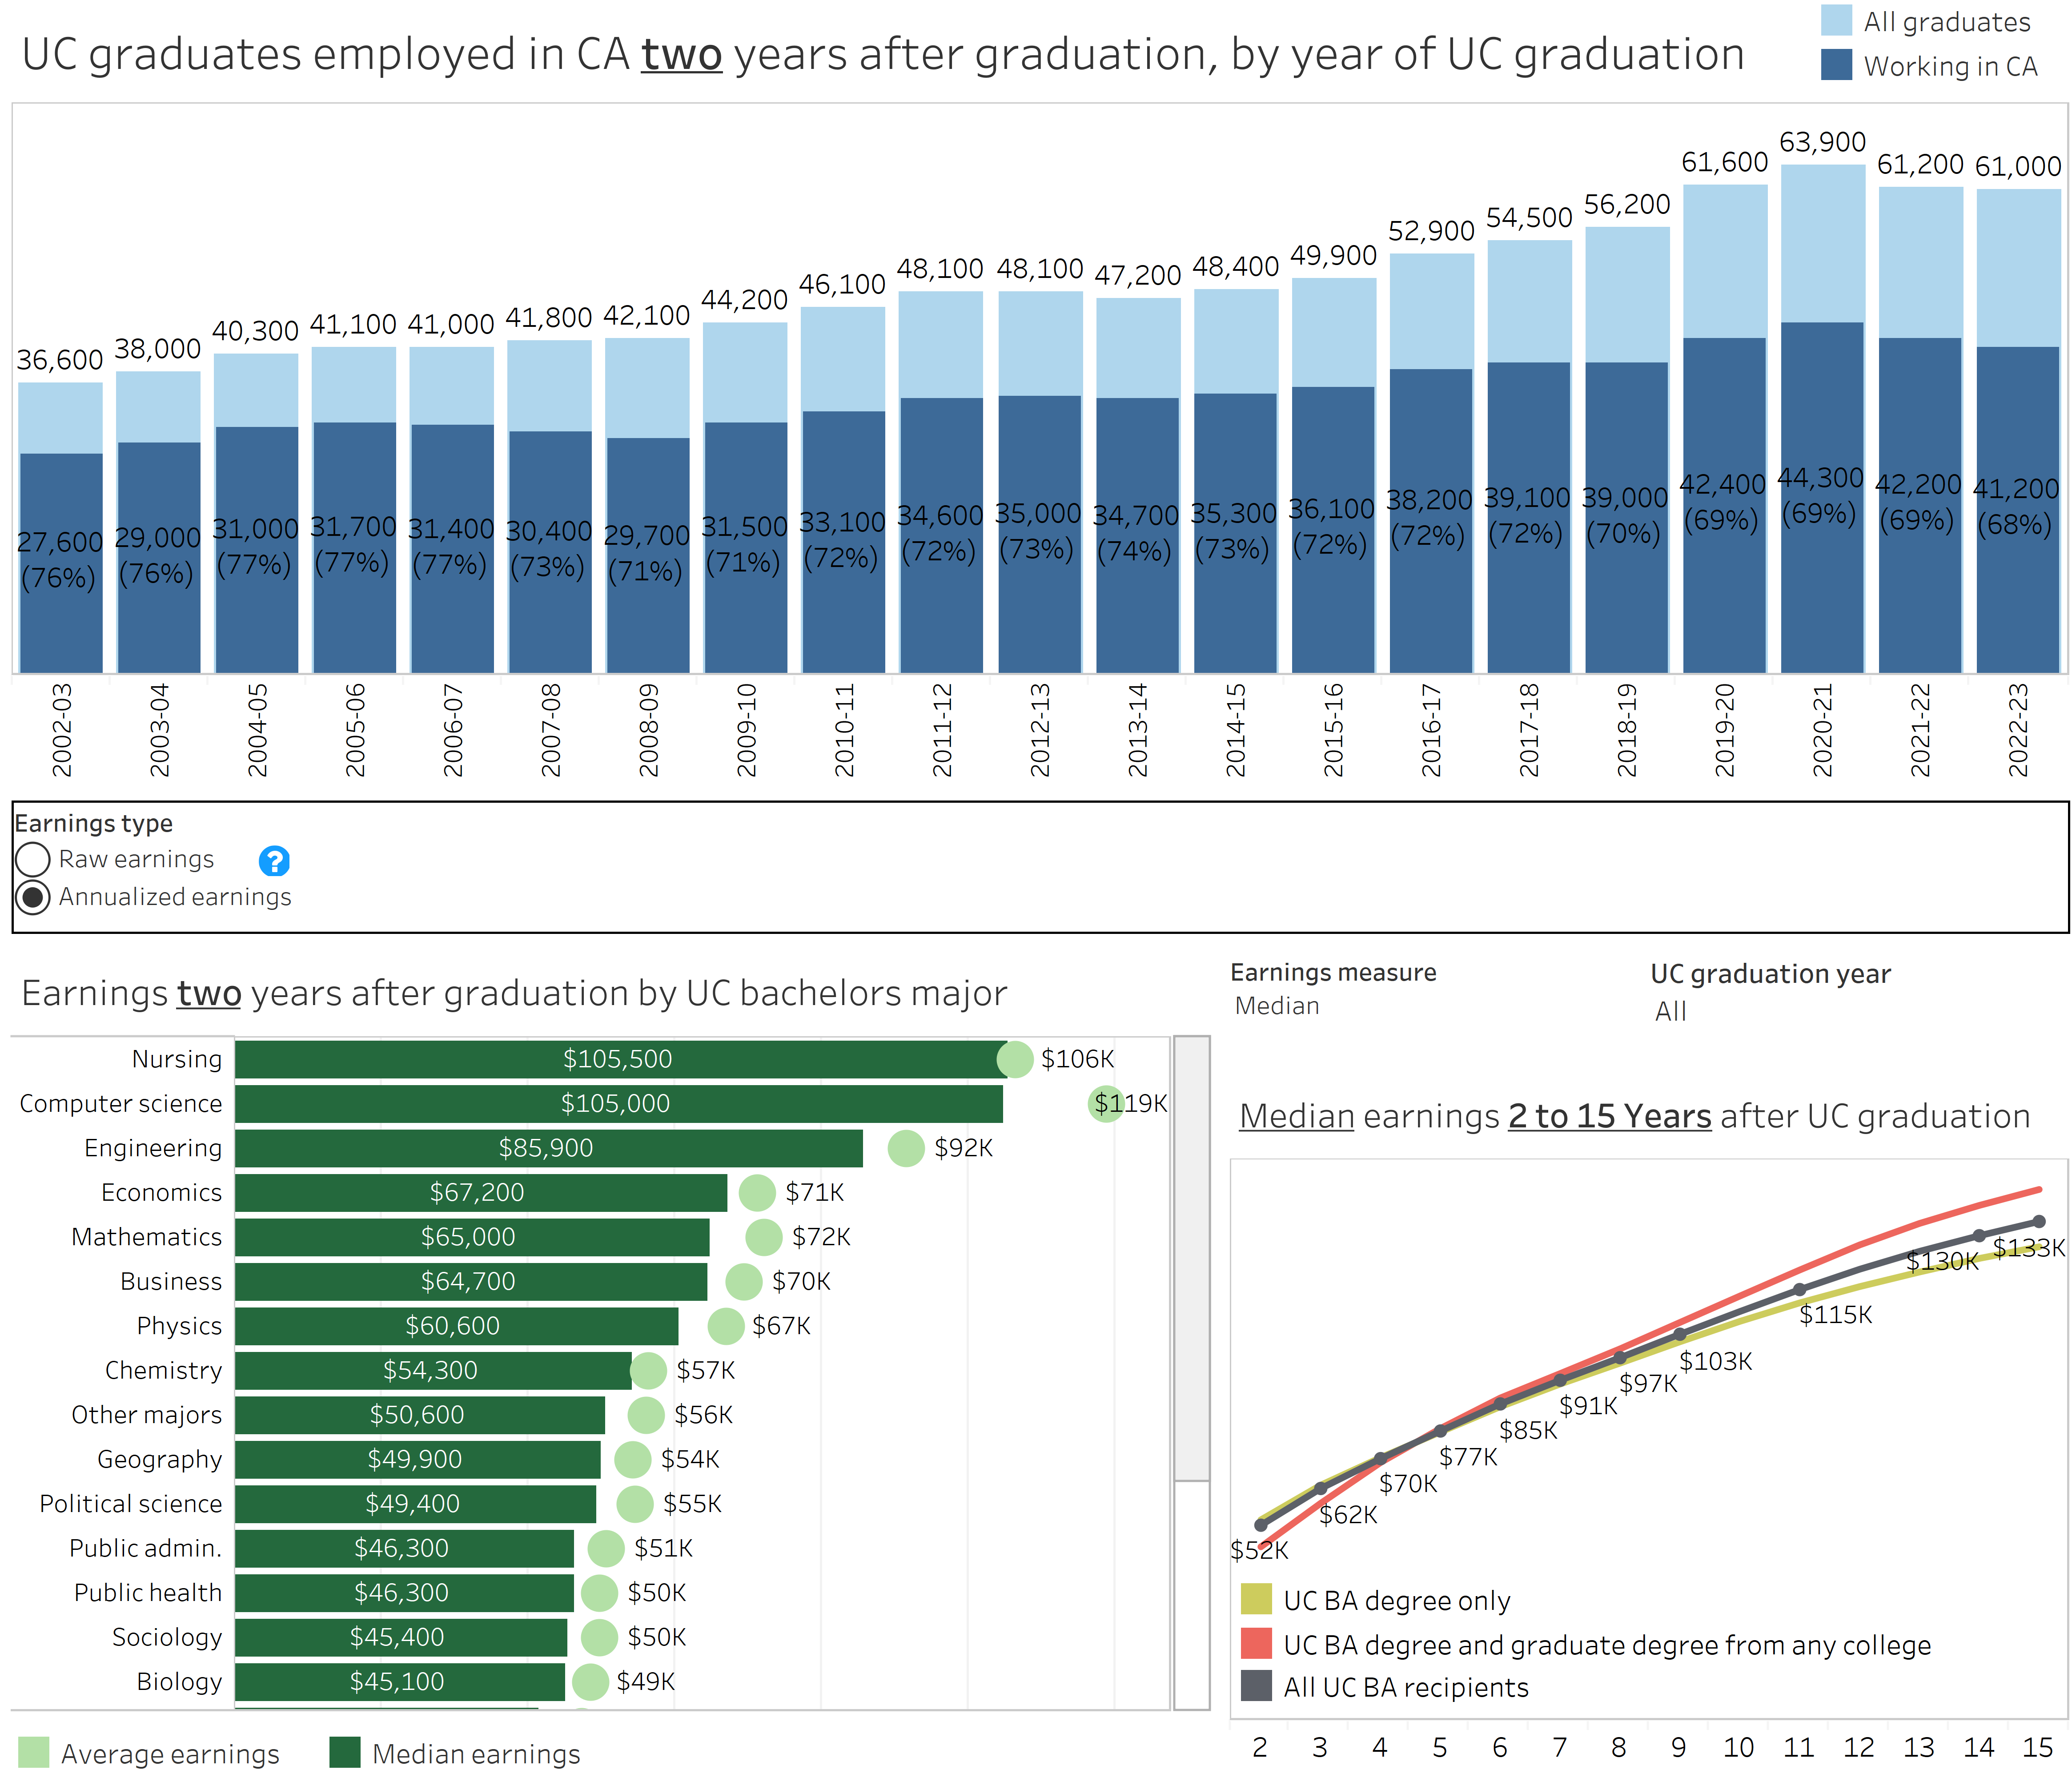
UC graduates employed in California experience substantial earnings growth over time, with early-career earnings varying by major.
4.3.2 Inflation-adjusted two-year earnings by selected major and median earnings two to fifteen years after graduation, Universitywide
UC undergraduate alumni outcomes in California dashboard | Earnings
source: UC Information Center
UC undergraduate alumni make major contributions to California’s workforce. Among recent cohorts, more than 60,000 students earn UC bachelor’s degrees each year, and about 68 to 69 percent are employed in California two years after graduation. Among those employed in California, two-year median earnings vary by major, with nursing and computer science graduates earning above $100,000 and engineering graduates earning about $86,000.
Earnings for UC bachelor’s graduates grow substantially over time. Median earnings rise from about $52,000 two years after graduation to more than $100,000 within a decade, and graduates more than double their earnings between two and ten years after graduation across most disciplines.
note: Includes alumni employed in the state of California only. Amounts are inflation-adjusted to 2023 dollars.
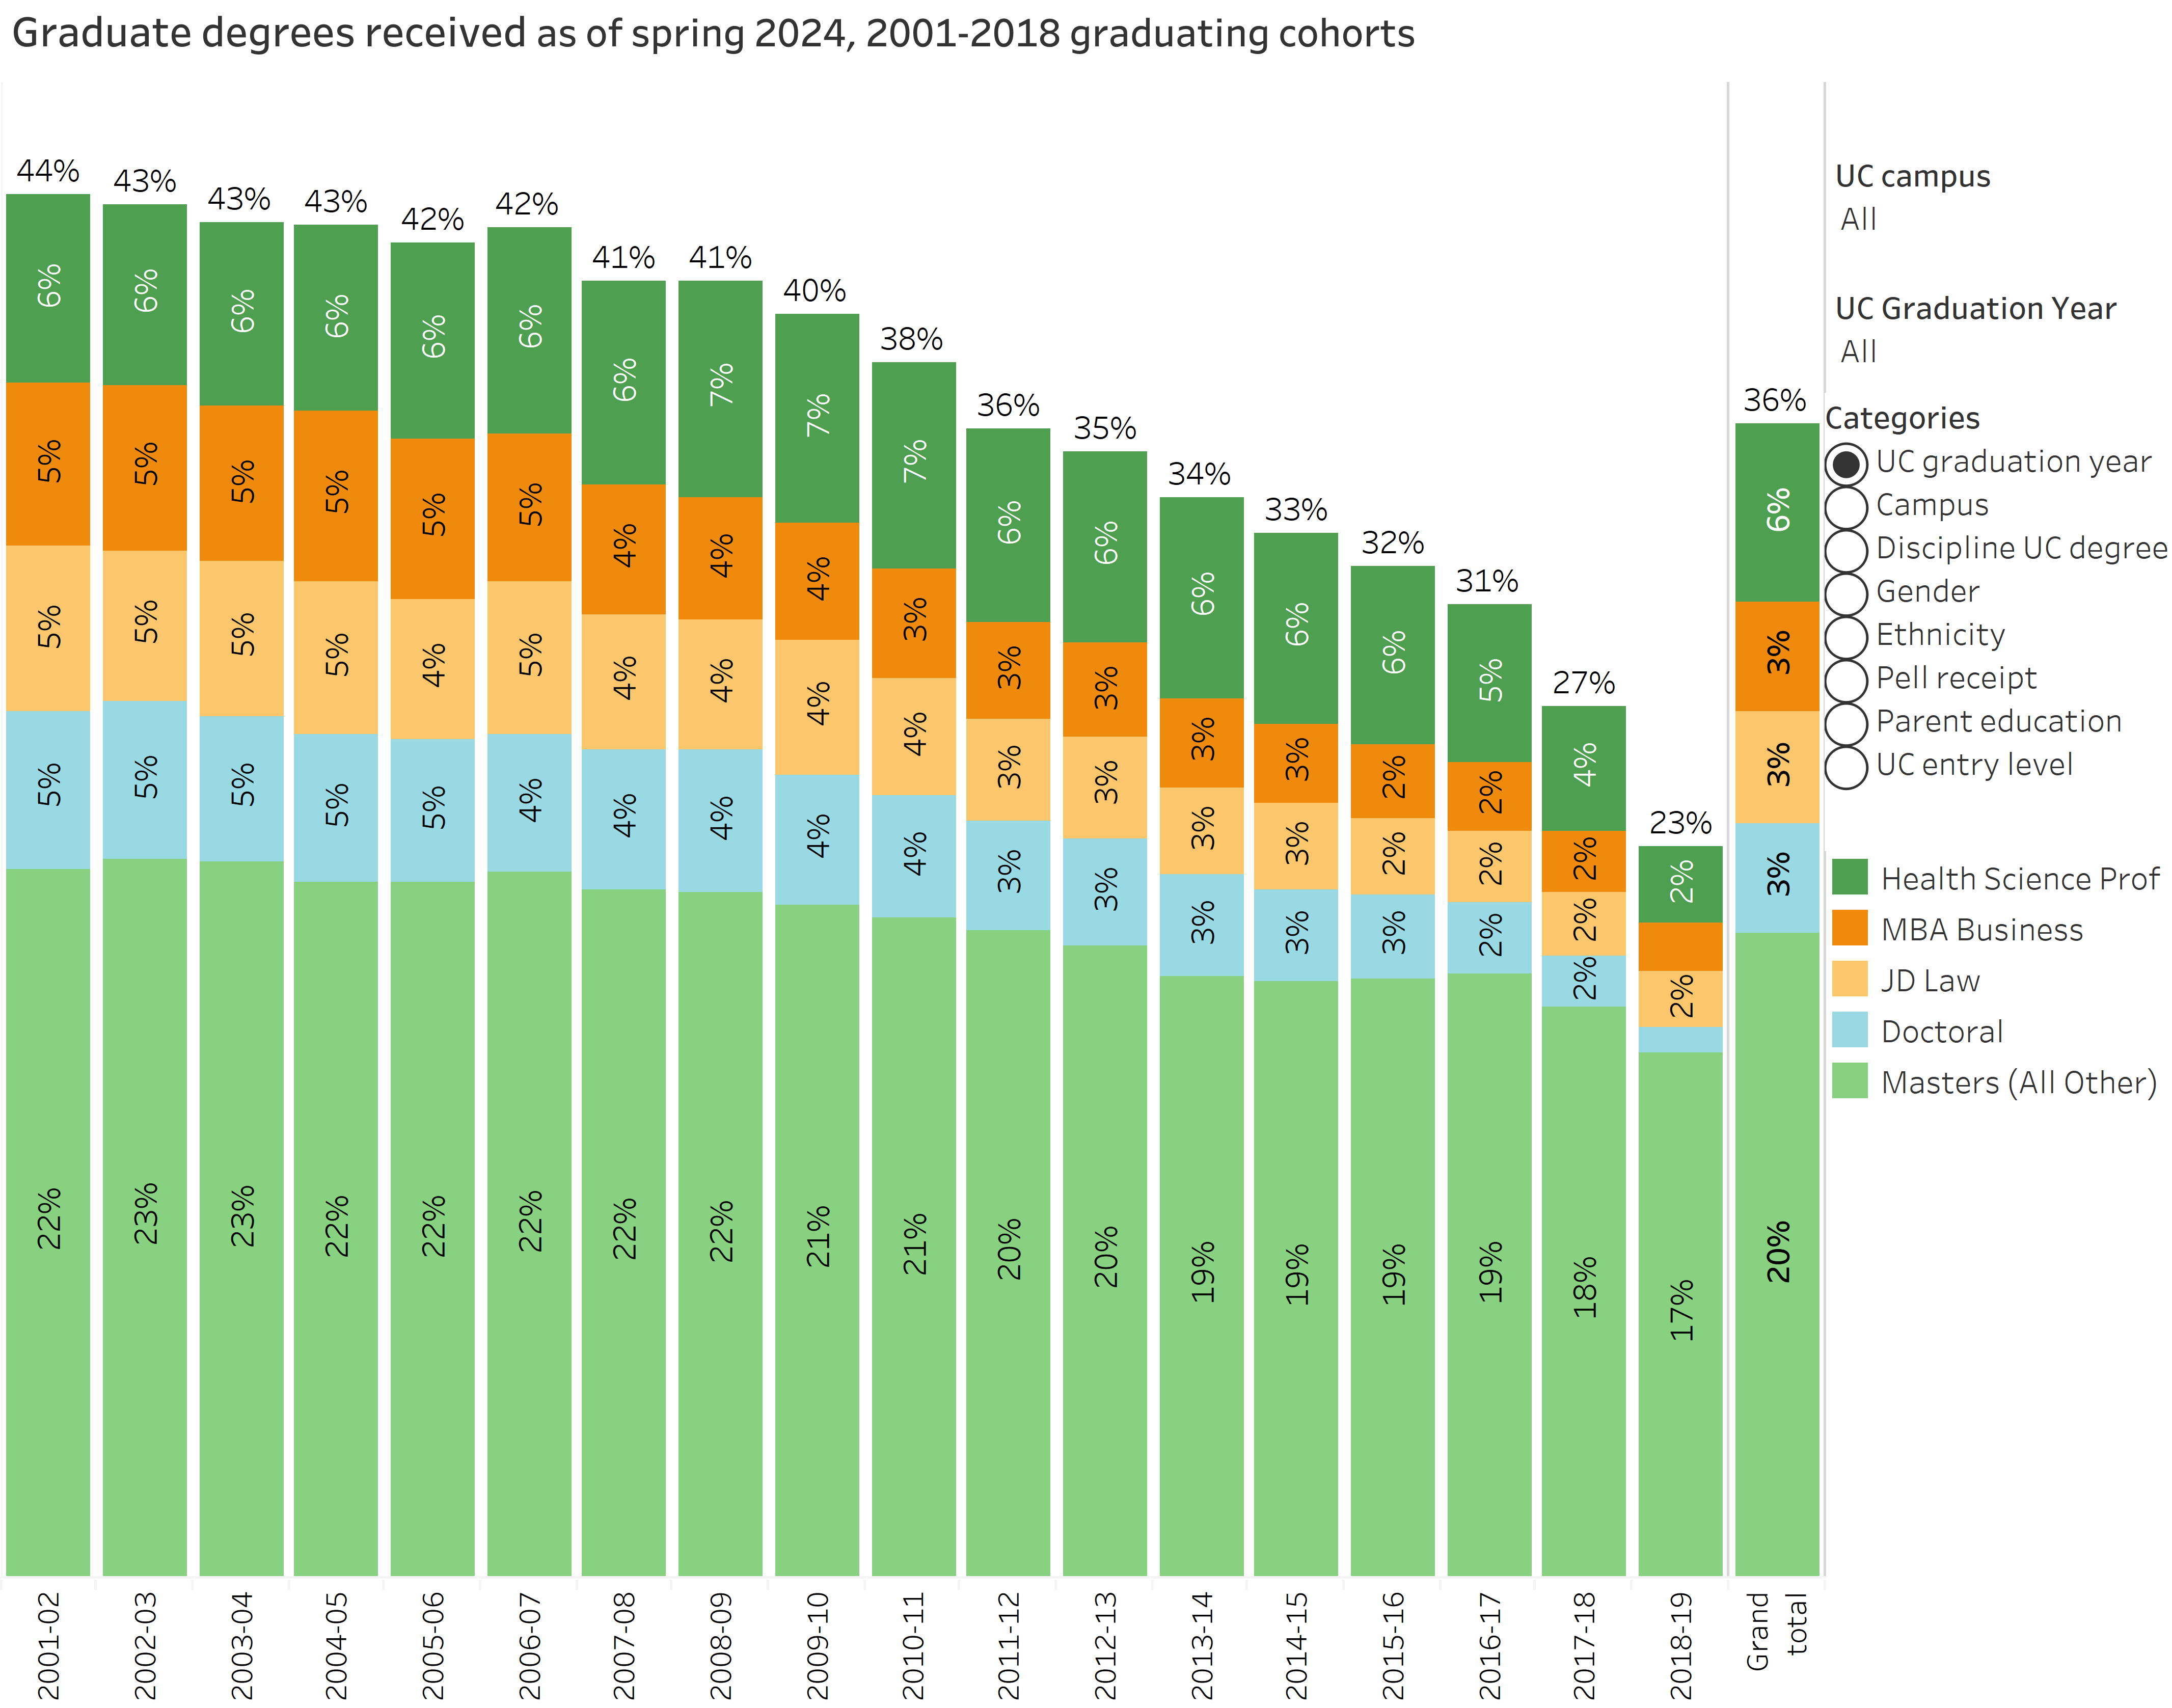
Many UC bachelor’s graduates continue their education, with more than one-third earning a graduate or professional degree by spring 2024.
4.3.3 Graduate and professional degree attainment among UC bachelor’s graduates, 2001–02 to 2018–19 graduating cohorts, as of spring 2024
UC alumni graduate degree outcomes dashboard | Degree types
source: UC Information Center
Many UC bachelor’s graduates go on to pursue advanced study after earning their undergraduate degree. Among UC bachelor’s graduates from the 2001–02 to 2018–19 graduating cohorts, about 36 percent had earned a graduate or professional degree by spring 2024. Master’s-level degrees make up the largest share of advanced degrees earned, followed by health science professional degrees, doctoral degrees, law degrees, and MBAs.
Graduate and professional degree attainment is higher for earlier graduating cohorts, which have had more time to enroll in and complete advanced degree programs. More than 40 percent of alumni from the earliest cohorts shown had earned an advanced degree by spring 2024, compared with lower rates for more recent cohorts. Together with the earnings and employment outcomes shown earlier, these data underscore the long-term value of a UC bachelor’s degree and the varied pathways UC graduates pursue after completing their undergraduate education.
For more information
Explore the UC Information Center dashboards that provide downloadable data and context on Undergraduate student outcomes with this subject area-specific url:
universityofcalifornia.edu/about-us/information-center#undergraduate-outcomes
In addition to those dashboards supporting indicators in this chapter, other examples include:
Other resources
Download data tables for chapter 4 indicators (Excel format)
Chapter Four: Undergraduate Students | Outcomes
Key takeaways:
- UC is retaining and graduating more students, more quickly, and with stronger economic returns.
- UC has ninety-three percent and ninety-five percent first-year retention rates for freshmen and transfers, respectively.
- Most graduates more than double earnings between two and ten years after graduation.
- About ninety percent of UC students leave with a degree.
Between the lines:UC 2030 and Compact goals targeted timely graduation to lower costs, reduce debt, and improve workforce and graduate degree opportunities. This focus helped UC rebound quicker from post-pandemic declines, achieve record seventy-four percent four-year and sixty-seven percent two-year graduation rates, and meet the Compact and close in on UC 2030 goals.
The opportunity:Future gains can be achieved by further closing equity gaps in timely graduation for first-generation, low-income, and historically underrepresented students. While gaps close by year six, efforts to increase four-year graduation rates will increase postgraduate opportunities for these students.
UC’s corner on history:In 1927, Ralph J. Bunche graduated from UCLA. Bunche would go on to win the 1950 Nobel Peace Prize. He was the first African American and first person of color to be so honored.