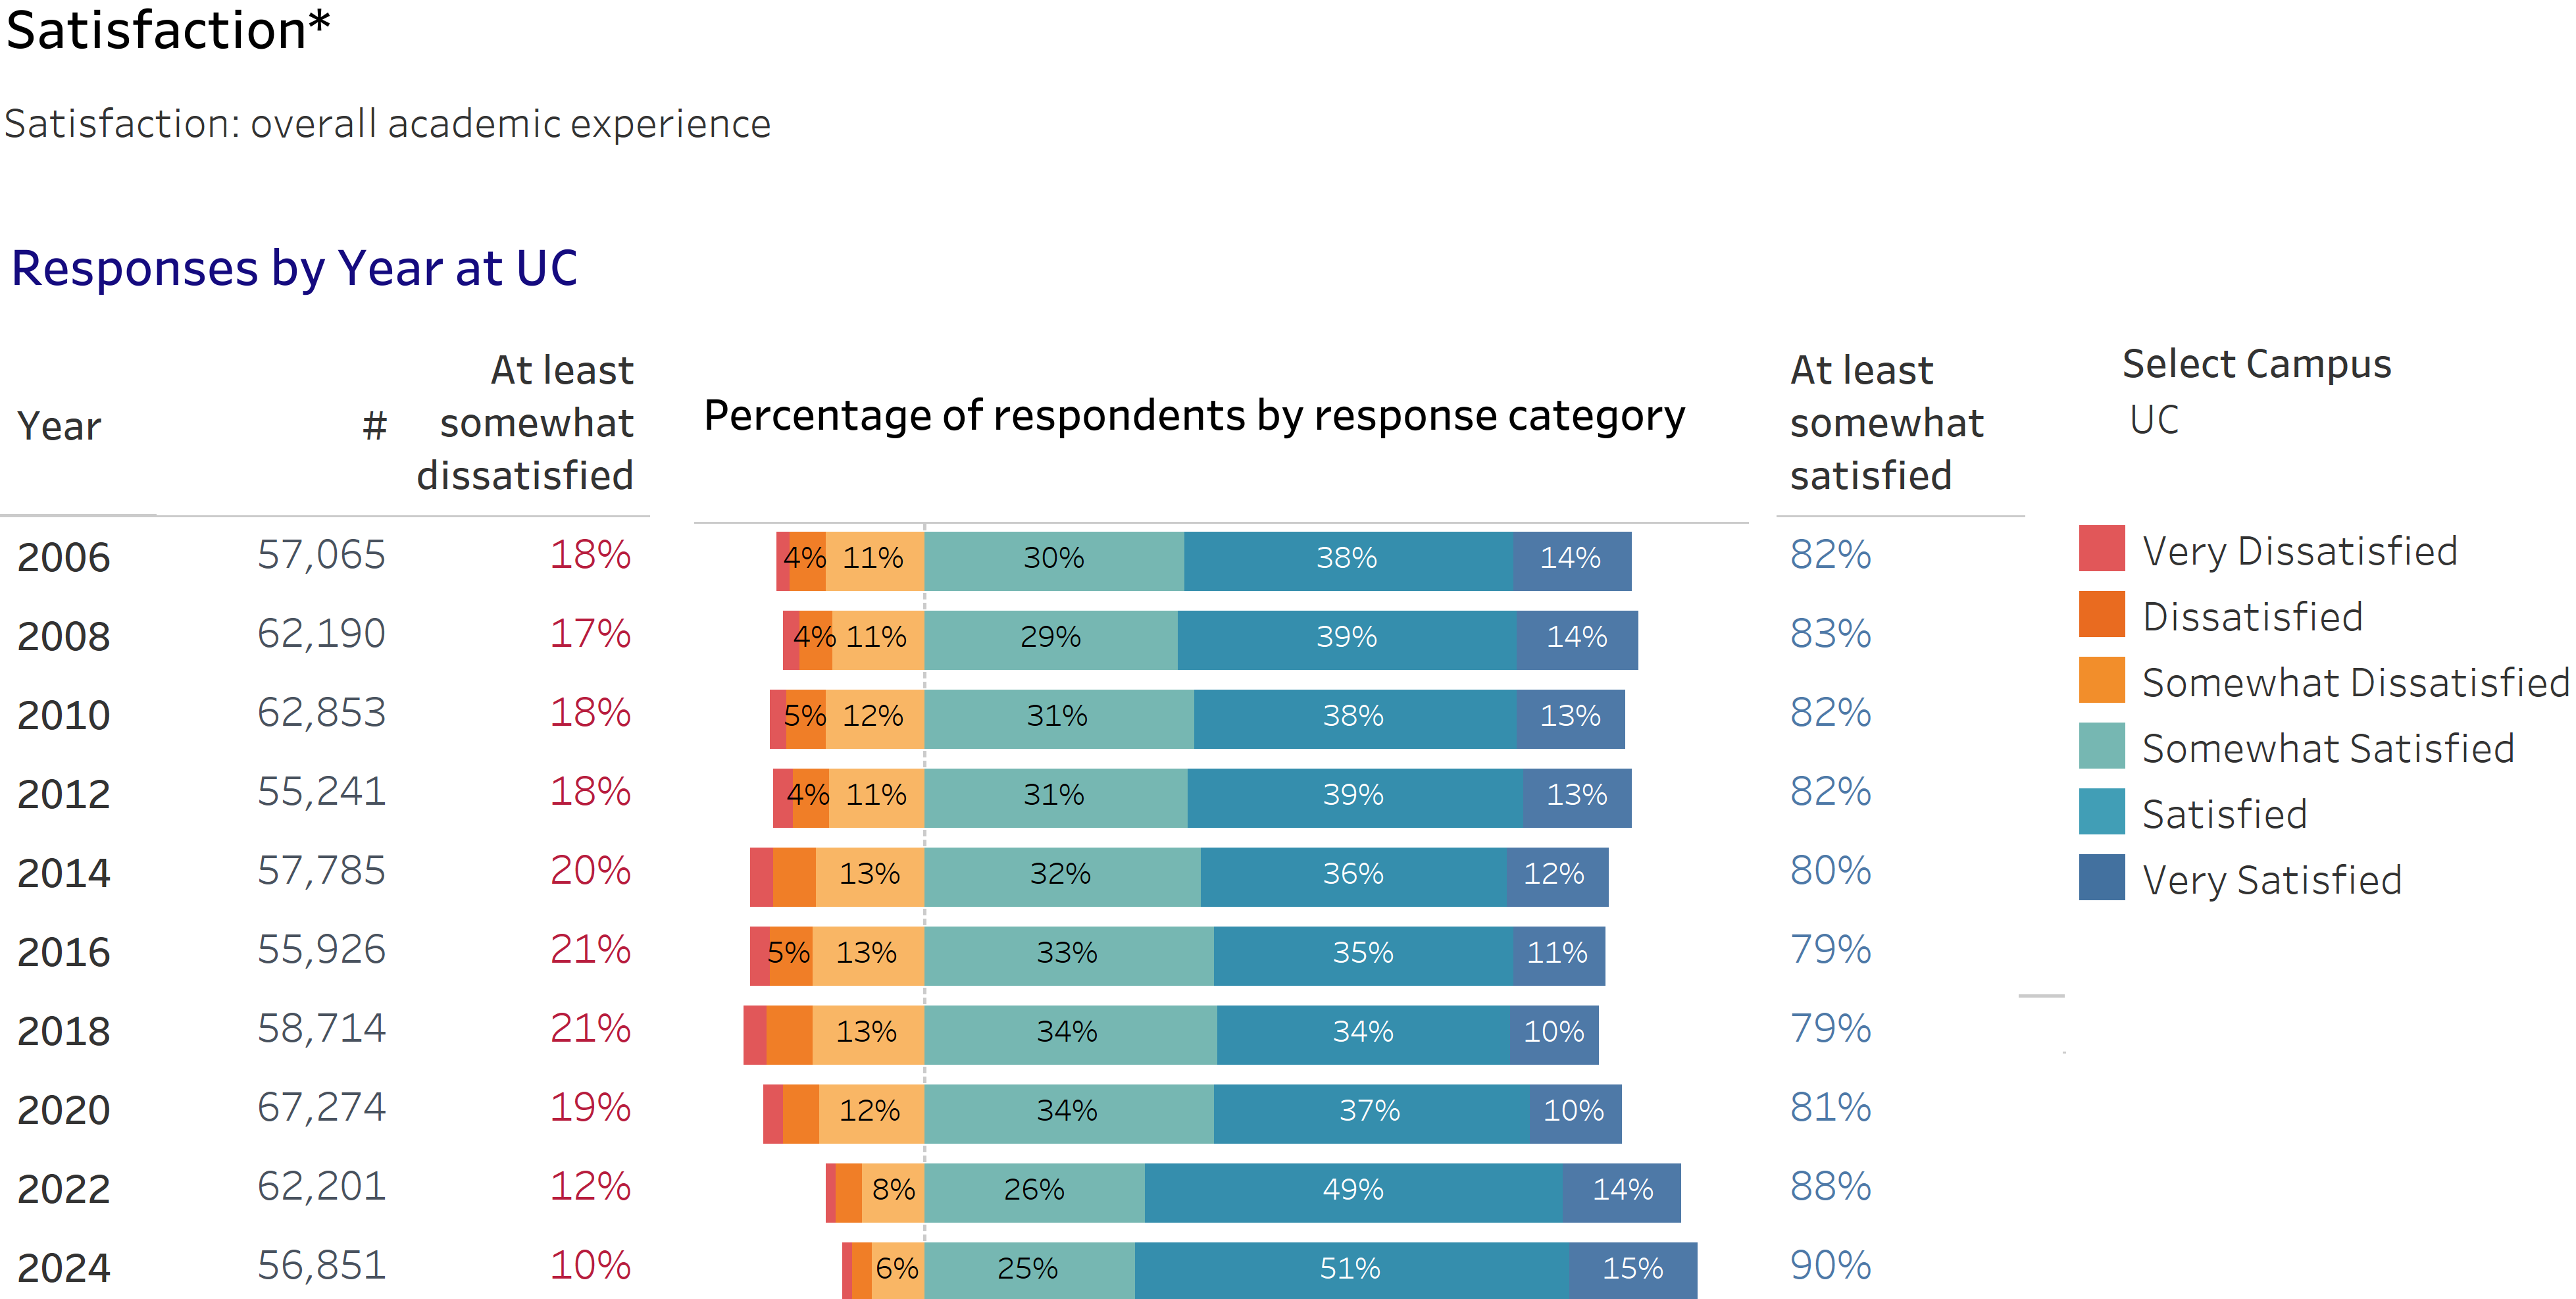
Undergraduate student satisfaction with their overall academic experience increased to 90 percent, up from an average of 80 percent seen over the last decade.
6.1.1 Student satisfaction, Spring 2006 to 2024

UCUES common items longitudinal analysis dashboard | Satisfaction
source: UC Information Center
The UCUES common items longitudinal analysis dashboard provides trend data on critical items and the ability to filter by campus and other characteristics. In addition to overall satisfaction with their academic experience, 87 percent of undergraduate students reported satisfaction with faculty instruction, 77 percent with educational enrichment programs, 76 percent with the availability of general education courses, and 74 percent with the availability of courses needed for graduation. These factors may help explain overall academic satisfaction.
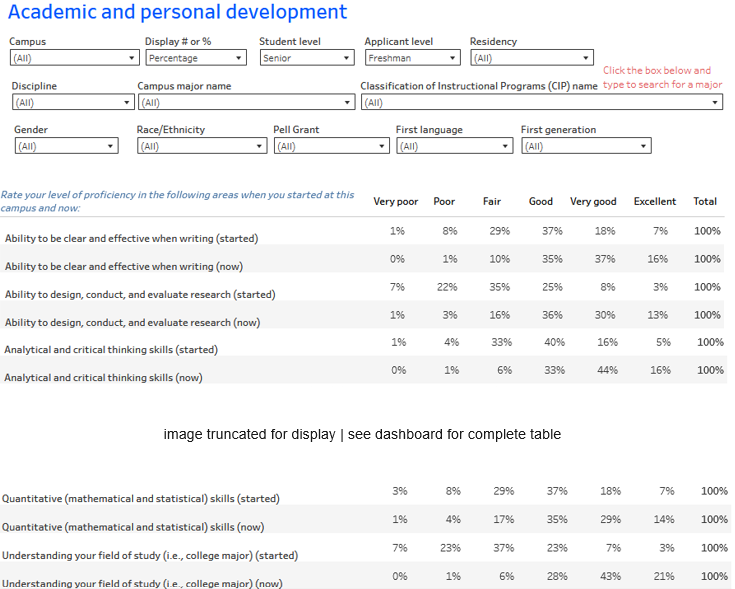
The largest gains in self-reported proficiency between freshman and senior years were in “understanding your field of study” and the “ability to design, conduct, and evaluate research.”
6.1.2 Self-reported proficiency levels, Spring 2024
University of California Undergraduate Experience Survey (UCUES) Data Tables, 2024 dashboard | Academic development
source: UC Information Center
The Academic Development tab of the linked dashboard illustrates self-reported skill levels. To look at seniors who entered as freshmen, filter student level on “Senior” and applicant level on “Freshman.” Students also reported gains in analytical and critical thinking skills, clarity and effectiveness in writing, and quantitative (mathematical and statistical) skills.
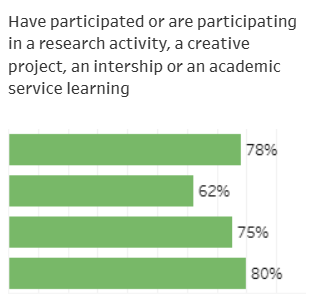
The Spring 2024 UCUES reports that 80 percent of bachelor’s degree recipients participated in research, internship, or service-learning activities.
6.1.3 Student engagement with research, internships, and service-learning, Spring 2024
UC undergraduate student research, internships, and service-learning dashboard | Overall participation
source: UC Information Center
The dashboard provides detailed information on participating in research, internship, and service-learning activities by campus, student demographics, and other categories. It shows a return of participation rates after a drop during the pandemic.
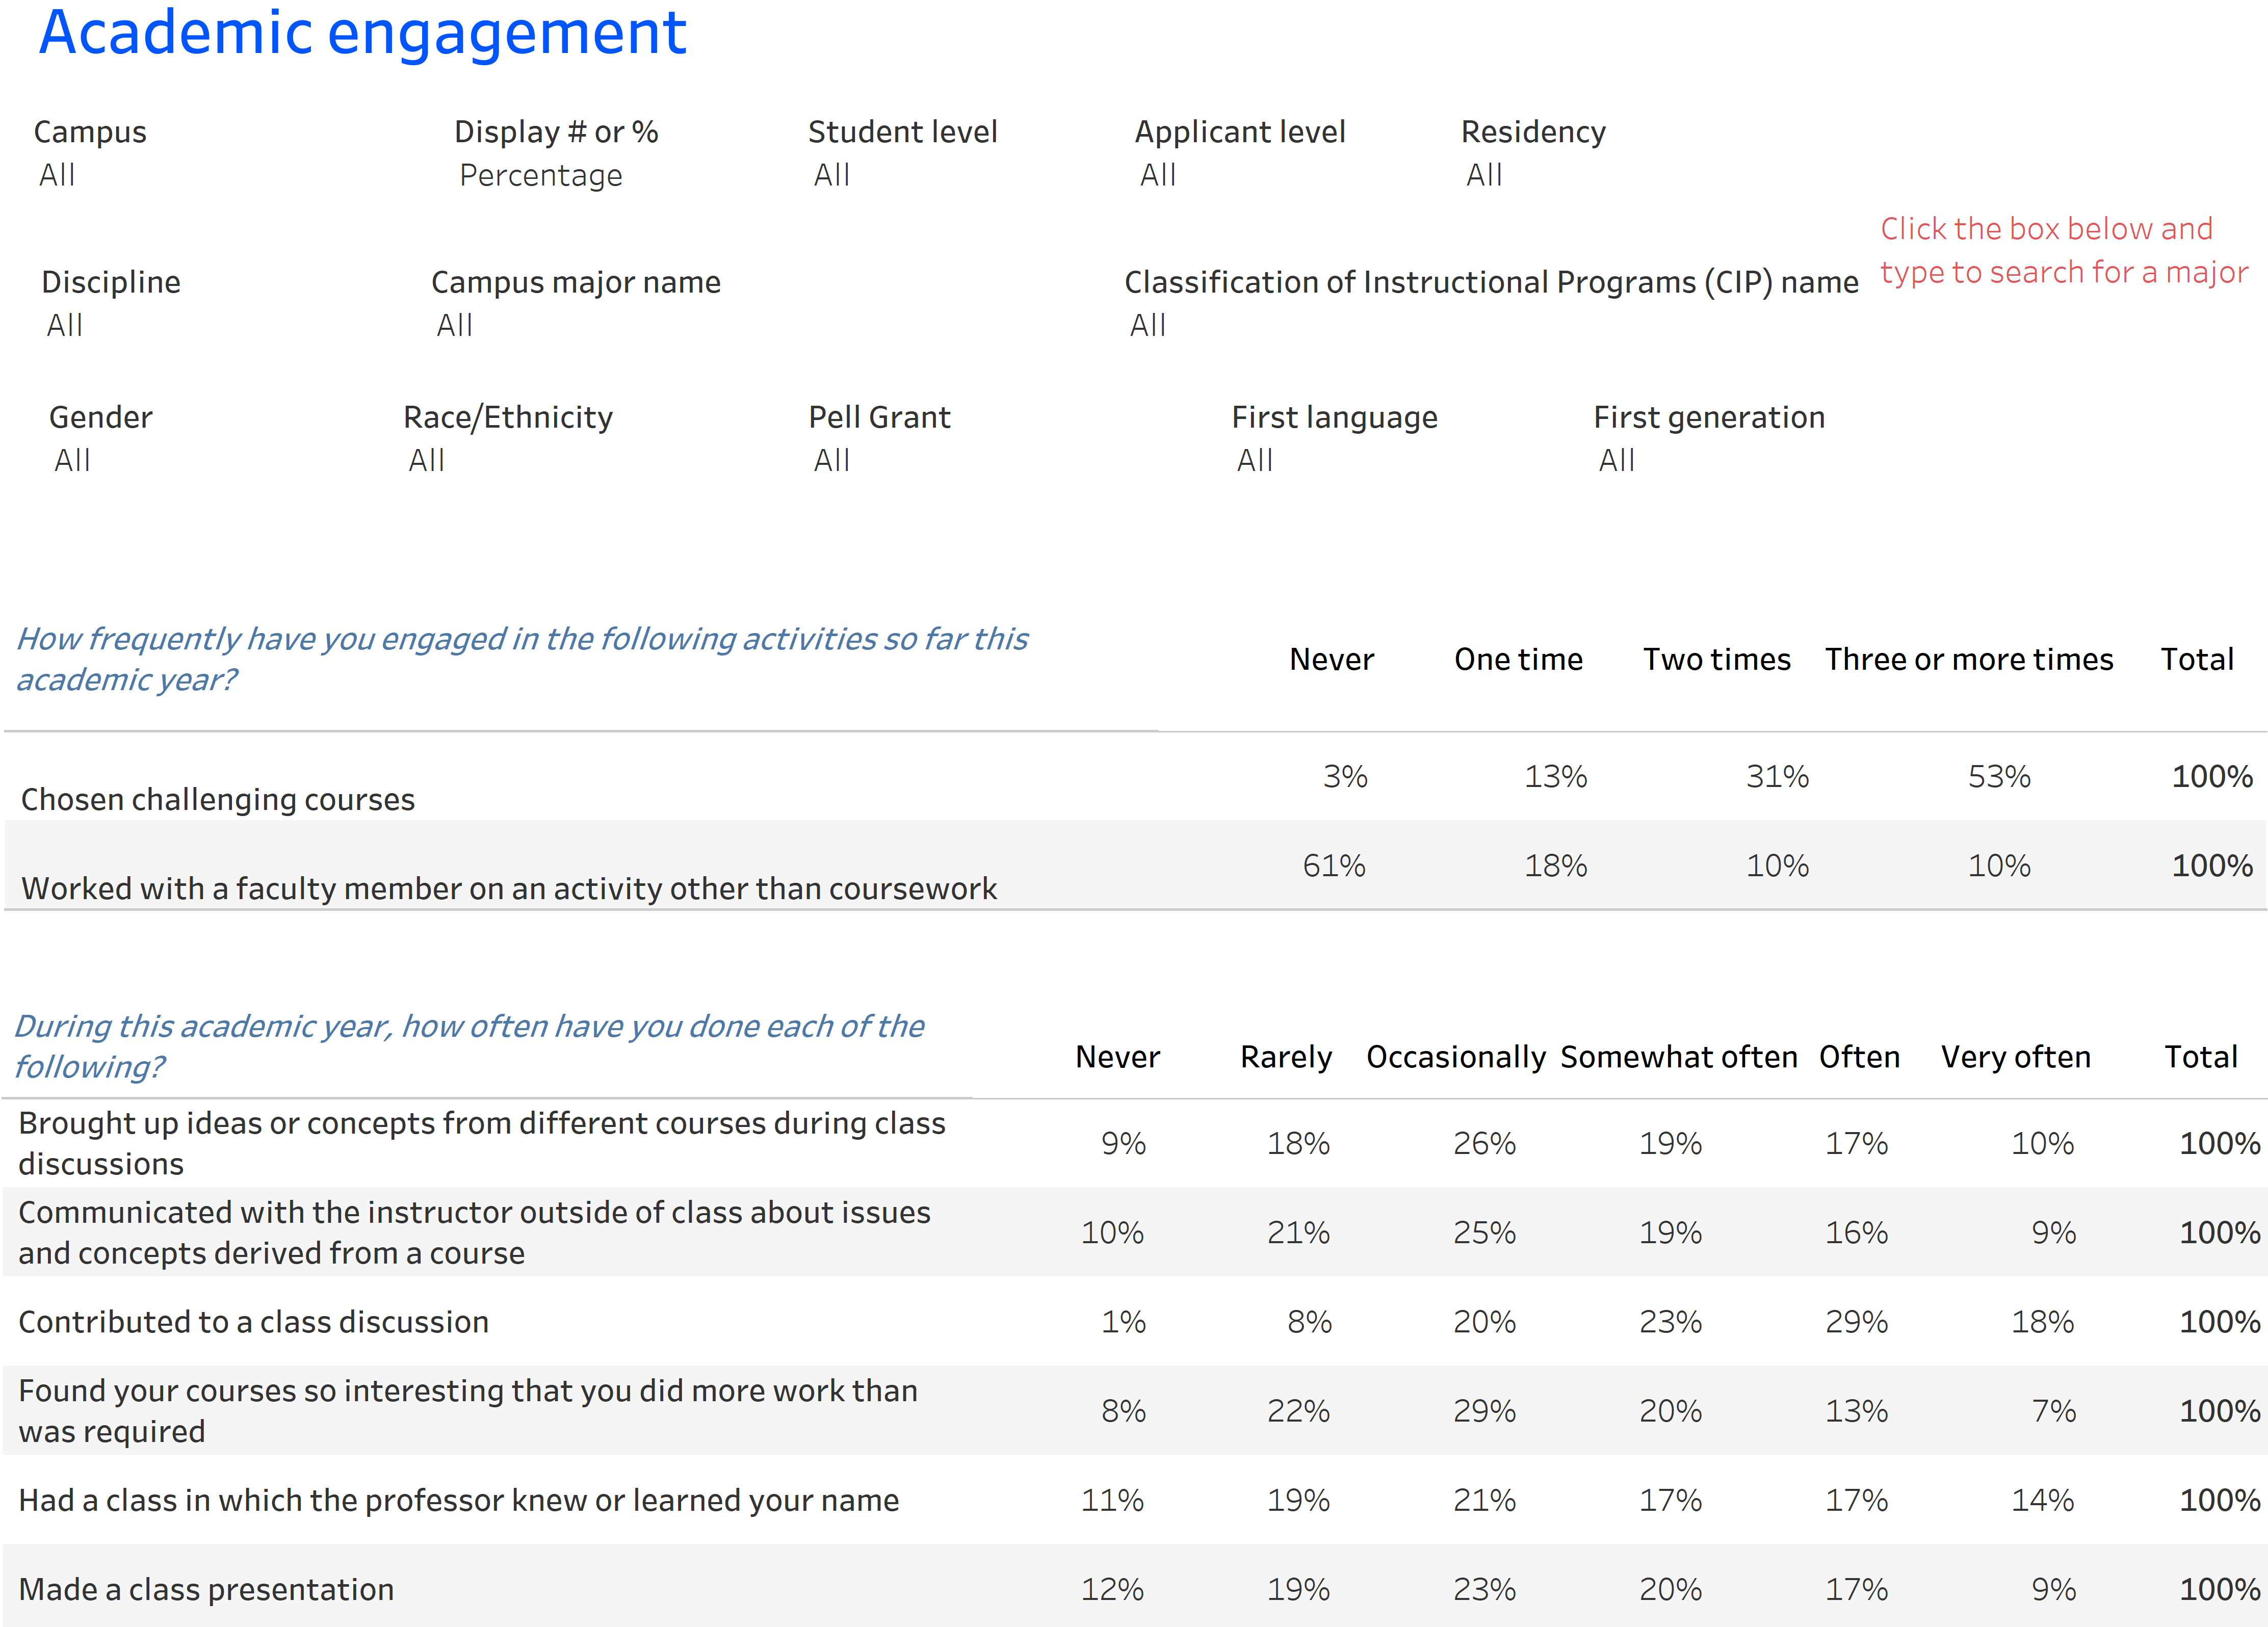
The Spring 2024 UCUES reports that 46 percent of students brought up ideas or concepts from different courses during class discussions and made a class presentation at least somewhat often.
6.1.4 Academic engagement, Spring 2024
University of California Undergraduate Experience Survey (UCUES) Data Tables, 2024 dashboard | Academic engagement
source: UC Information Center
The academic engagement tab of the UCUES dashboard highlights items related to academic engagement. Undergraduate students report strong engagement in challenging coursework, with over half (53 percent) reporting taking such courses three or more times in the academic year. Fewer students (38 percent) report working with faculty outside of coursework. Participation in class discussions is common, with 70 percent of students reporting they do so at least somewhat often. About half of students report having professors who know their name and many students report making class presentations, bringing up ideas from other courses, communicating with instructors outside of class, or going beyond course requirements at least somewhat often (46, 46, 44, and 40 percent, respectively).
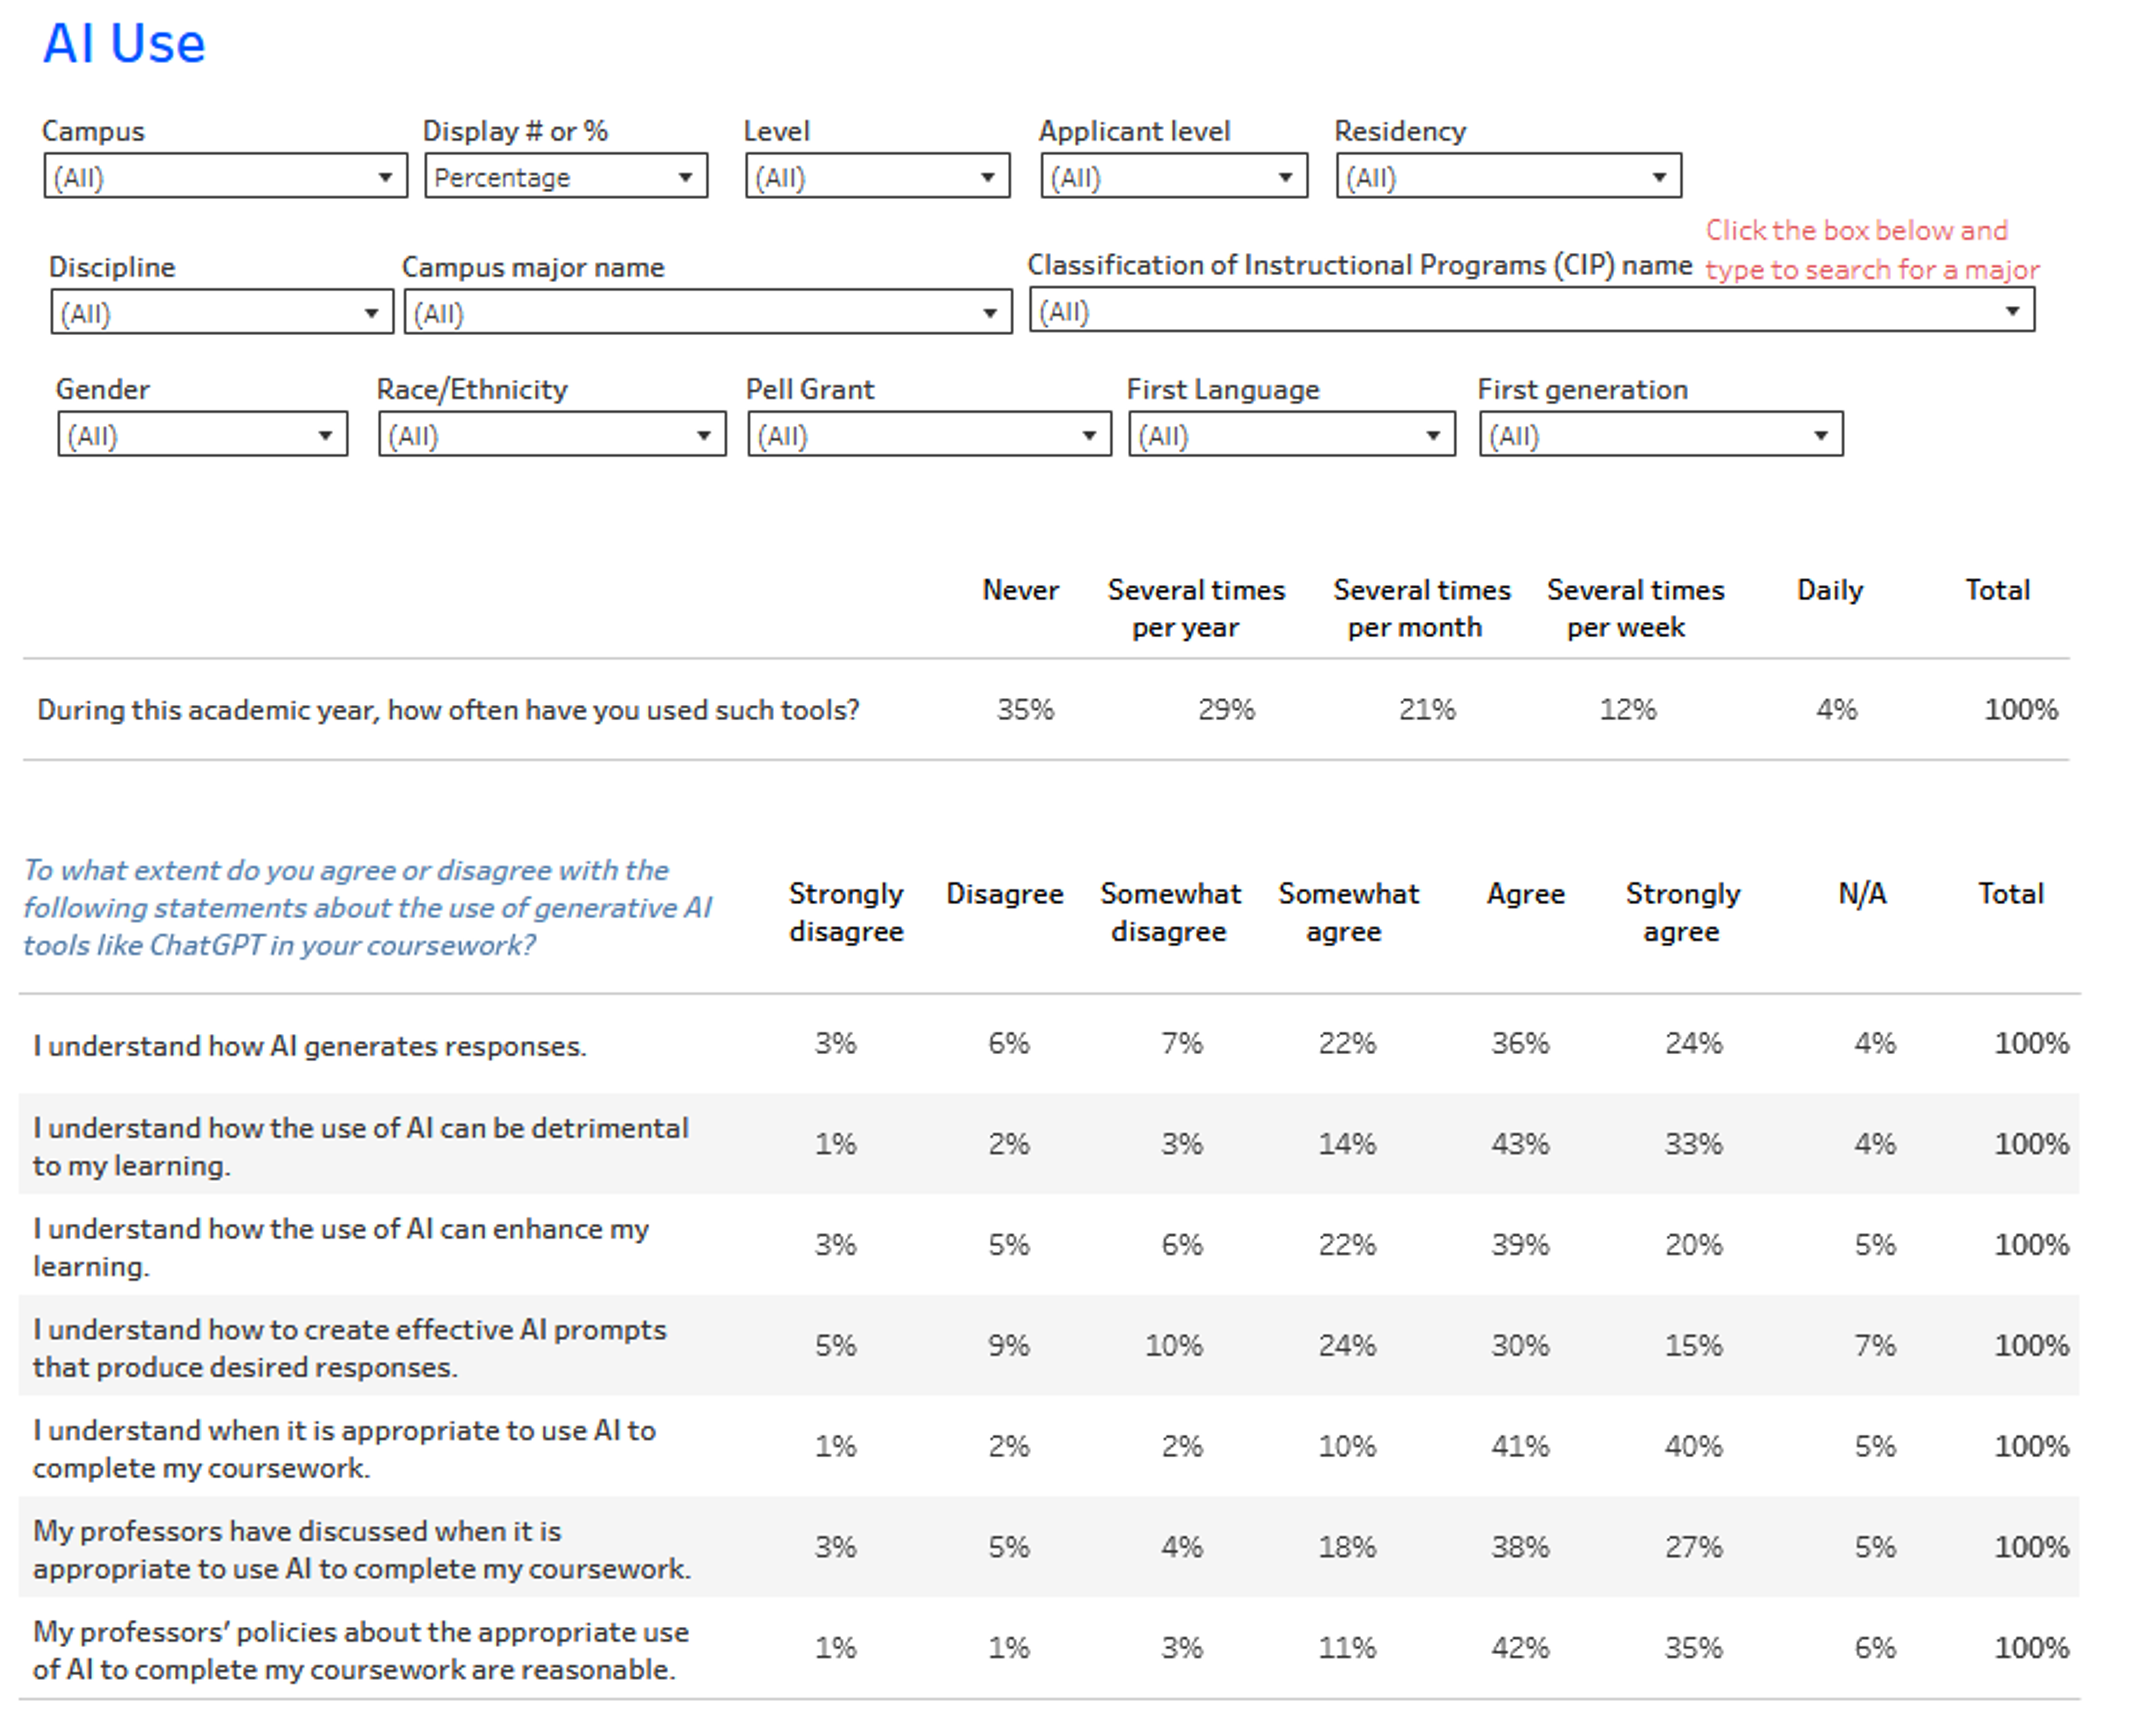
UC undergraduate students use AI tools occasionally, with 91 percent reporting they understand when it is appropriate to use AI for coursework and generally recognize its potential impact on learning.
6.1.5 Students’ self-reported AI use, Spring 2024
University of California Undergraduate Experience Survey (UCUES) Data Tables, 2024 dashboard | AI
source: UC Information Center
The AI tab of the UCUES dashboard highlights items related to students’ AI use. UC undergraduate students use AI tools like ChatGPT occasionally rather than frequently, with 50 percent using such tools several times a month or year overall, primarily for brainstorming (63 percent), researching topics (63 percent), and studying for exams (51 percent). Most students (91 percent) at least somewhat agree they understand when it is appropriate to use AI for coursework. Most students find their professor’s policies reasonable (88 percent) and report that their professors have discussed appropriate AI use in class (83 percent).
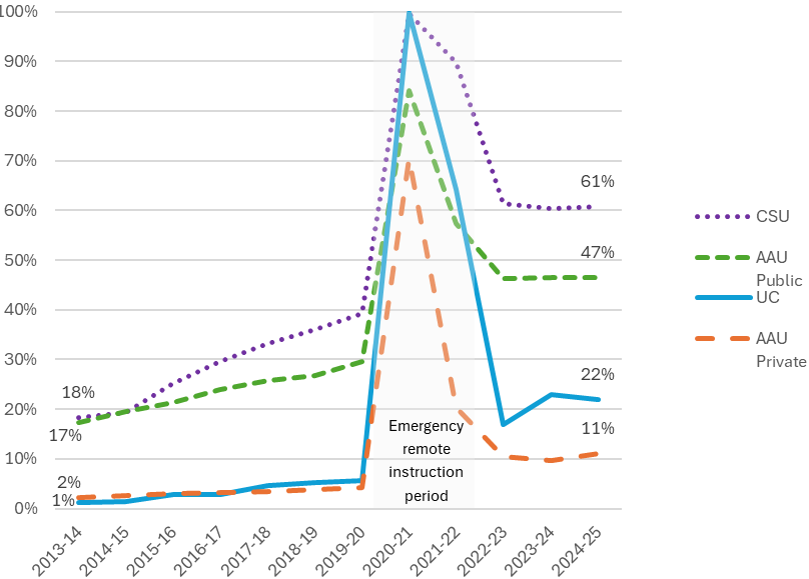
Following a dramatic increase in online offerings during the COVID-19 pandemic, online course-taking is greater than pre-pandemic levels with 22 percent of undergraduates taking at least one online course.
6.1.6 Share of undergraduates taking at least one course online, Universitywide and comparison institutions, 2013–14 to 2024–25
source: IPEDS
In 2019–20, three percent of all undergraduate units, or approximately 279,000 out of 9.8 million, were delivered online. The Governor’s 2022–23 Budget proposed to double that number by 2030. In 2020–21, 96 percent of units were delivered online due to the COVID-19 pandemic. In 2024–25, 11.7 percent of all undergraduate units were delivered online.
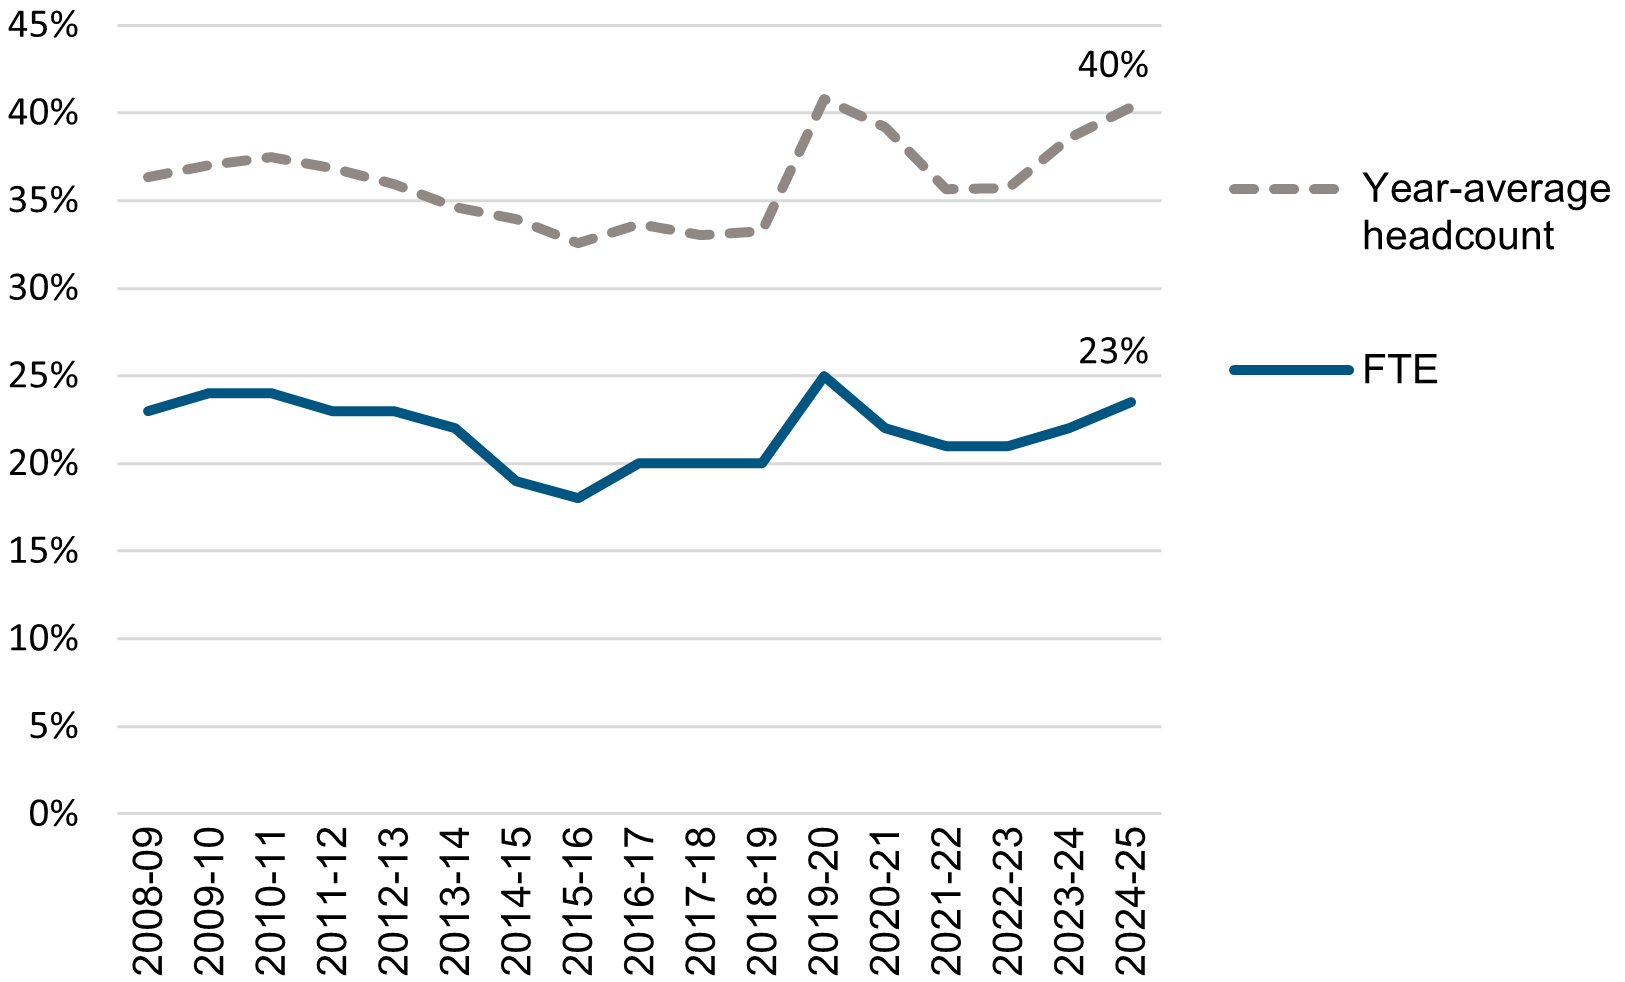
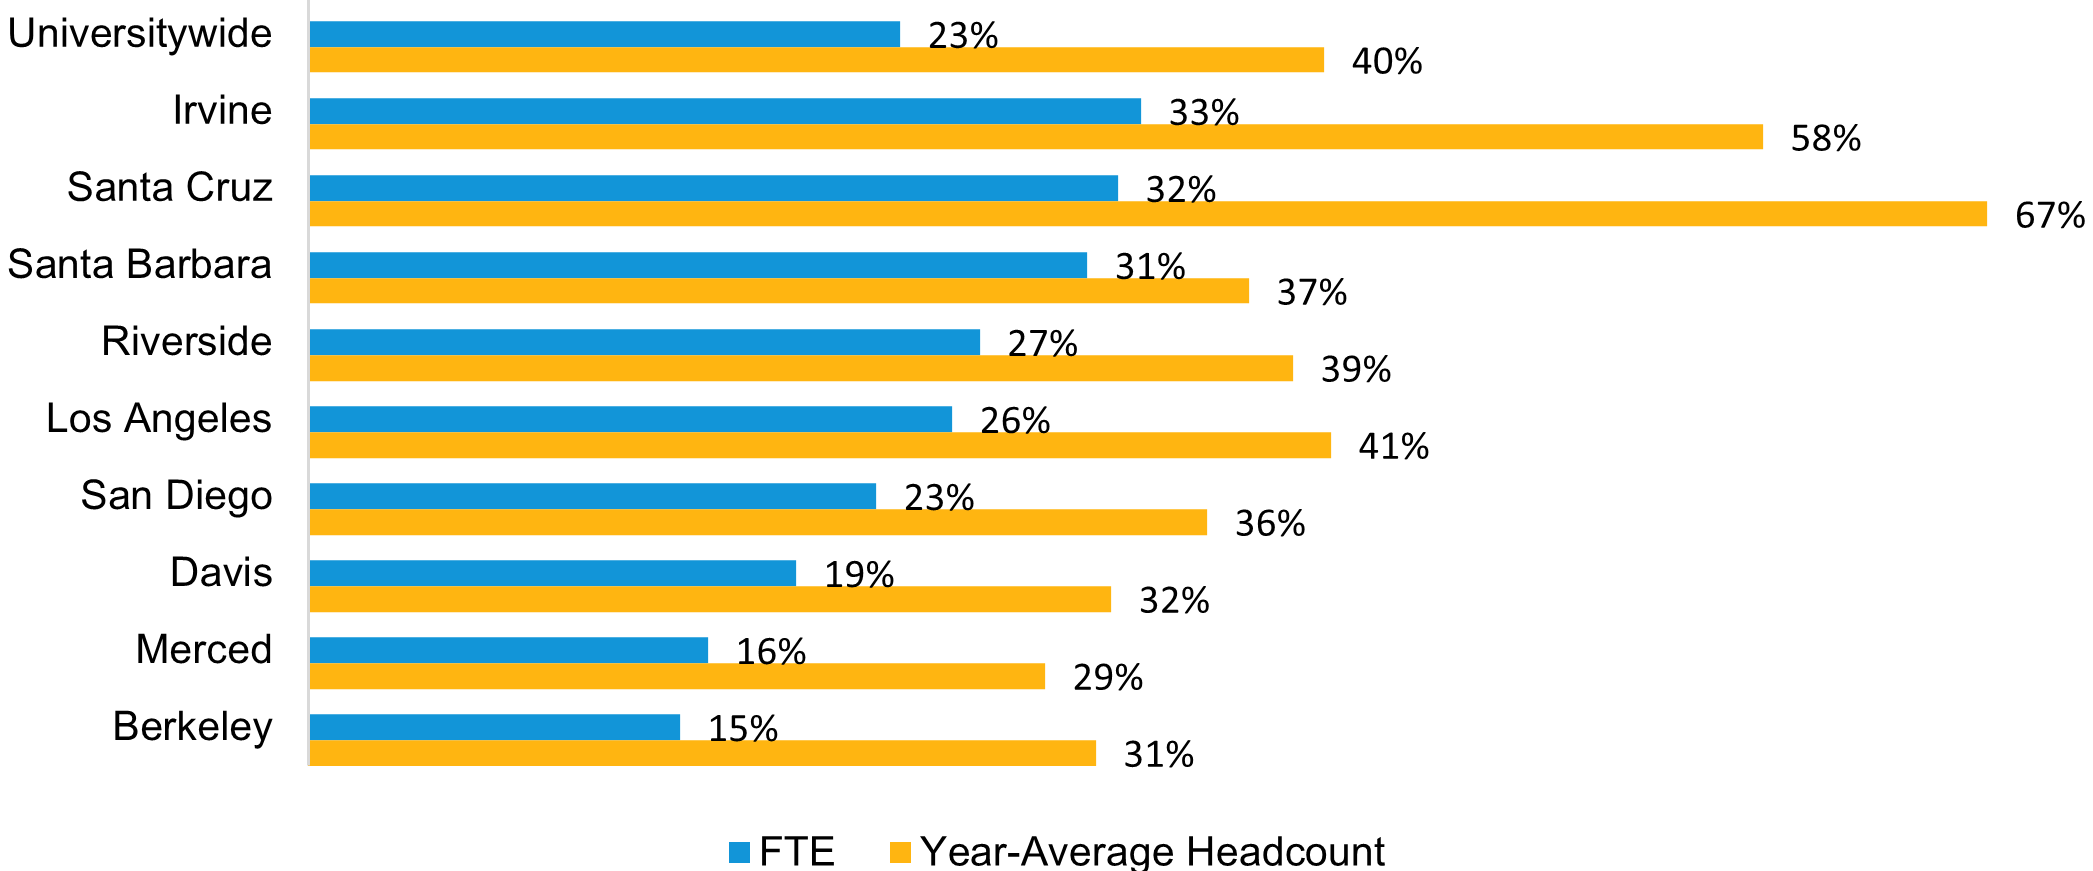
Summer enrollment, as a percentage of academic year enrollment, increased to 23 percent of 2024–25 FTE, boosted by online course offerings and summer first-year orientation courses at some campuses.
6.1.7 Summer enrollment as a percentage of prior year fall-winter-spring enrollment, Universitywide and UC campuses, 2008–09 to 2024–25
source: Budget Analysis and Planning
Summer enrollment surged in 2020 during the shift to remote instruction, declined slightly in 2021–2022 while remaining above pre-pandemic levels, and has steadily grown since. By summer 2025, FTE enrollment increased to 23 percent, reaching pandemic-era levels under more typical conditions. Summer enrollment now represents a significant share of annual enrollment, though participation varies widely by campus.
Long-term summer growth has been driven by offering courses, support services, and financial aid that help students stay on track for graduation. Expanded summer instruction has improved facility use, accelerated time-to-degree, and increased course availability, with campuses offering 52 percent more primary classes in summer 2024 than in summer 2000. Students also report using summer to help them graduate on time and enjoy the smaller class sizes and greater faculty contact often provided by summer courses.
note: For this indicator, Summer is counted as a trailing term: e.g., the 2024–25 year includes summer 2025.
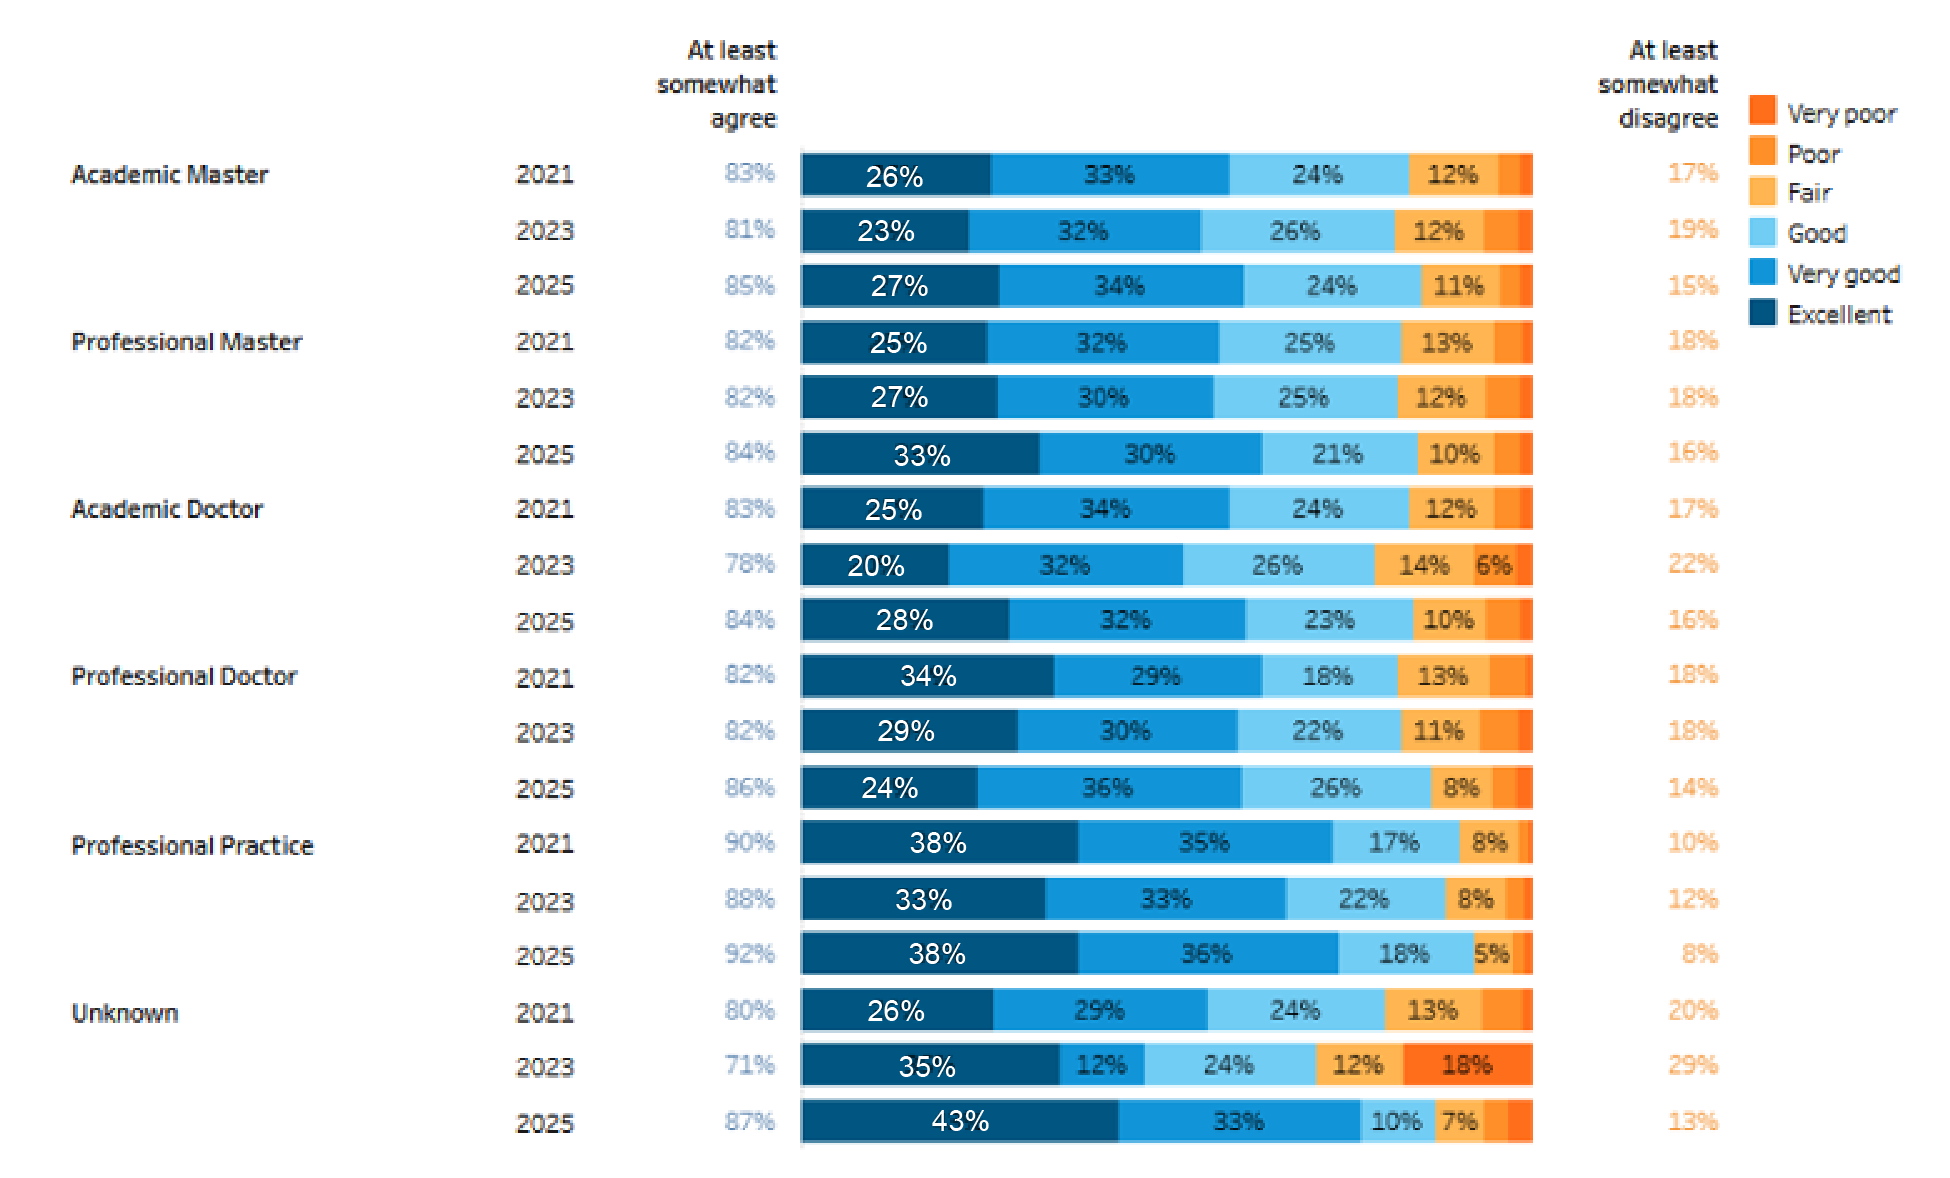
In 2025, 85 percent of graduate and professional students rated the overall quality of their degree program positively, with professional practice programs receiving the highest satisfaction rating at 92 percent.
6.2.1 Graduate and professional student satisfaction, Spring 2023 to 2025
UC Graduate Student Experience Survey (UCGSES) dashboard | Program and curriculum quality
source: UC Information Center
The UCGSES dashboard provides trend data for survey items and allows users to filter results by campus and other characteristics. In addition to reporting positively on the overall quality of their graduate degree programs, 86 percent of graduate and professional students gave favorable ratings to curriculum quality, 85 percent to teaching quality in their program, and 75 percent to opportunities to work collaboratively with faculty on research.
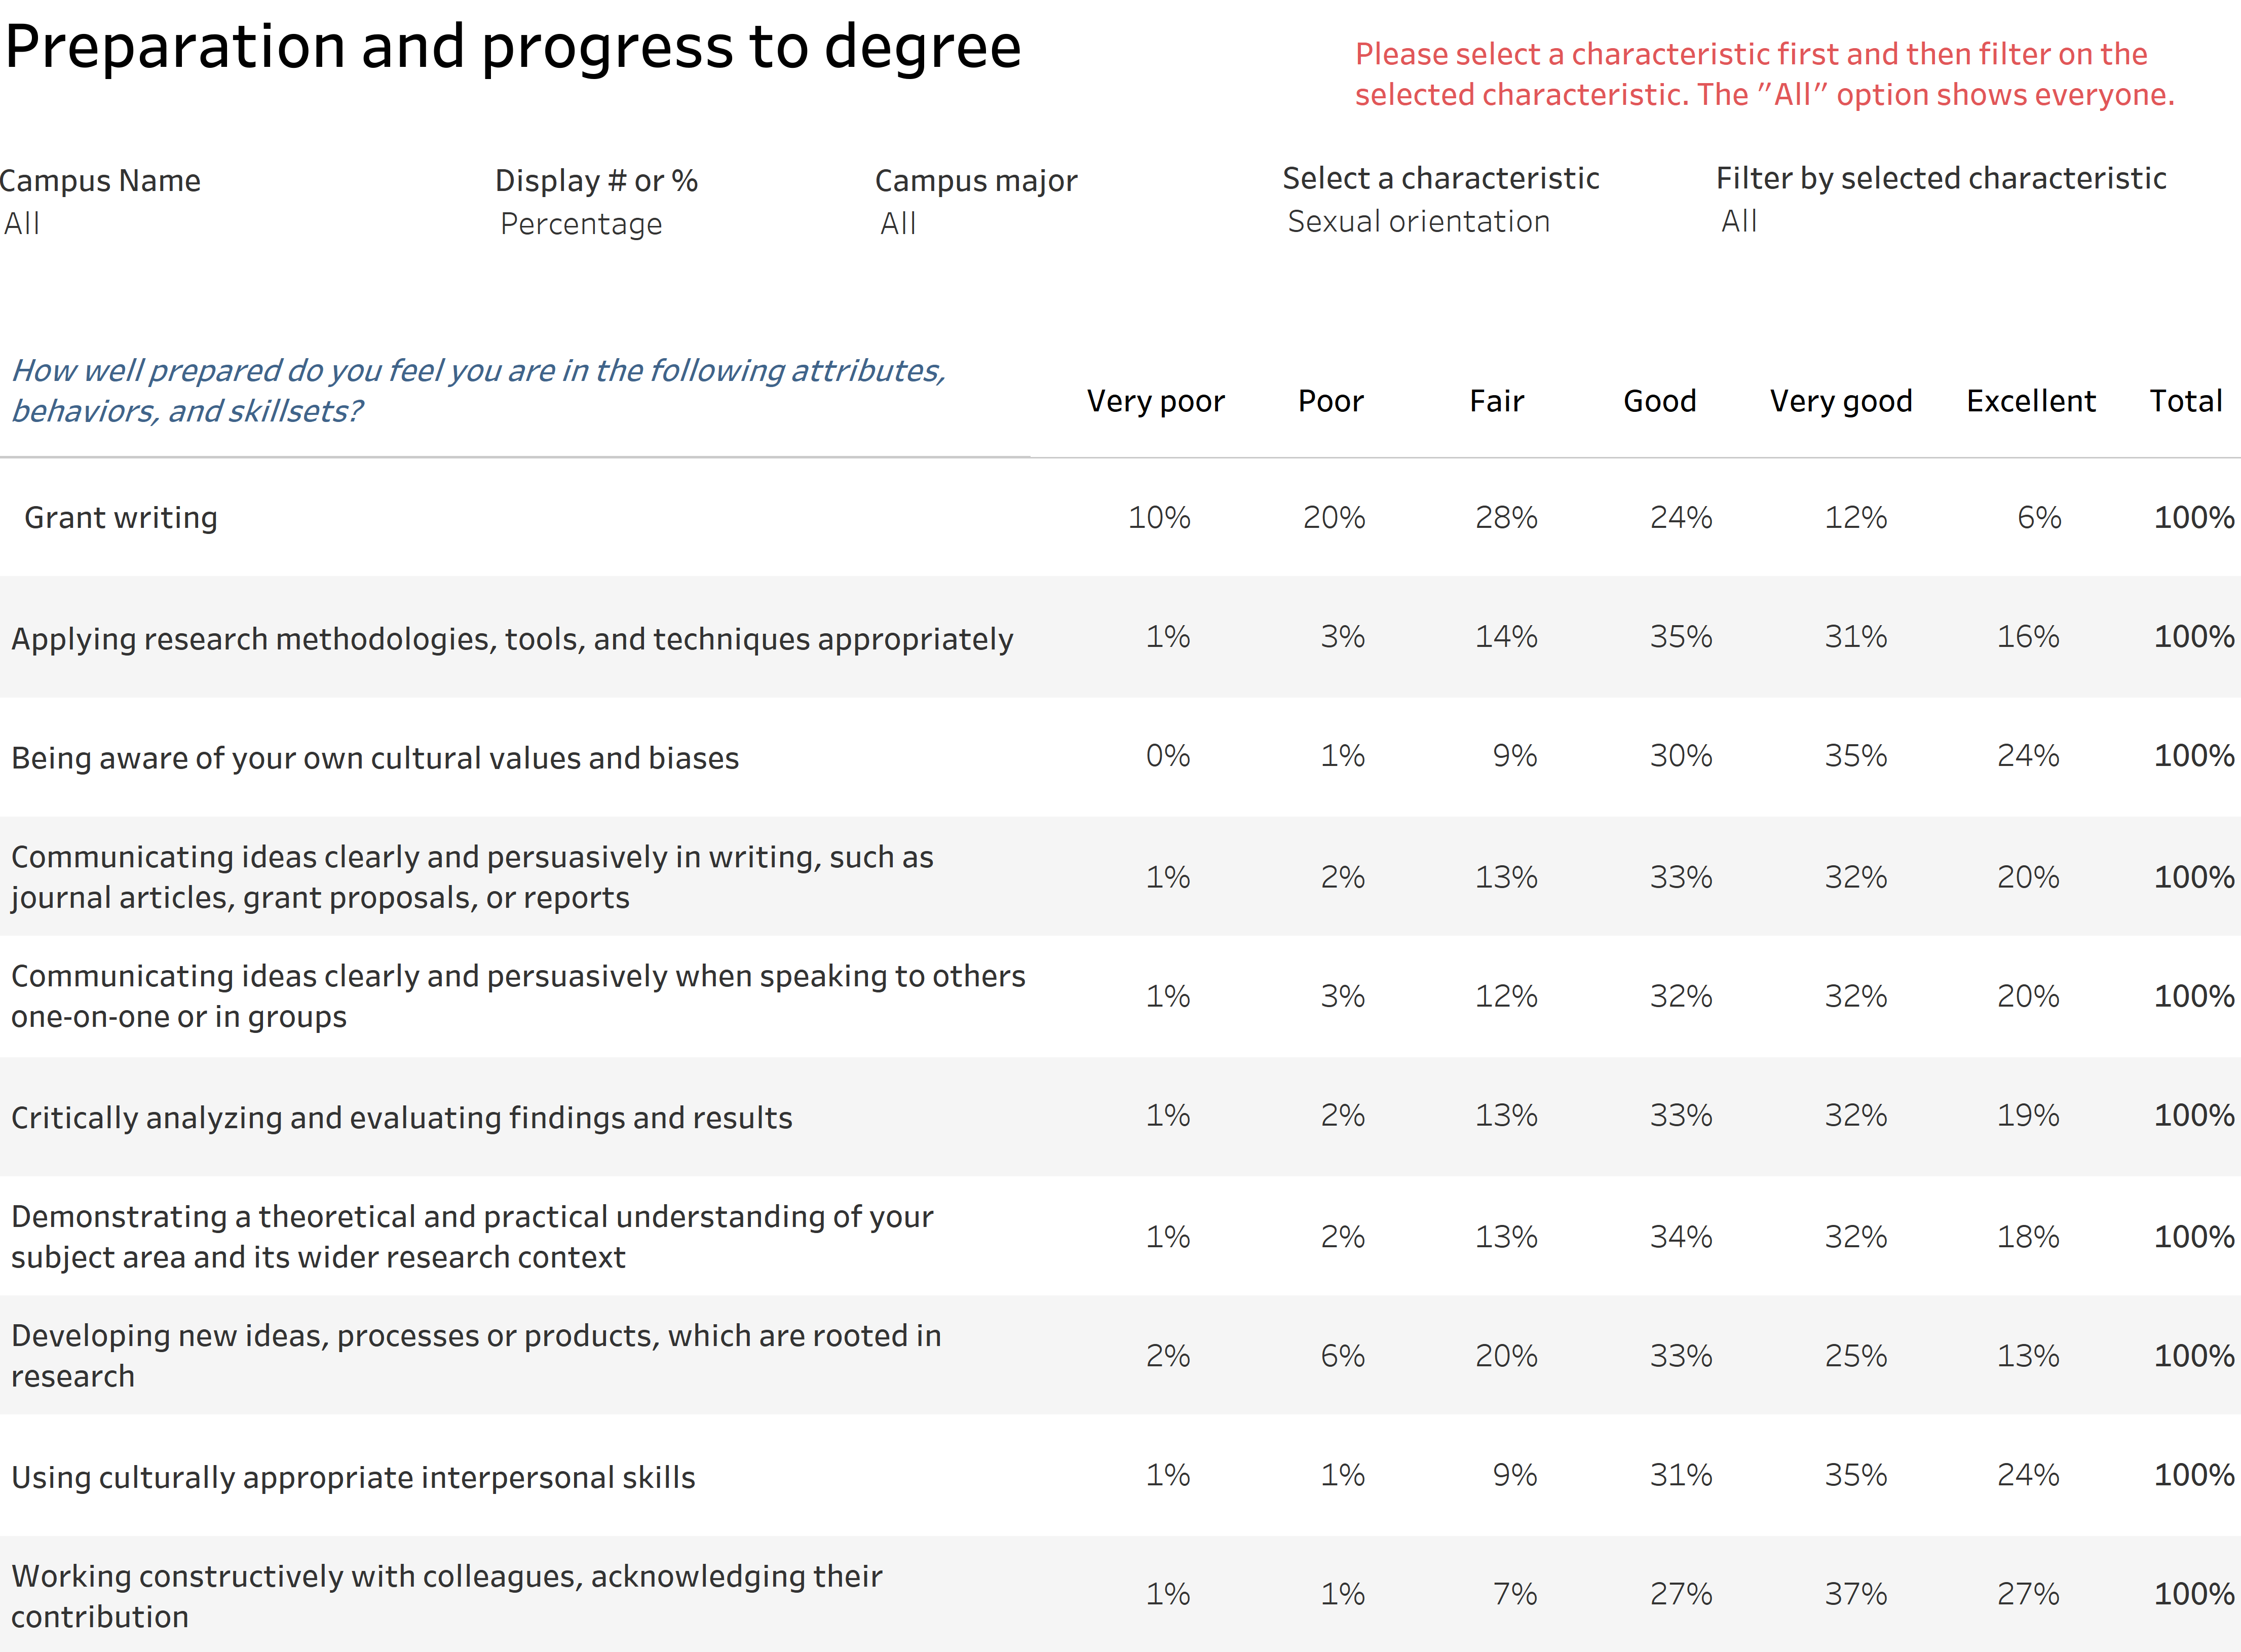
Graduate and professional students credit their doctoral programs with having strengthened multiple skill sets, including research, teamwork, and understanding other perspectives.
6.2.2 Graduate and professional student preparation by skillset, Spring 2025
UC Graduate Student Experience Survey (UCGSES) Data Tables, 2025 dashboard | Progress to degree
source: UC Information Center
The Preparation and Progress to Degree tab of the linked dashboard shows graduate and professional students’ self-assessments of their preparation across a range of academic and professional skills. Students reported the strongest preparation in collaborative and communication-related skills, with 90 percent rating themselves at least “good” in areas such as working constructively with colleagues and interpersonal skills. Additionally, about 85 percent rated themselves at least “good” in communicating ideas clearly in writing and when speaking to others.
6.3 THE INSTRUCTIONAL WORKFORCE
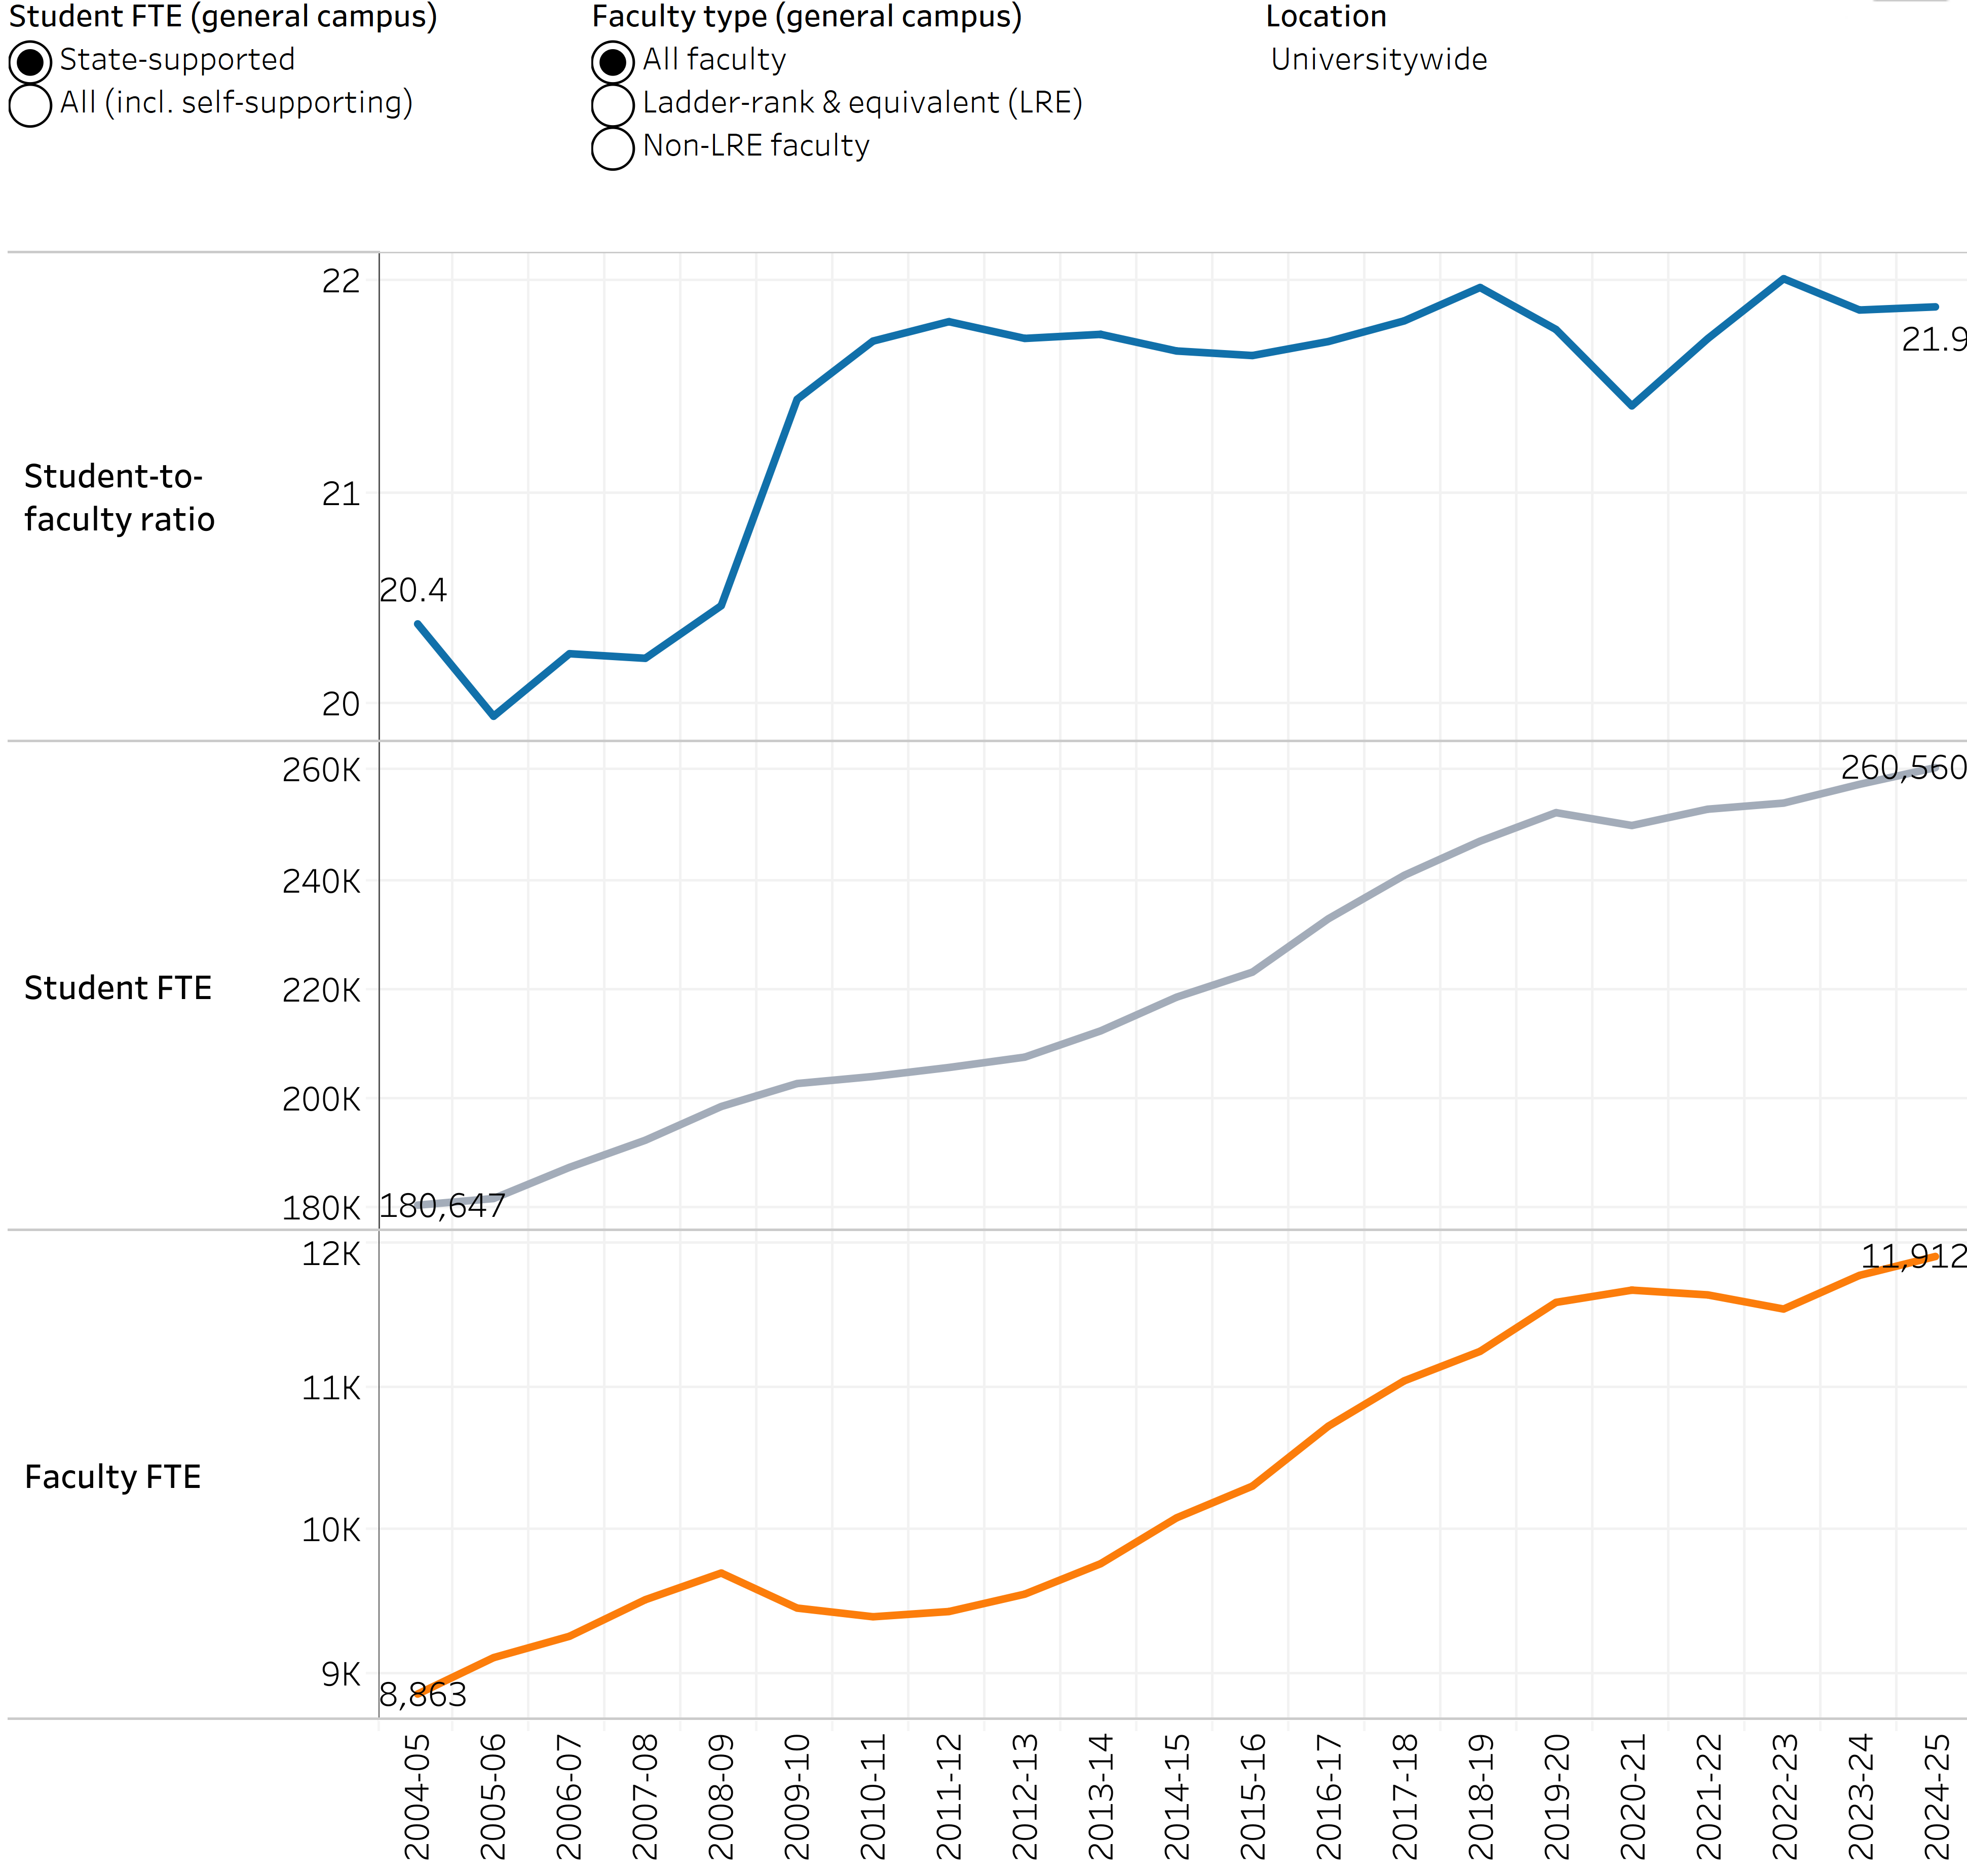
The UC student-faculty ratio is almost 22 to 1.
6.3.1 General campus student-faculty ratio, Universitywide
Academic staffing ratios dashboard | Student faculty ratio
source: UC Information Center
One measure of academic quality is the student-faculty ratio, which reflects resources available for instruction and the average availability of faculty members to every student. Thus, lower ratios are preferable for students.
Because the student-faculty ratio varies considerably by degree, major, and instructional level (lower-division, upper-division, and graduate), student experiences will vary as well. Indicators 6.3.2 and 6.3.3 on student credit hours (SCH) provide additional insight into the student experience.
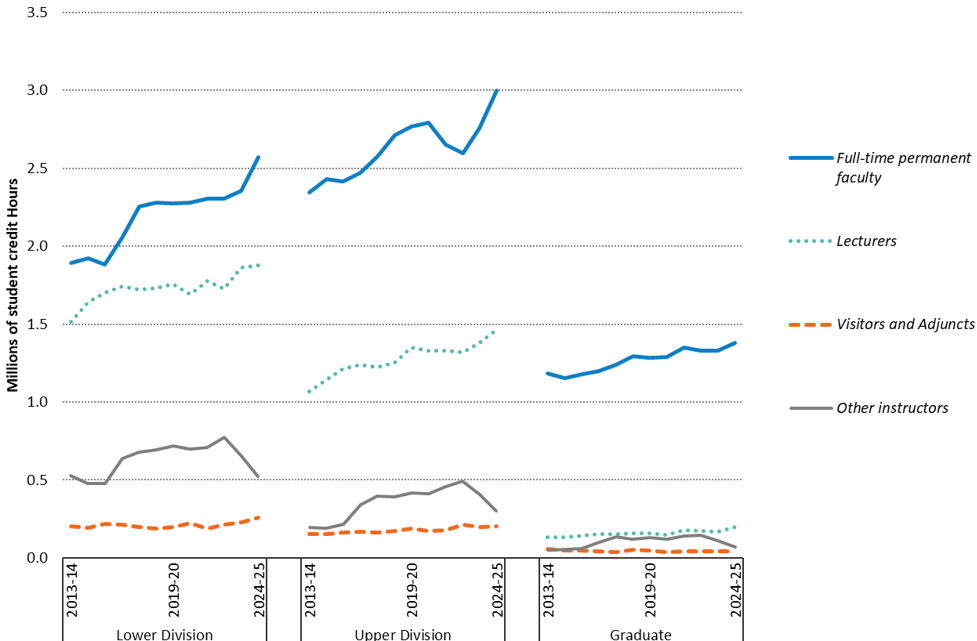
Overall, a larger number of student credit hours are performed by full-time permanent faculty who are leading scholars in their disciplines.
6.3.2 Student credit hours, by instructional staff and class size, Universitywide, 2013–14 to 2024–25
source: UC Faculty Instructional Activities dataset
Student credit hours (SCH) represent the number of student enrollments in a course multiplied by the number of credits earned from that course. For example, a four-credit class with 50 students generates 200 SCH; a two-credit class of 15 students generates 30 SCH. This measure gives an indication of the relative teaching load across different types of instructors at different levels of instruction.
Lower-division courses such as writing, language, and other required courses are most often taught by lecturers (36 percent of lower division SCH in 2024–25); introductory courses to the major are most often taught by full-time permanent faculty (49 percent). Upper-division courses, which are core to the student’s major, are more likely taught by full-time permanent faculty (60 percent of upper division SCH in 2024–-25), as are graduate courses (82 percent of graduate SCH in 2024–25). In 2023–24, UC San Diego updated their categorization method, resulting in fewer instructors in the Other instructors category and more instructors in the Full-time permanent faculty and Lecturers categories. The changes to UC San Diego’s categorization method are also reflected in indicator 6.3.3. below.
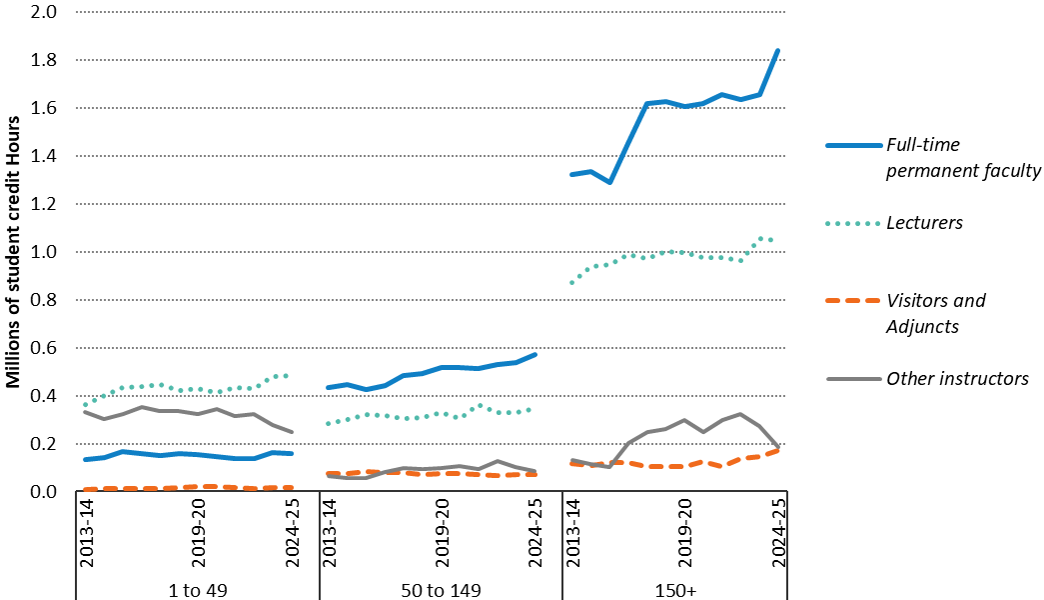
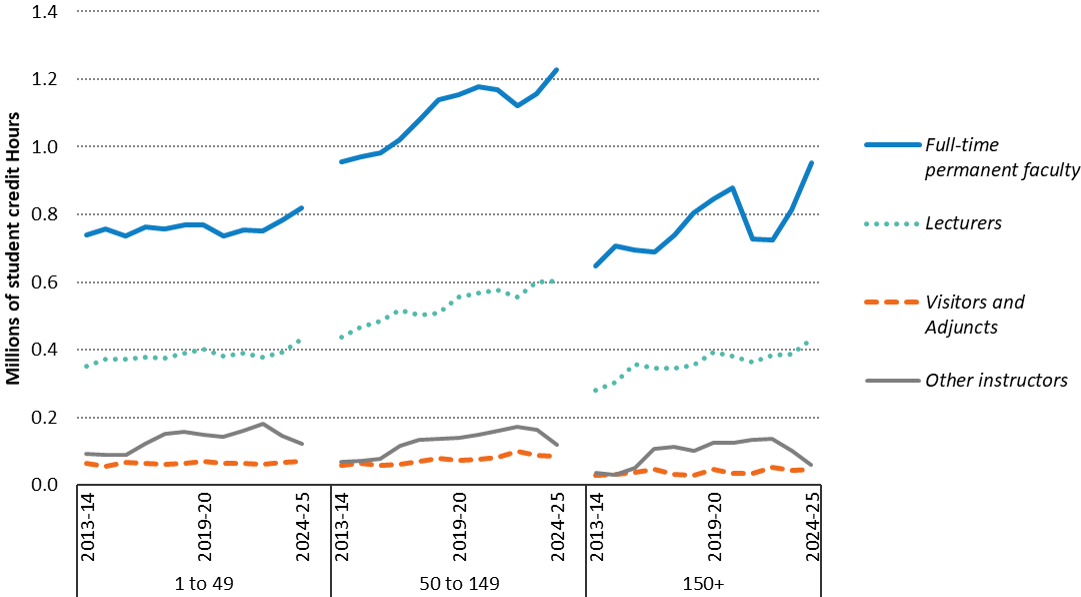
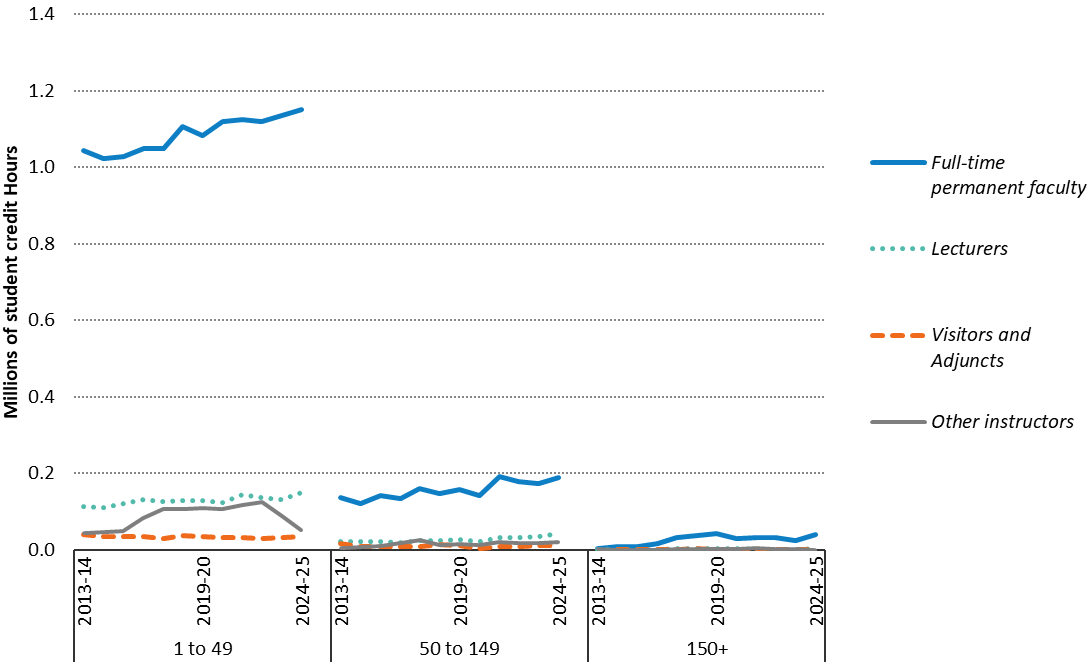
As students enroll in upper-division and graduate classes, they have greater contact with full-time permanent faculty and smaller classes.
6.3.3 Student credit hours, by instructional staff and class type and class size, Universitywide, 2013–14 to 2024–25
Lower-division classes (scale 0–2.0M)
Upper-division classes (scale 0–1.4M)
Graduate classes (scale 0–1.4M)
source: UC Faculty Instructional Activities dataset
In the lower division, full-time permanent faculty generally teach large lecture classes (57 percent of SCH in classes with 150 or more students); lecturers generally teach both large sections and smaller classes (54 percent of SCH in classes with less than 50 students and 32 percent of SCH in classes with more than 50 students). In the upper division, student contact with full-time permanent faculty is fairly evenly distributed across classes of all sizes (57 to 64 percent of SCH).
Graduate academic students are almost uniformly taught by full-time permanent faculty in classes with fewer than 50 students (83 percent of SCH in 2024–25). The large enrollment increases in 2016–17 and 2017–18 resulted in a substantial uptick in SCH being offered in large lower-division lecture classes.
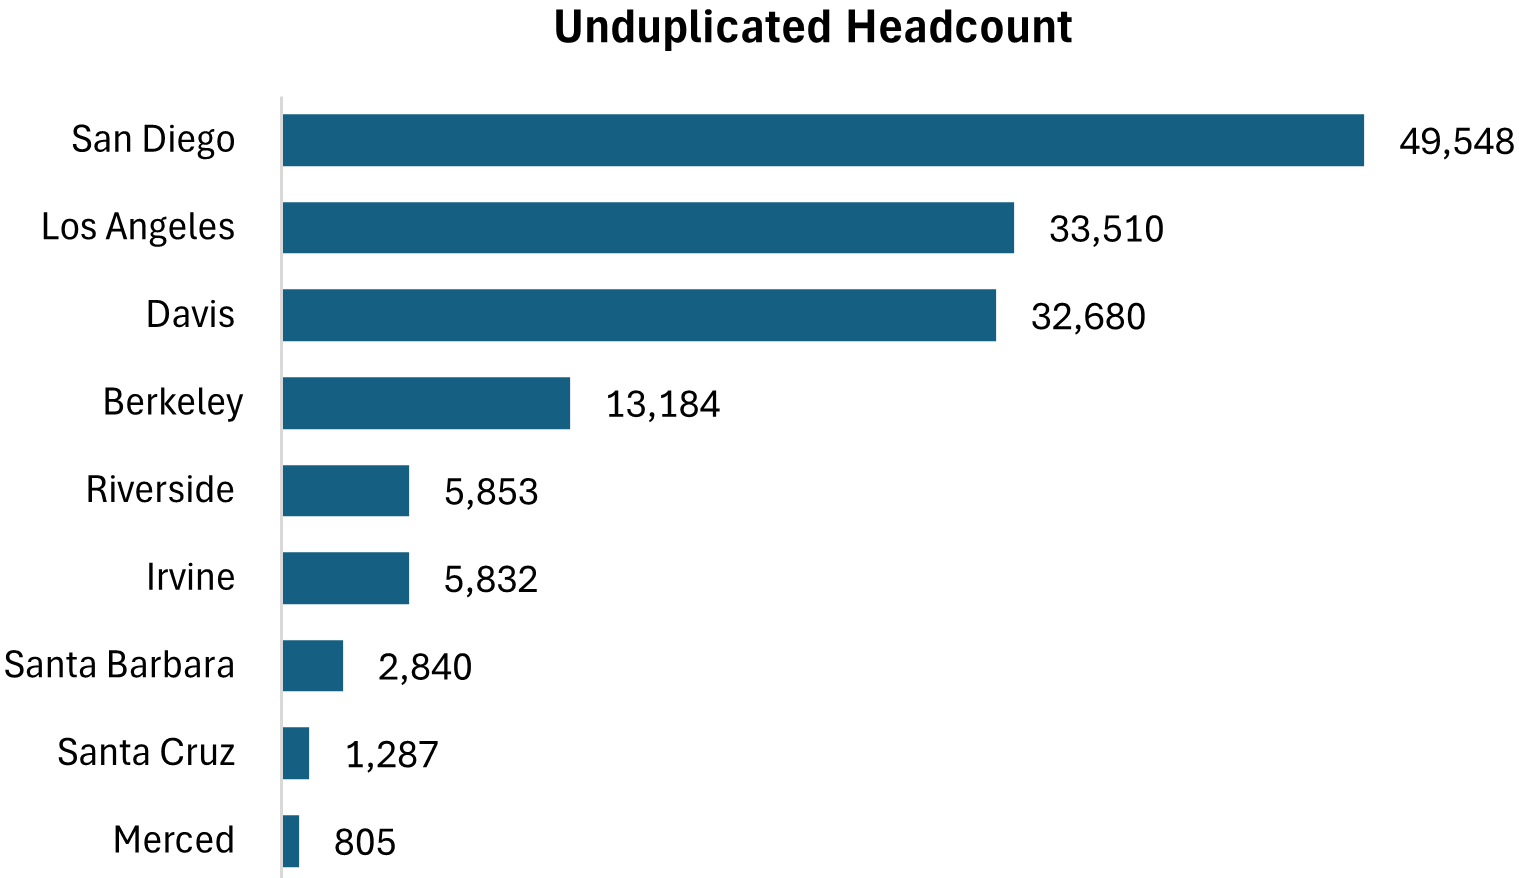
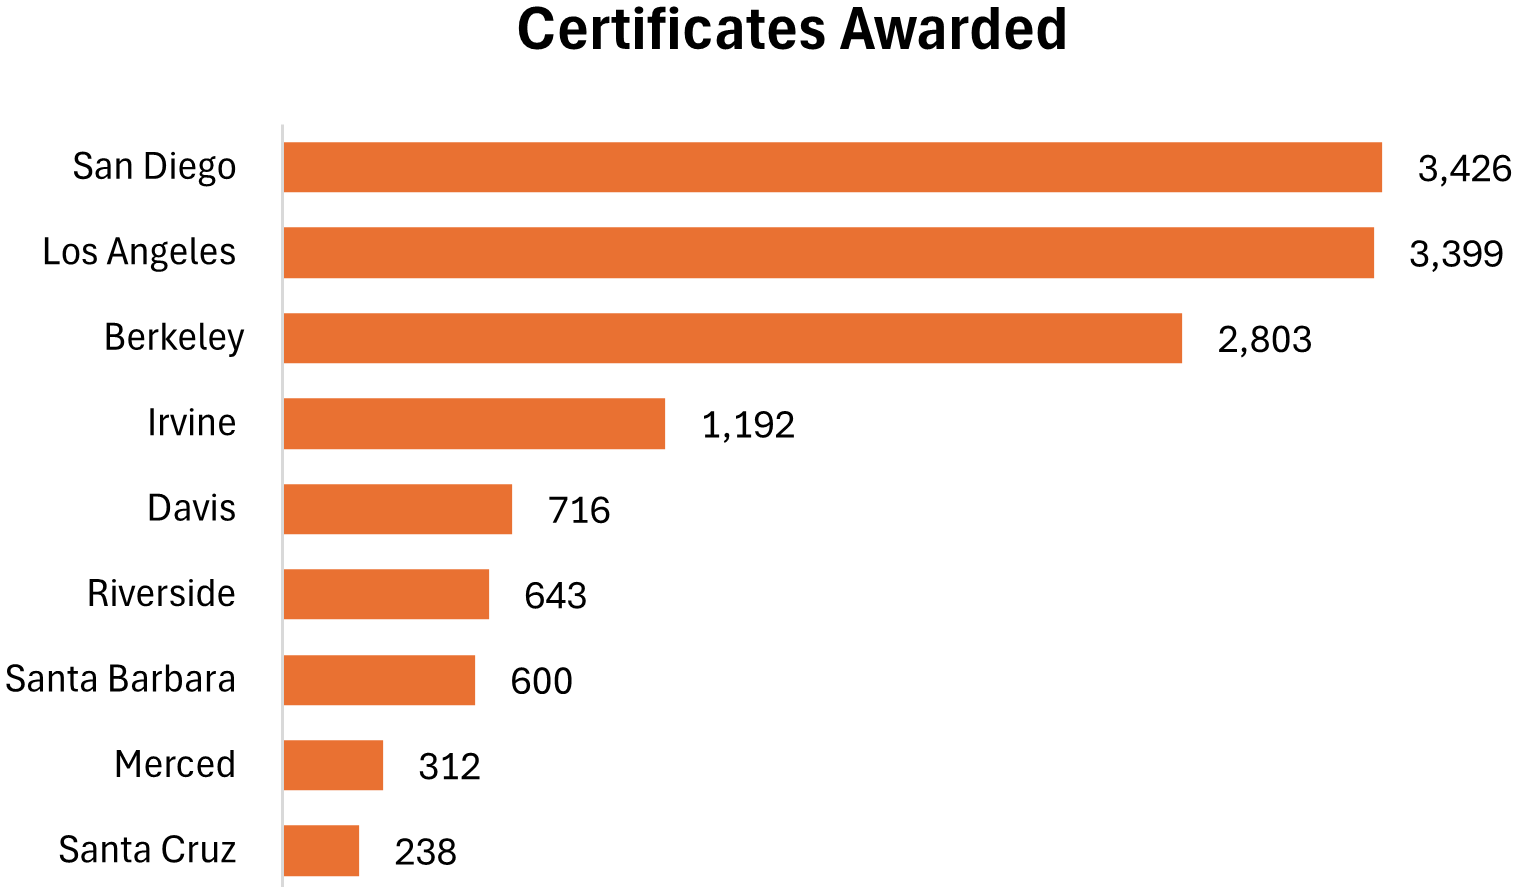
UC Extension extends UC’s public mission by delivering flexible, career-aligned education to over 145,000 students annually while supporting regional workforce needs.
6.4.1 UC Extension enrollment and certificates awarded, 2024–25
source: UC Extension
UC Extension programs systemwide serve a large and diverse learner population, with 332,327 enrollments across 145,539 unique students in 2024–25. In the same year, Extension offered more than 10,400 courses across in-person, hybrid, and online formats, and awarded over 13,000 certificates. Programs emphasize workforce-aligned, non-degree credentials in high-demand fields such as business, healthcare, STEM, education, and public service, supported by nearly 1,000 FTE staff and over 4,000 instructors. Extension also plays a significant public service role, partnering with employers and public agencies to support career advancement, workforce development, and lifelong learning across California and beyond.
For more information
Explore the UC Information Center dashboards that provide downloadable data and context on Teaching and Learning.
universityofcalifornia.edu/about-us/information-center
In addition to those dashboards supporting indicators in this chapter, other examples include:
Other resources
Download data tables for chapter 6 indicators (Excel format)
Chapter Six: Teaching and Learning
Key takeaways:
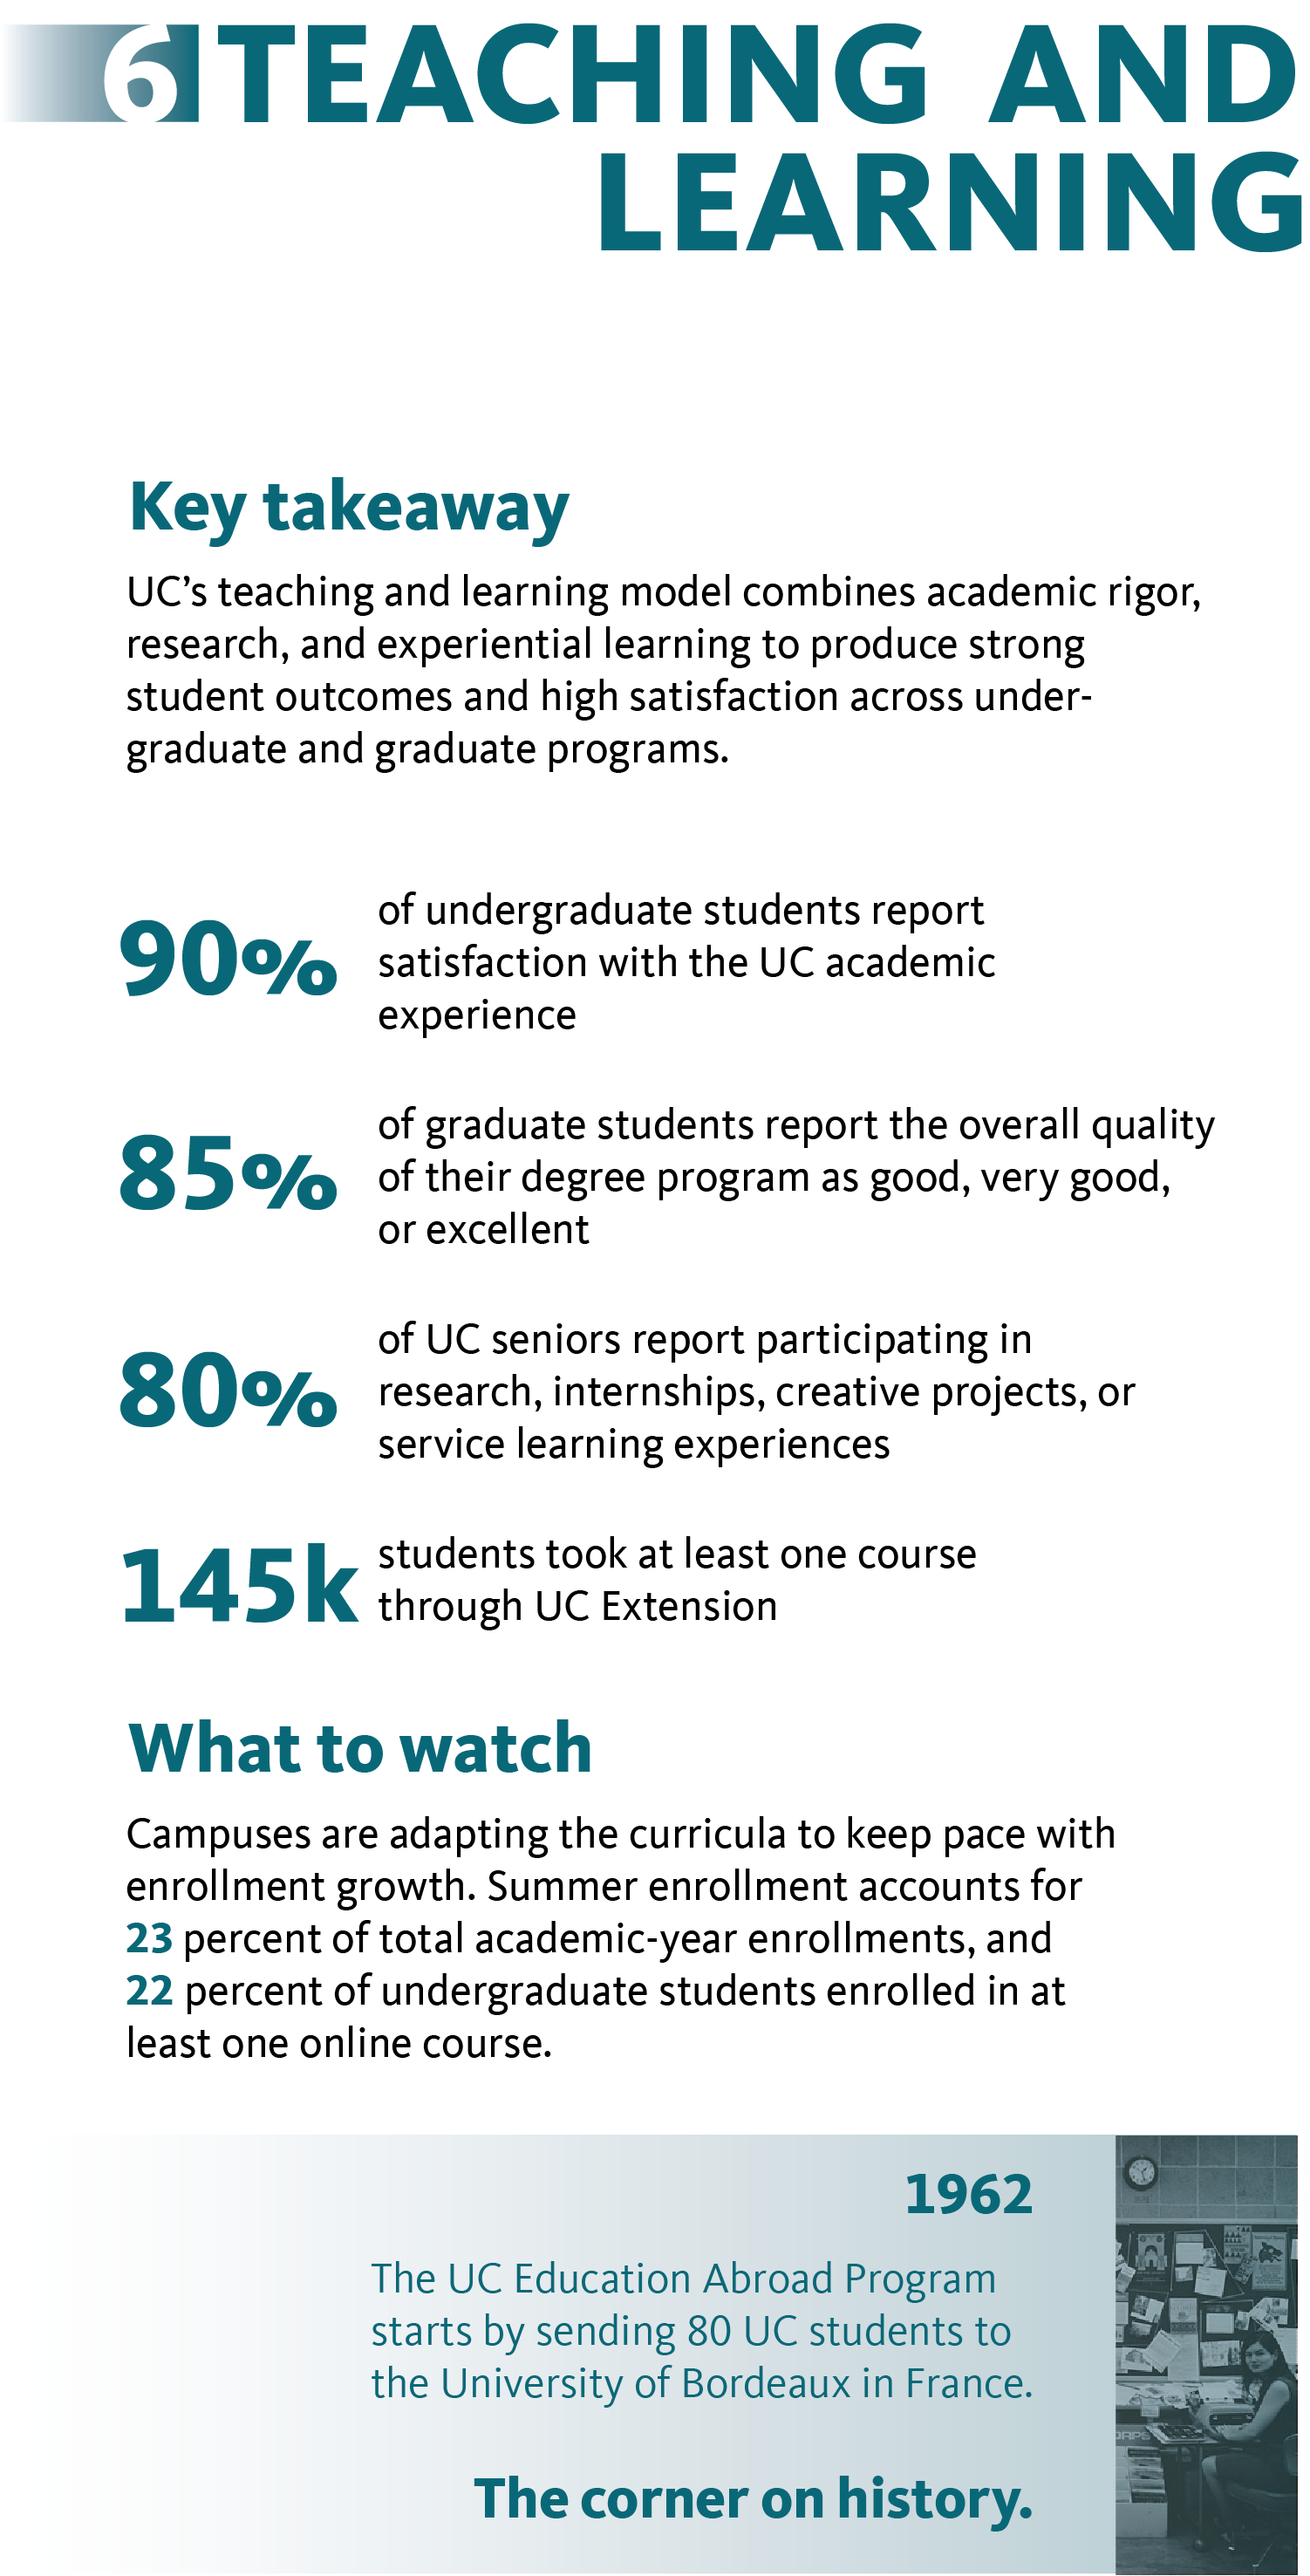
- UC’s teaching and learning model combines academic rigor, research, and experiential learning to produce strong student outcomes and high satisfaction across undergraduate and graduate programs.
- Ninety percent of undergraduate students report satisfaction with the UC academic experience.
- Eighty-five percent of graduate students report the overall quality of their degree program as good, very good, or excellent.
- Eighty percent of UC seniors report participating in research, internships, creative projects, or
service-learning experiences.
- One hundred and forty-five thousand students took at least one course through UC Extension.
What to watch:
Campuses are adapting the curricula to keep pace with enrollment growth. Summer enrollment accounts for twenty-three percent of total academic-year enrollments, and twenty-two percent of undergraduate students enrolled in at least one online course.
UC’s corner on history:
In 1962, The UC Education Abroad Program started by sending 80 UC students to the University of Bordeaux in France.