Student diversity at UC spans multiple dimensions of identity.
7.1.1 Student demographic profile

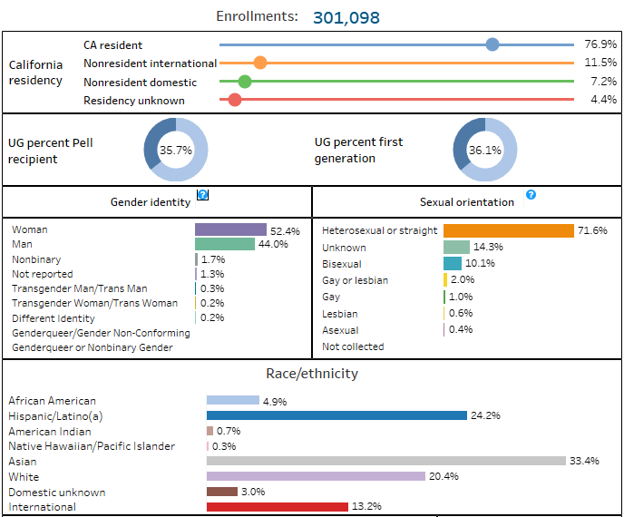
Fall enrollment at a glance dashboard
source: UC Information Center
As a land grant institution in a majority-minority state, Regents Policy 4400 states that because UC’s core mission is to serve the interests of the State of California, UC must seek to achieve diversity, inclusion, and accessibility among its student bodies and its employees. UC does not make admissions or hiring decisions based on race, ethnicity, gender, or other demographic characteristics, but it does need to understand both the demographic characteristics, climate, and other aspects that ensure UC creates an inclusive environment where everyone can succeed.
note: Includes graduate and undergraduate students combined.
Students’ educational pathways, life experiences, and personal circumstances contribute to the diversity of the UC community.
7.1.2 Additional student characteristics
- 26% of undergraduates reporting a disability* (UCUES 2024)
- 29% of graduate students reporting a disability* (UCGSES 2025)
- 1,922 of military-affiliated students enrolled at UC in Fall 2024
- 1,308 of current and former foster youth enrolled as undergraduates in Fall 2024
source: UC Information Center
*Disability prevalence is estimated based on UCUES and UCGSES self-reports. Not all students with disabilities choose to disclose their condition or to request accommodation.
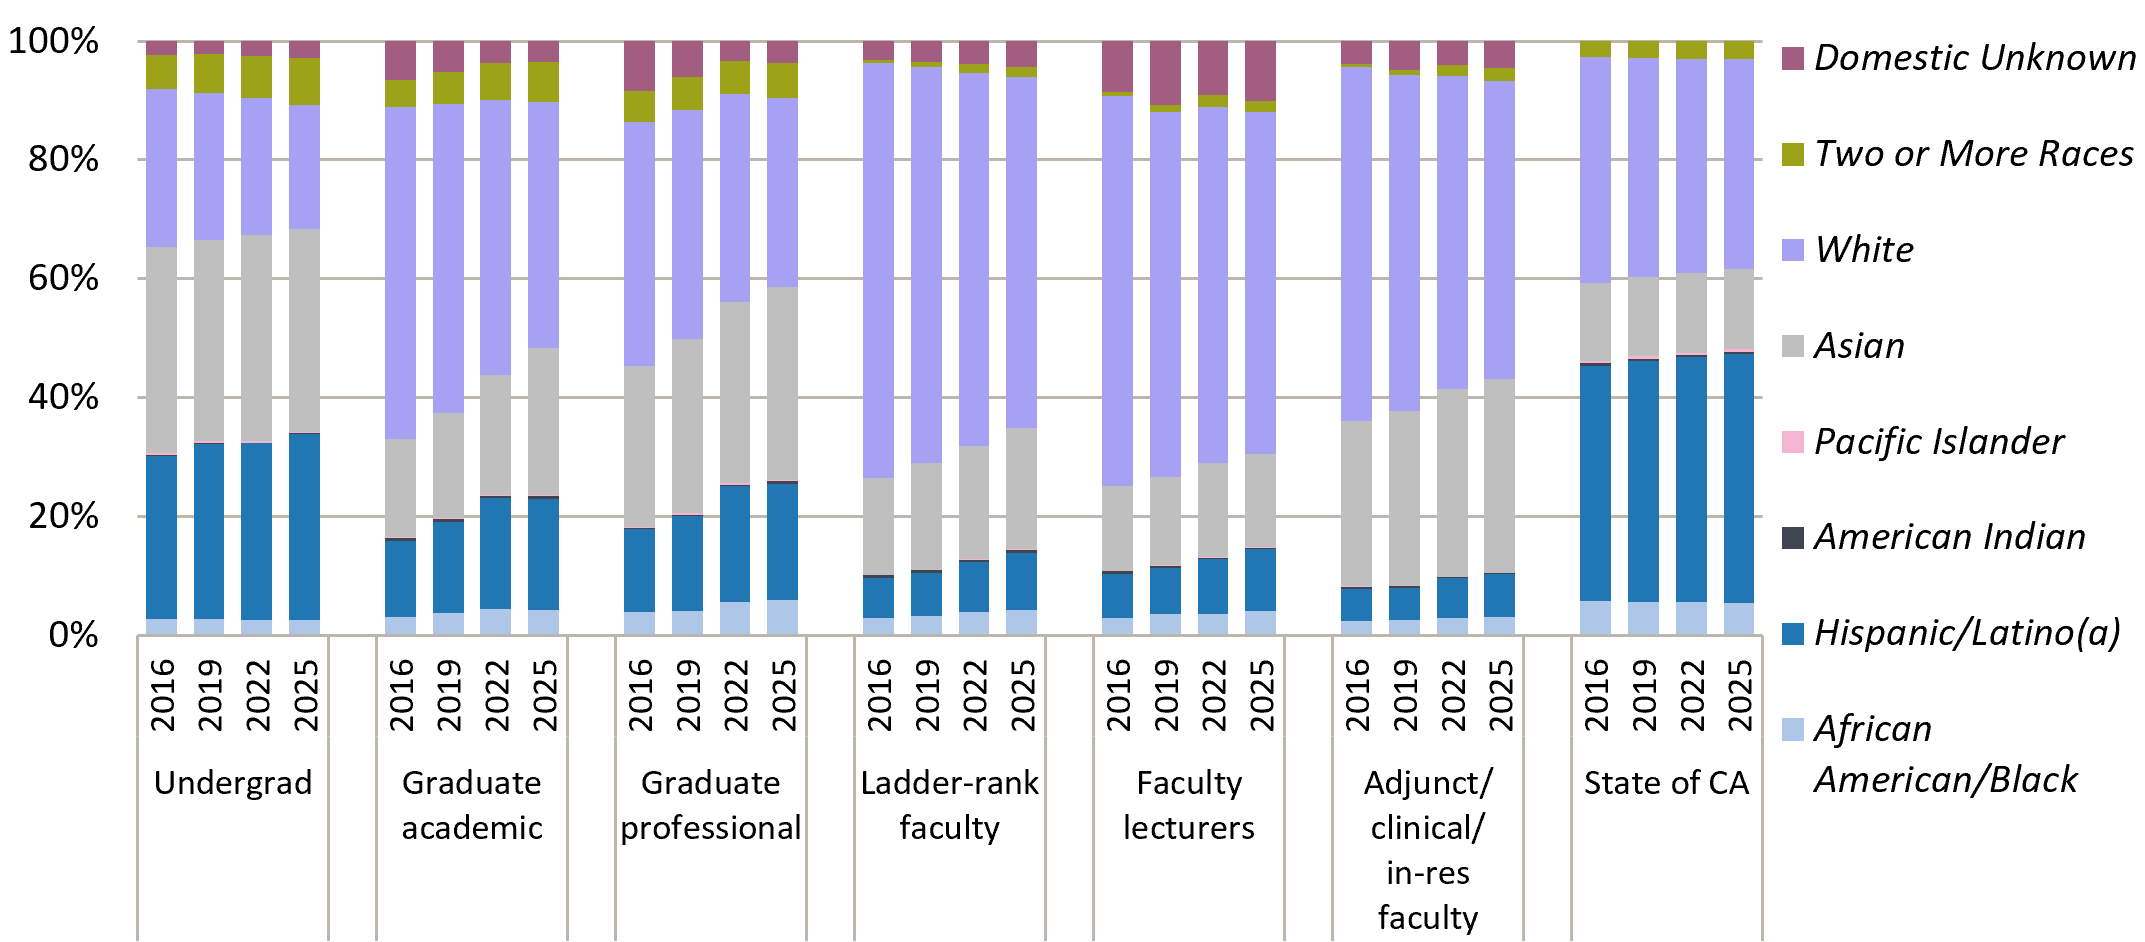
Student populations are more racially and ethnically diverse than faculty populations, reflecting differences across educational and career pathways.
7.1.3 Student and faculty diversity comparison
sources: UC Information Center Data Warehouse, UC Path, and California Department of Finance
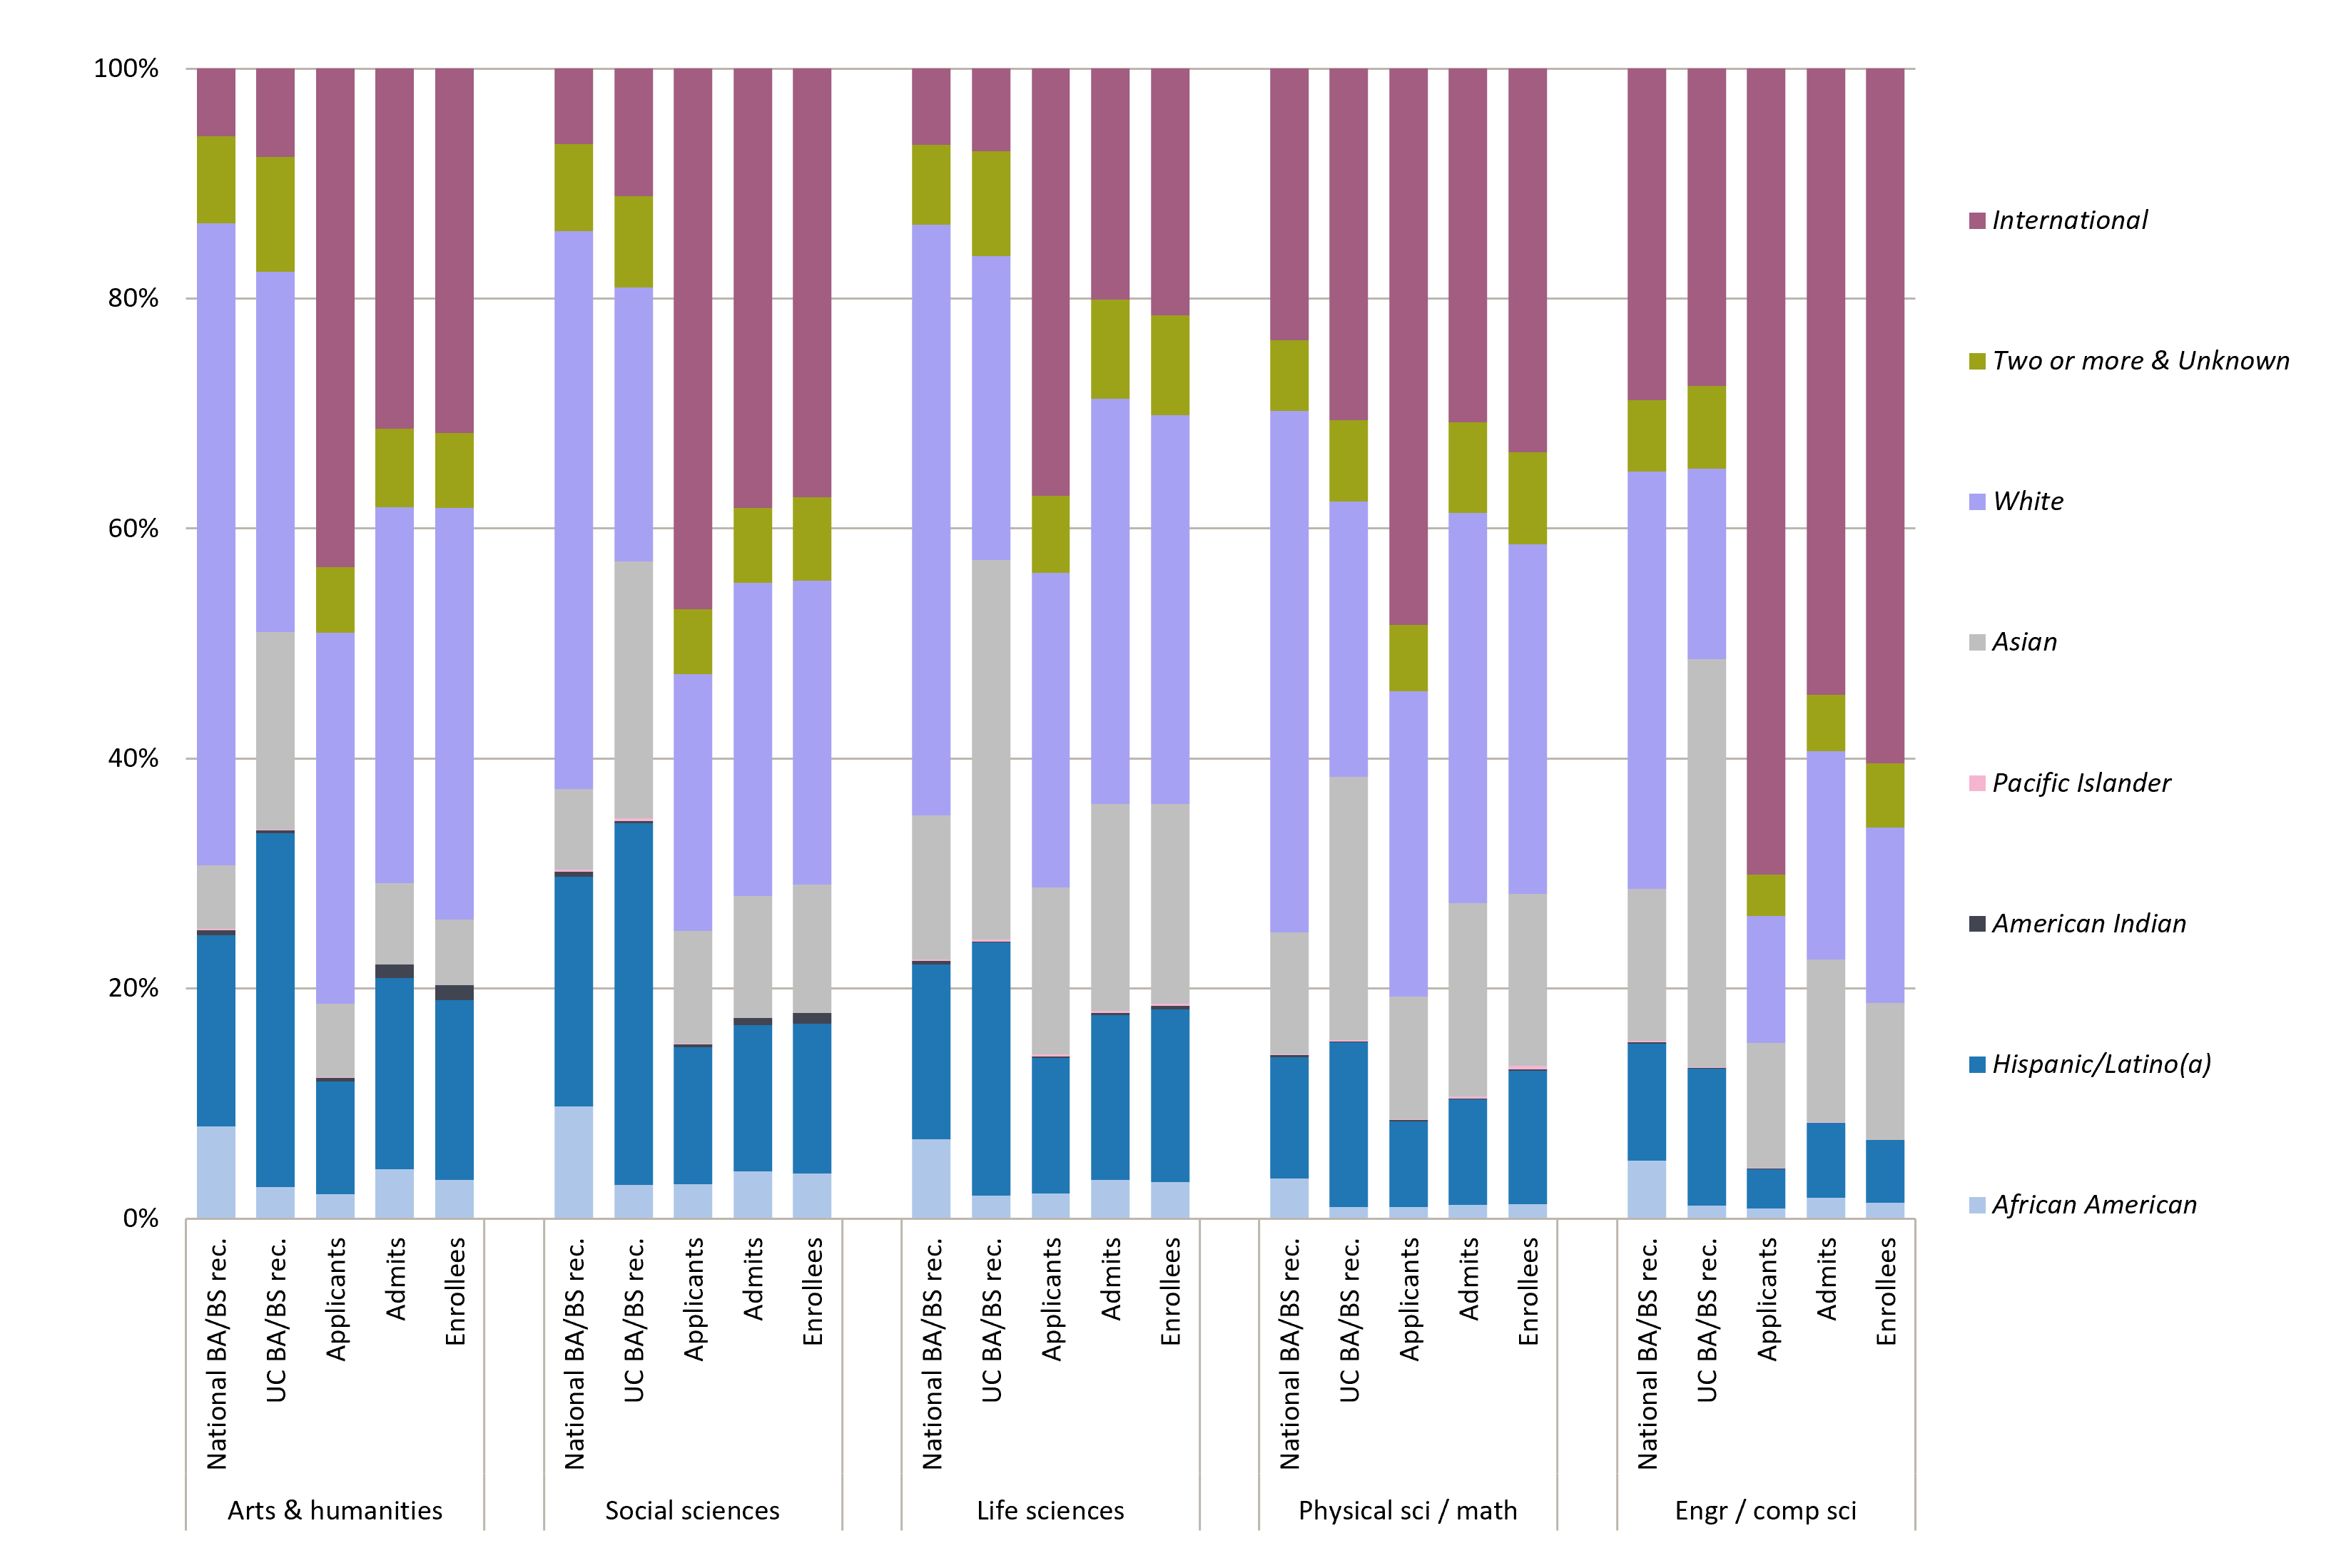
This indicator compares the racial and ethnic composition of bachelor's degree recipients, UC doctoral applicants, admits, and enrollees across major fields of study. Examining each stage of the doctoral admissions process helps identify how representation differs across disciplines and where demographic patterns shift along the pathway to doctoral education.
note: Undergraduates include postbaccalaureate teaching credential students. Only includes U.S. citizens and permanent residents for students; all faculty, and all state of California residents, are included regardless of residency.
Comparing each stage of the pipeline highlights differences in educational opportunity and access to UC across groups.
7.2.1 Undergraduate pipeline composition
sources: California Department of Education, UC Data Warehouse
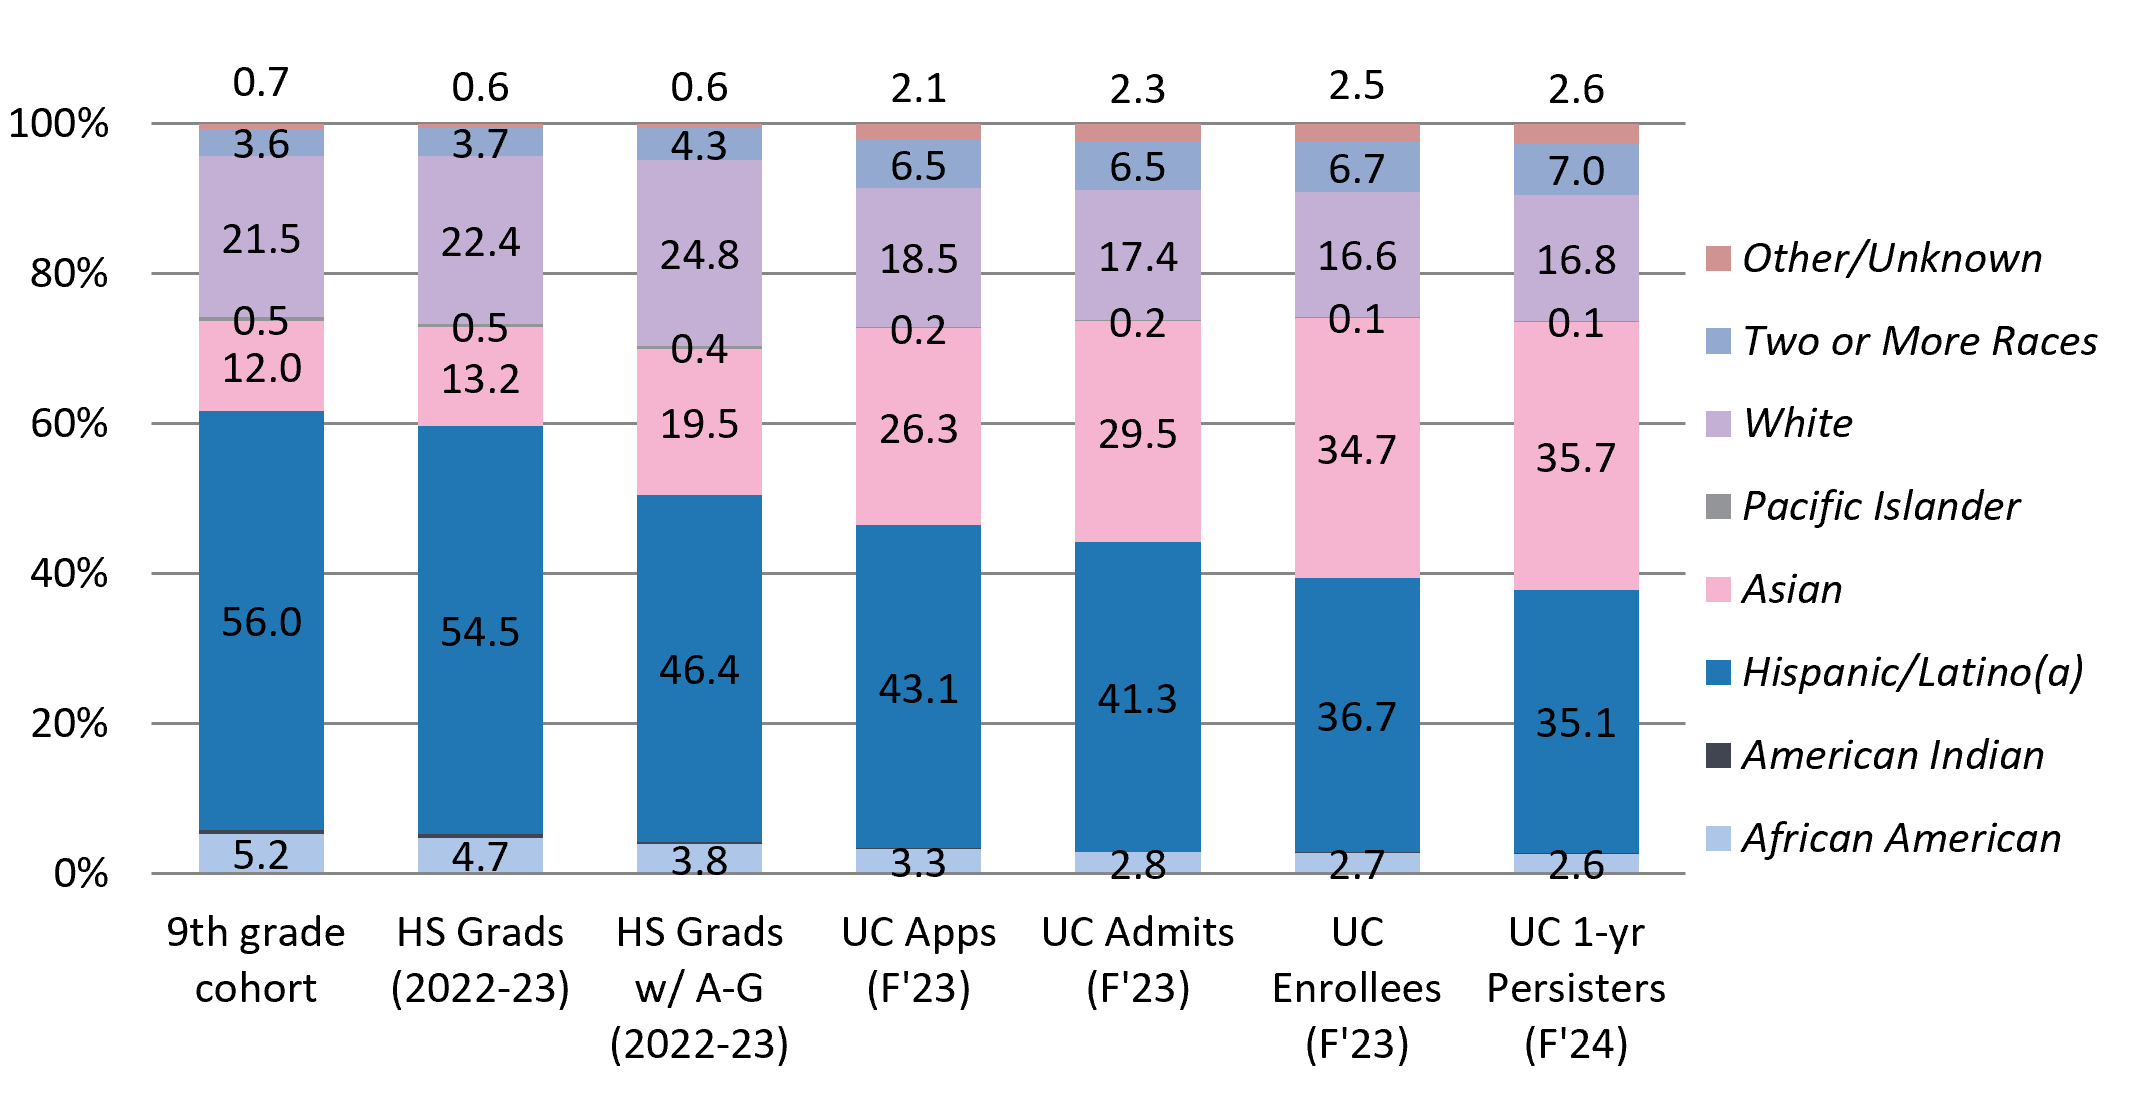
This indicator shows how the racial and ethnic composition of students changes along the pathway from California’s ninth-grade population to enrollment and persistence at UC. Comparing each stage of the pipeline highlights differences in educational opportunity and access to UC across groups.
Progress has narrowed some representation gaps in the pathway from California public high schools to UC. Gaps in admissions are closing faster than gaps in enrollment.
7.2.2 Freshman opportunity gaps
Gap analysis dashboard | Gap chart - freshman
source: UC Information Center
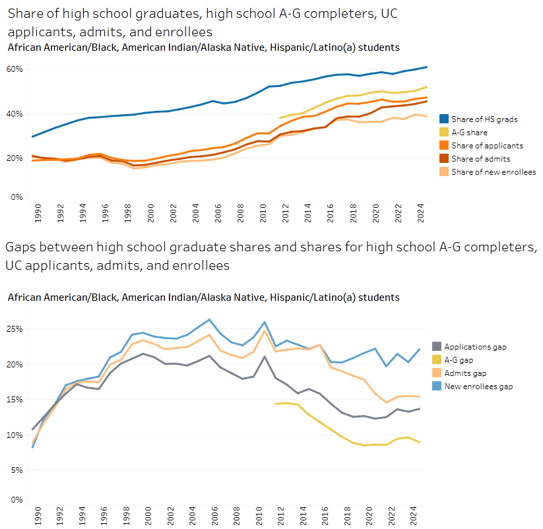
This indicator tracks the representation of African American/Black, American Indian/Alaska Native, and Hispanic/Latino(a) students from California high school graduation through UC enrollment. The top chart shows representation at different stages of the pathway, while the bottom chart shows changes in the size of representation gaps over time. Despite progress, students from these groups remain underrepresented at UC relative to their share of California high school graduates.
Representation gaps along the transfer pathway from California community colleges to UC have been increasing since 2018.
7.2.3 Transfer opportunity gaps
Gap analysis dashboard | Transfer
source: UC Information Center
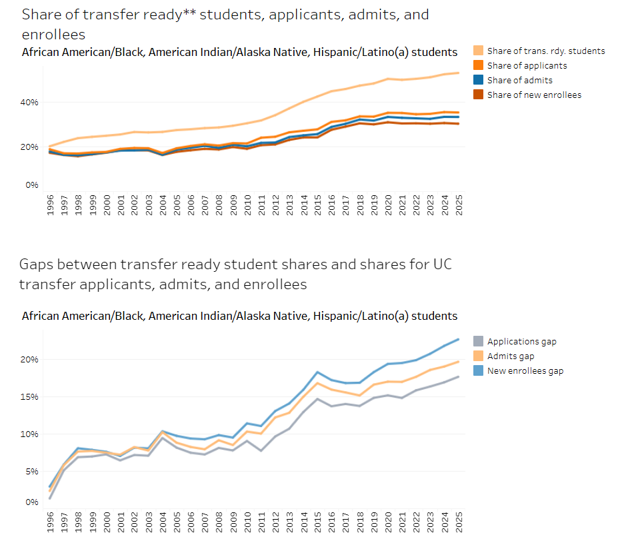
This indicator tracks the representation of African American/Black, American Indian/Alaska Native, and Hispanic/Latino(a) students from transfer readiness at California community colleges through UC transfer enrollment. The top chart shows representation at different stages of the transfer pathway, while the bottom chart shows changes in the size of representation gaps over time. Representation gaps have widened over time, particularly among enrolled transfer students.
The demographic composition of UC doctoral programs reflects national and international recruitment patterns that vary by discipline.
7.2.4 Pathways to doctoral education: race/ethnicity
sources: Integrated Postsecondary Educational Data System; UC Information Center Data Warehouse
Just as faculty are recruited from national and international pools, UC doctoral programs recruit nationally and internationally. As a result, the demographic composition of doctoral programs often differs from that of UC undergraduates.
note: Racial/ethnic distribution of U.S. BA/BS degree recipients from U.S. and UC institutions compared to UC doctoral applicants, admits, and enrollees, Universitywide, 2023–24.
Gender representation in doctoral programs differs substantially across academic disciplines.
7.2.5 Pathways to doctoral education: gender
sources: Integrated Postsecondary Educational Data System; UC Information Center Data Warehouse
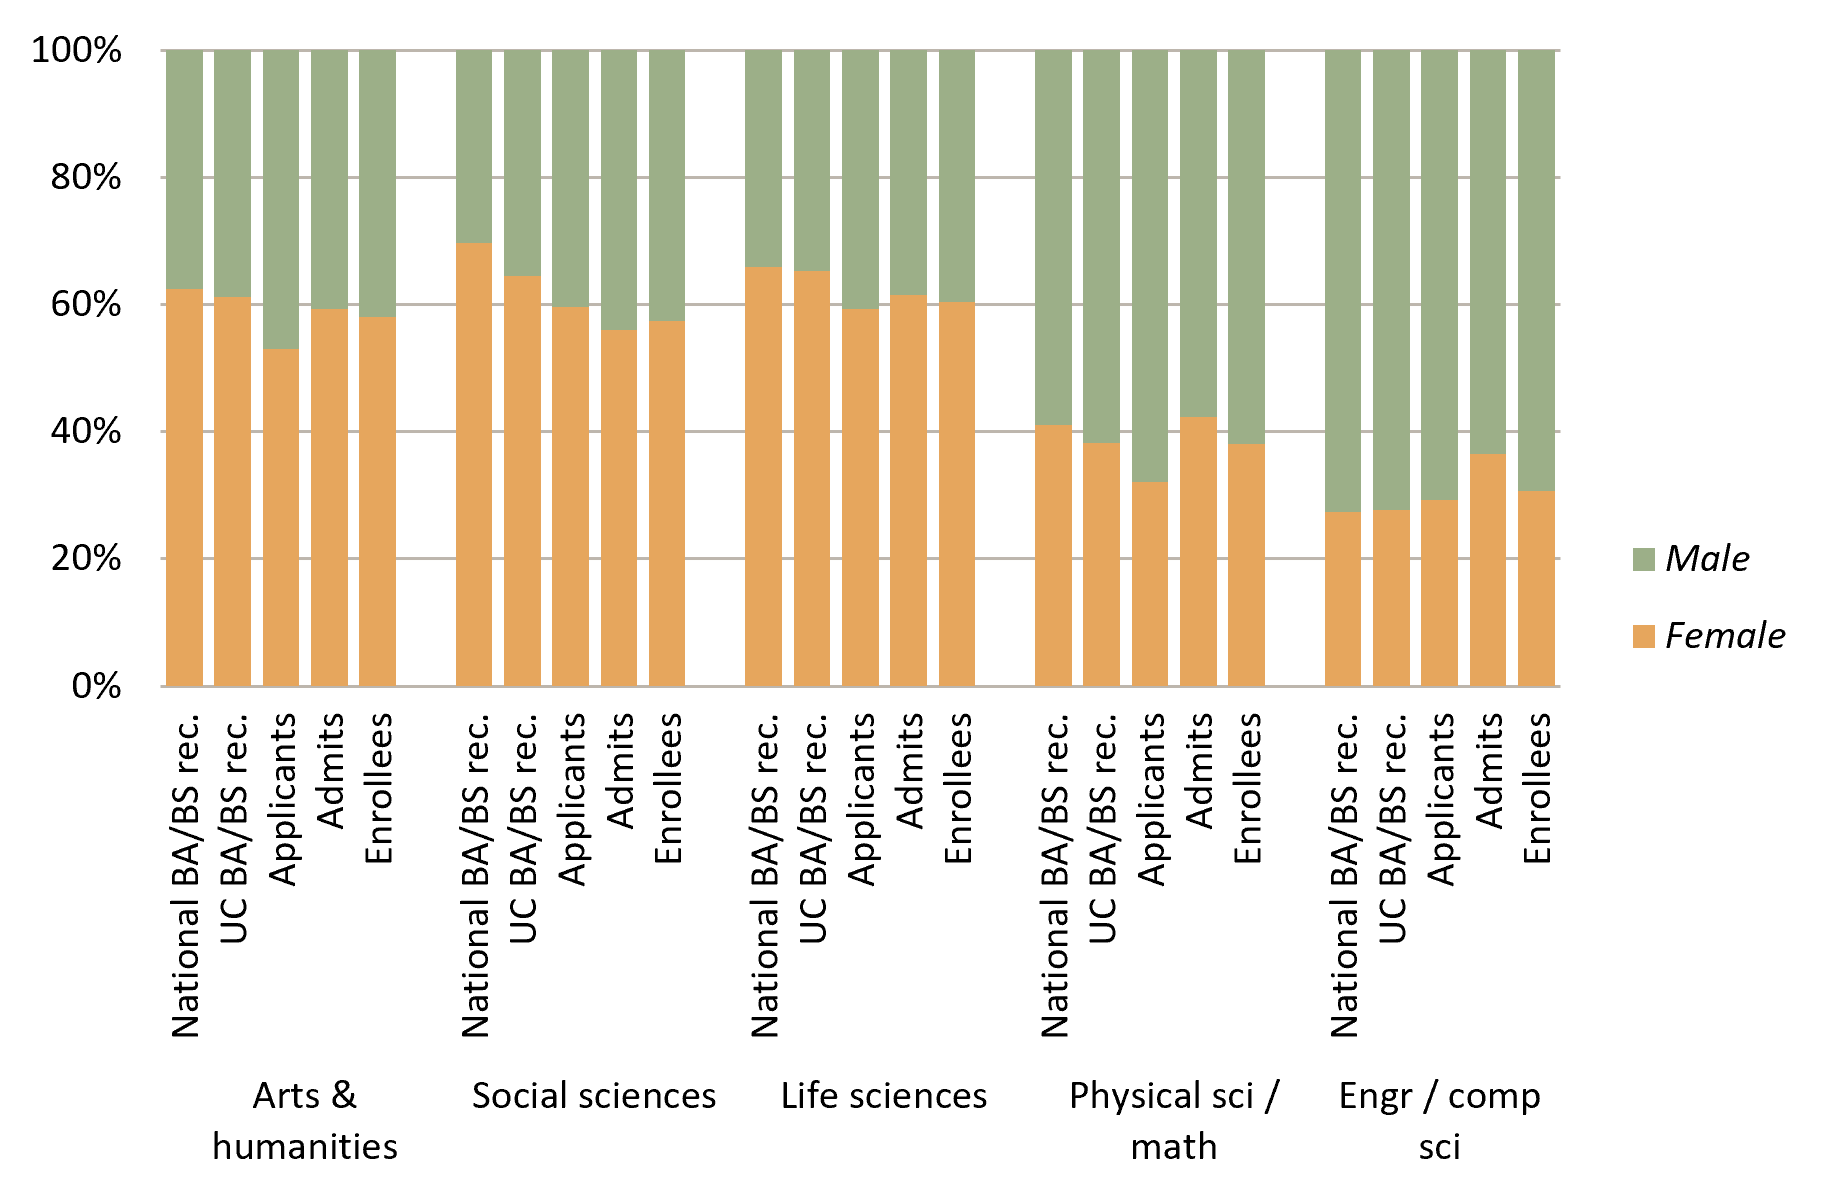
Comparing doctoral applicants, admits, and enrollees with bachelor’s degree recipients nationally and at UC helps place these differences in context.
note: Gender distribution of U.S. BA/BS degree recipients from U.S. and UC institutions compared to UC doctoral applicants, admits, and enrollees, Universitywide, 2023–24.
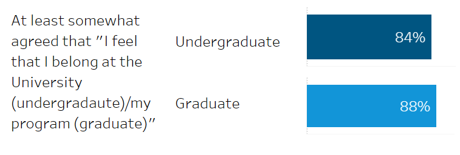
Most UC students report feeling that they belong at the University or in their academic program.
7.3.1 Overall belonging
UC campus and program climate dashboard
source: UC Information Center
Students’ sense of belonging is closely linked to academic success, persistence, and well-being. Tracking belonging helps UC understand whether students feel connected to their campus community and supported in their educational experience.
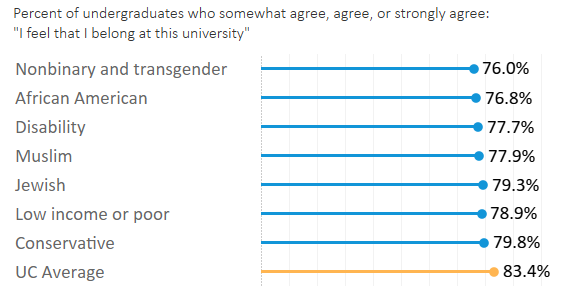
Undergraduates generally report strong belonging, but experiences vary across student communities and dimensions of identity.
7.3.2 Belonging across undergraduate communities
UC campus and program climate dashboard | Undergraduate climate
source: UC Information Center
Examining belonging across student communities helps UC understand whether students experience campus climate differently based on their identities and life experiences. These differences can help identify opportunities to strengthen inclusion and support.
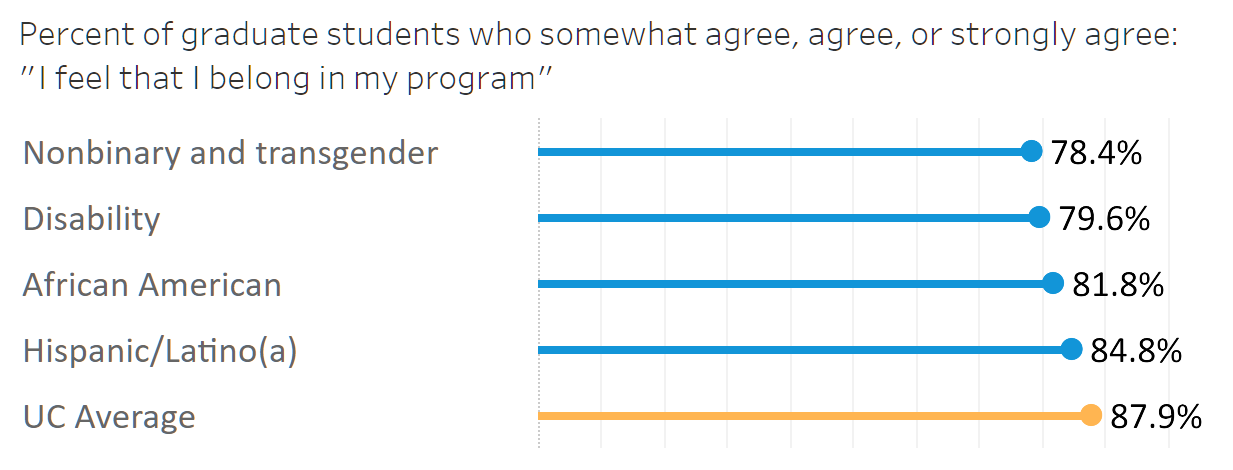
Most graduate students report a sense of belonging in their program, but experiences are not uniform across student groups.
7.3.3 Belonging across graduate student communities
UC campus and program climate dashboard | Graduate climate
source: UC Graduate Student Experience Survey 2025
Examining belonging across graduate student communities helps UC understand how students experience their academic programs. Differences in belonging can help identify opportunities to strengthen inclusion and support.
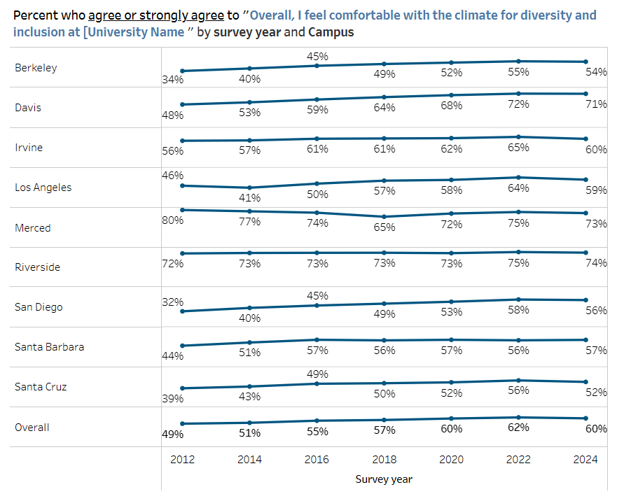
Undergraduate student experiences of climate, inclusion, and belonging vary across campuses, programs, and academic disciplines.
7.3.4 Trends in undergraduate student climate
UC campus and program climate | Undergraduate climate trend
source: UC Information Center
Systemwide climate surveys provide a broader view of student experiences than any single measure of belonging. Tracking these trends over time helps UC identify areas of strength and opportunities to improve campus climate across campuses and student communities.
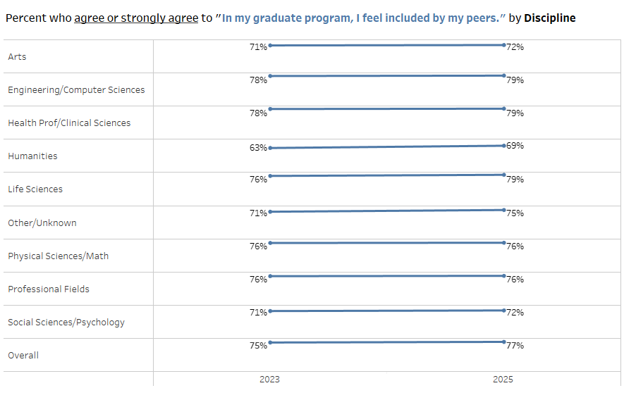
Graduate student experiences of climate, inclusion, and belonging vary across campuses, programs, and academic disciplines.
7.3.5 Trends in graduate student climate
UC campus and program climate | Graduate climate trend
source: UC Information Center
Systemwide climate surveys help UC understand how graduate students experience inclusion and belonging within their academic programs. Examining results across disciplines can help identify areas of strength and opportunities to improve the graduate student experience.
For more information
Explore the UC Information Center dashboards that provide downloadable data and context on equity, diversity, and inclusion with this subject area-specific url:
universityofcalifornia.edu/about-us/information-center#equity-diversity-and-inclusion
In addition to those dashboards supporting indicators in this chapter, other examples include:
- Equity, diversity, and inclusion
A landing page linking to multiple dashboards, including data on first-generation students, military-affiliated students, undergraduate current and former foster youth, and nonbinary students
- California high school graduation projections and A-G completion dashboard
with downloadable figures on high school graduation projections, graduation rates and A-G, and regional demographic projections
- UC equity and student success goals dashboard
with an Overview of progress toward goals to increase rates of timely graduation for low-income (Pell recipient) and first-generation students and for Black, Latino(a), and Native American students
Other resources
Download data tables for chapter 7 indicators (Excel format)
Chapter Seven: Diversity
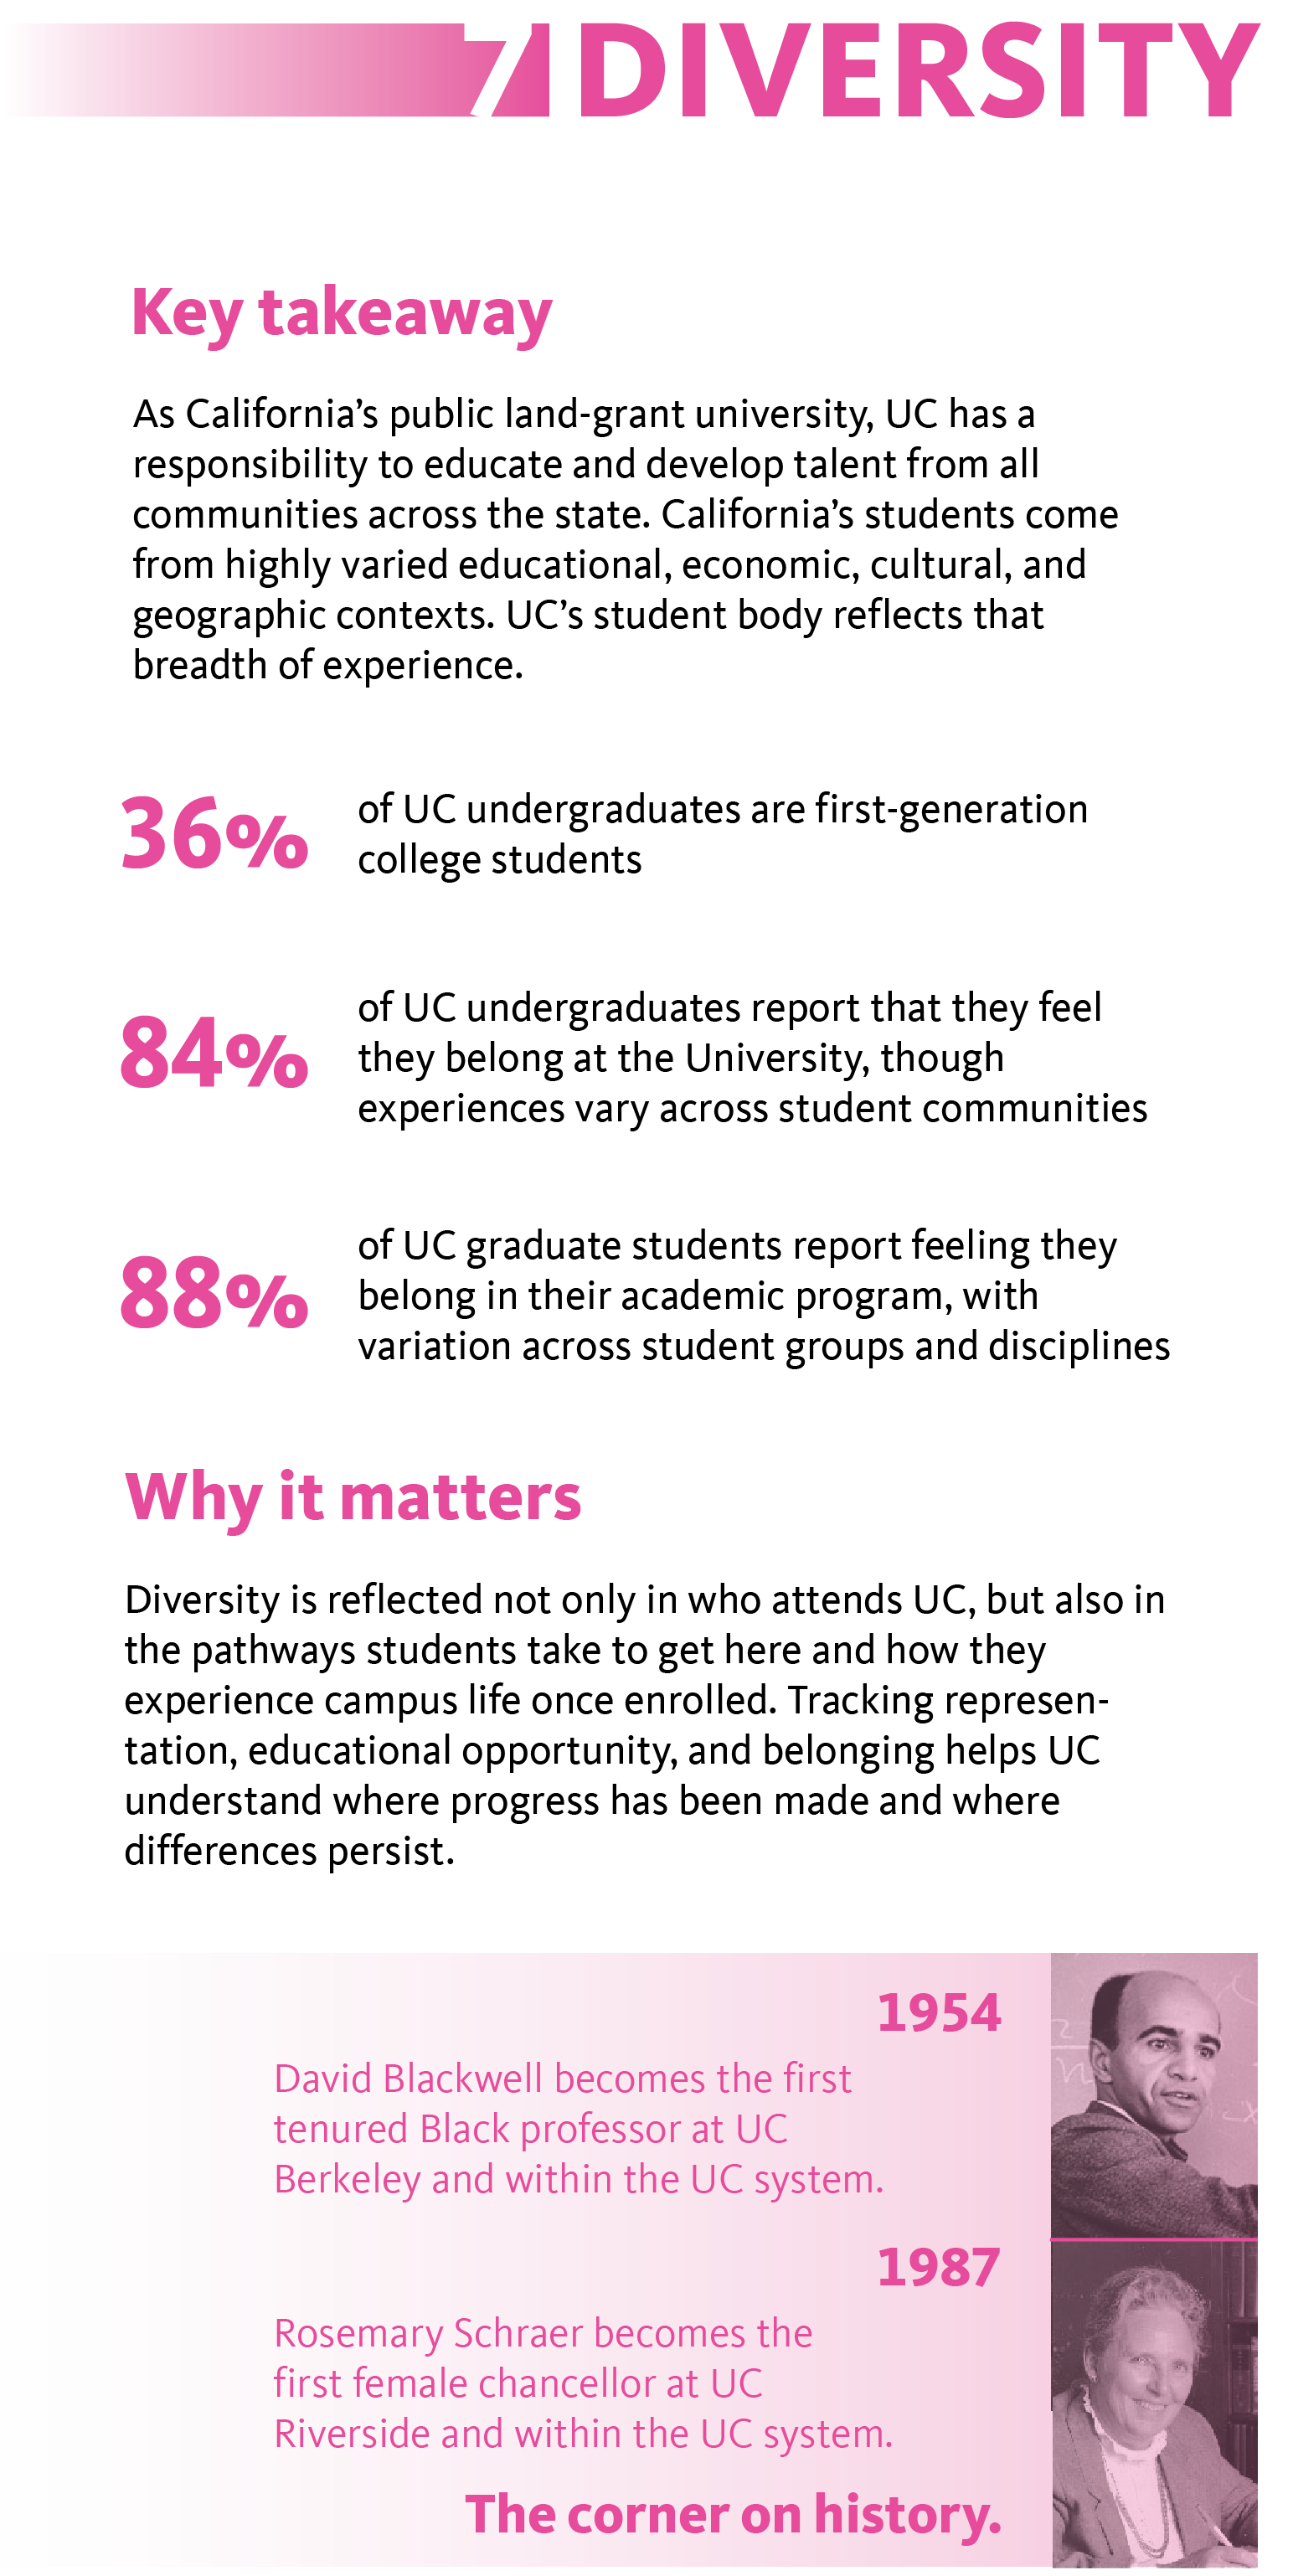
Key takeaways:
- As California’s public land-grant university, UC has a responsibility to educate and develop talent from all communities across the state. California’s students come from highly varied educational, economic, cultural, and geographic contexts. UC’s student body reflects that breadth of experience.
- Thirty-six percent of UC undergraduates are first-generation college students.
- Eighty-four percent of UC undergraduates report that they feel they belong at the University, though experiences vary across student communities.
- Eighty-eight percent of UC graduate students report feeling they belong in their academic program, with variation across student groups and disciplines.
Why it matters:
Diversity is reflected not only in those who attend UC, but also in the pathways students take to get here and how they experience campus life once enrolled. Tracking representation, educational opportunity, and belonging helps UC understand where progress has been made and where differences persist.
UC’s corner on history:
- In 1954, David Blackwell became the first tenured Black professor at UC Berkeley and within the UC system.
- In 1987, Rosemary Schraer became the first female chancellor at UC Riverside and within the UC system.