UC faculty receive prestigious awards for their leadership in their fields.
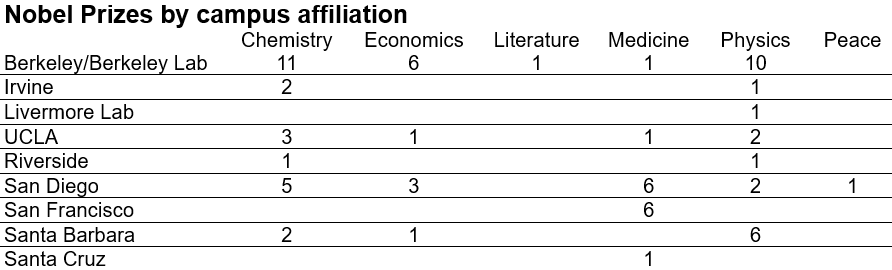
8.1.1 Prizes, medals, and awards won by UC faculty, researchers, and staff, with campus affiliation for Nobel Prizes
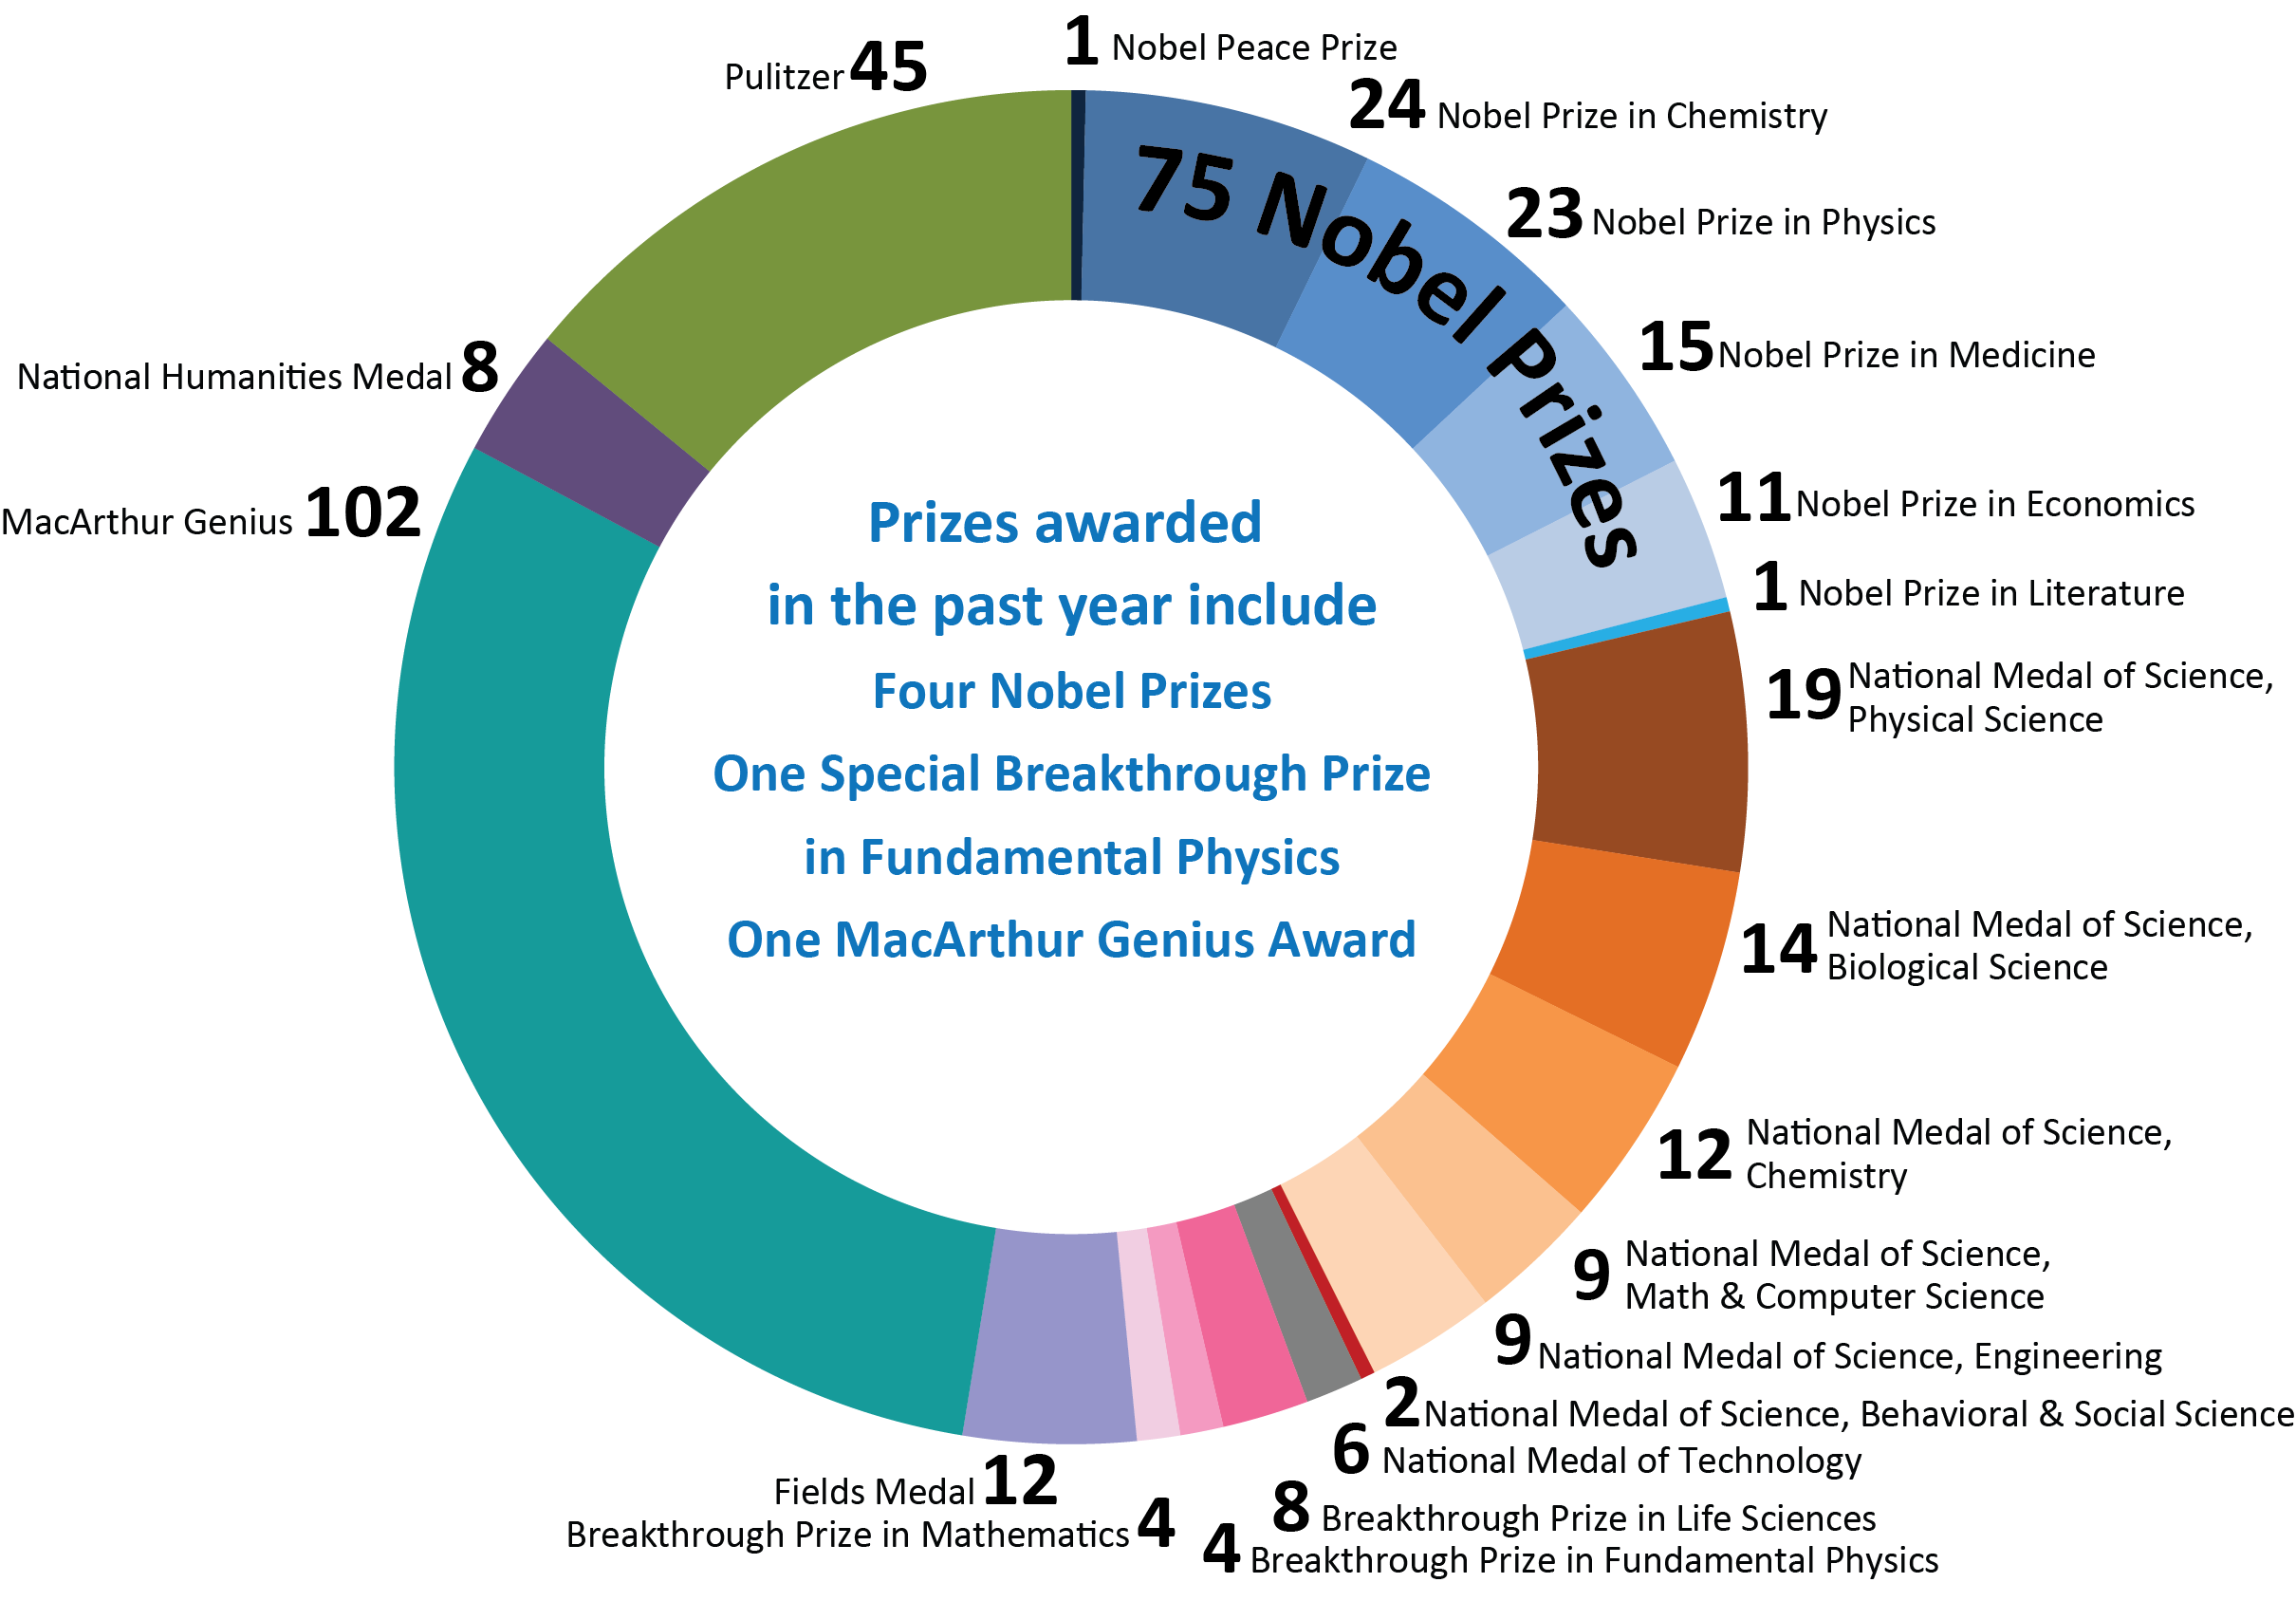
UC faculty have won 75 Nobel Prizes. This past year alone, UC faculty earned four Nobel Prizes, one Special Breakthrough Prize in Fundamental Physics, and one MacArthur Genius Award. These recognitions signal that UC continues to attract and retain faculty at the very top of their fields, which in turn drives the research enterprise and graduate education. Award-winning faculty are both a product and a driver of UC's academic strength. In addition to the prizes, medals, and awards noted in the chart, many UC faculty are members of prestigious National Academies, providing leadership in service and welfare to the nation.
| National Academy of Sciences |
|
746 |
| National Academy of Engineering |
|
305 |
| National Academy of Medicine |
|
286 |
| National Academy of Inventors |
|
162 |
Seventy-four faculty and researchers affiliated with the University of California have won 75 Nobel Prizes. A list of UC’s laureates can be found at the University of California Nobel Laureates website.
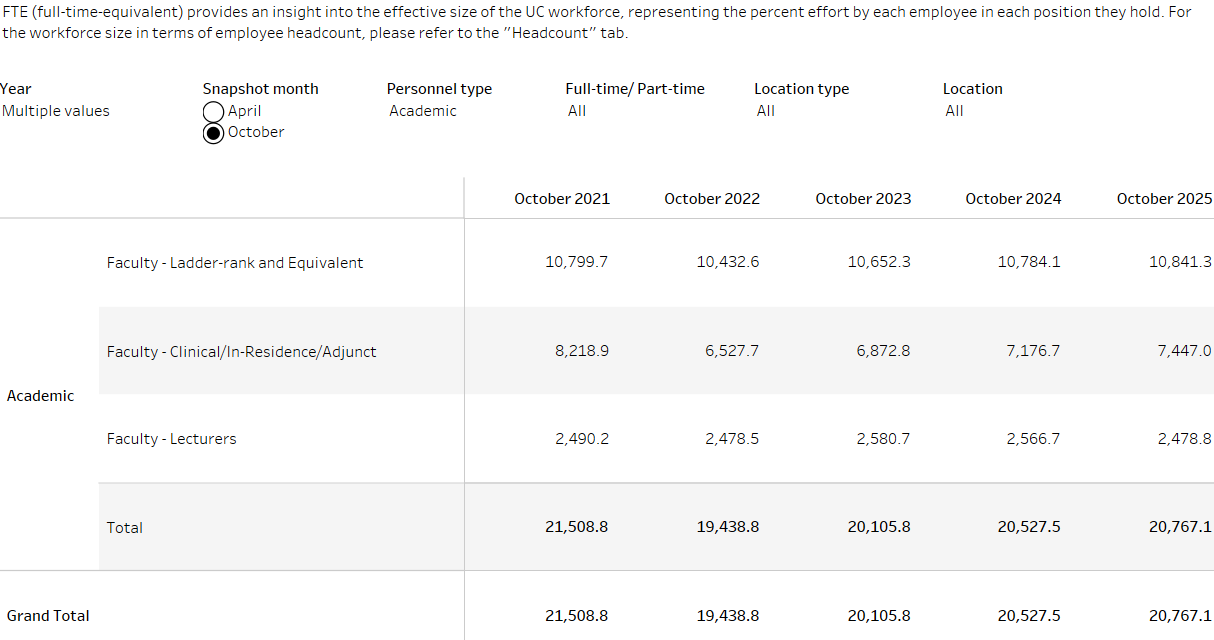
As of October 2025, UC had 20,767 FTE faculty, consisting of 52 percent ladder-rank and equivalent, 36 percent clinical/in-residence/adjunct, and 12 percent lecturers.
8.2.1 Faculty FTE total by type

UC employees, full-time equivalent (FTE) dashboard
source: UC Information Center
Ladder-rank and equivalent faculty are the core of the faculty in advancing UC’s tripartite mission of teaching, research, and public service. These faculty hold or can advance to tenure or equivalent status. In-Residence, Professor of Clinical (e.g., Medicine), Health Sciences Clinical Professor, and Adjunct Professor series faculty are concentrated in the health sciences; their duties vary in their focus on research, clinical care, and teaching. Lecturers are focused on instruction and are hired into part-time and full-time positions. Over the past five years, ladder-rank and lecturer faculty FTE have remained essentially flat. The only notable shift is in clinical, in-residence, and adjunct faculty FTE, which dropped sharply in 2022 and have not fully recovered since the pandemic. Overall faculty totals have remained relatively stable, but the gap in clinical, in-residence, and adjunct faculty is worth monitoring.
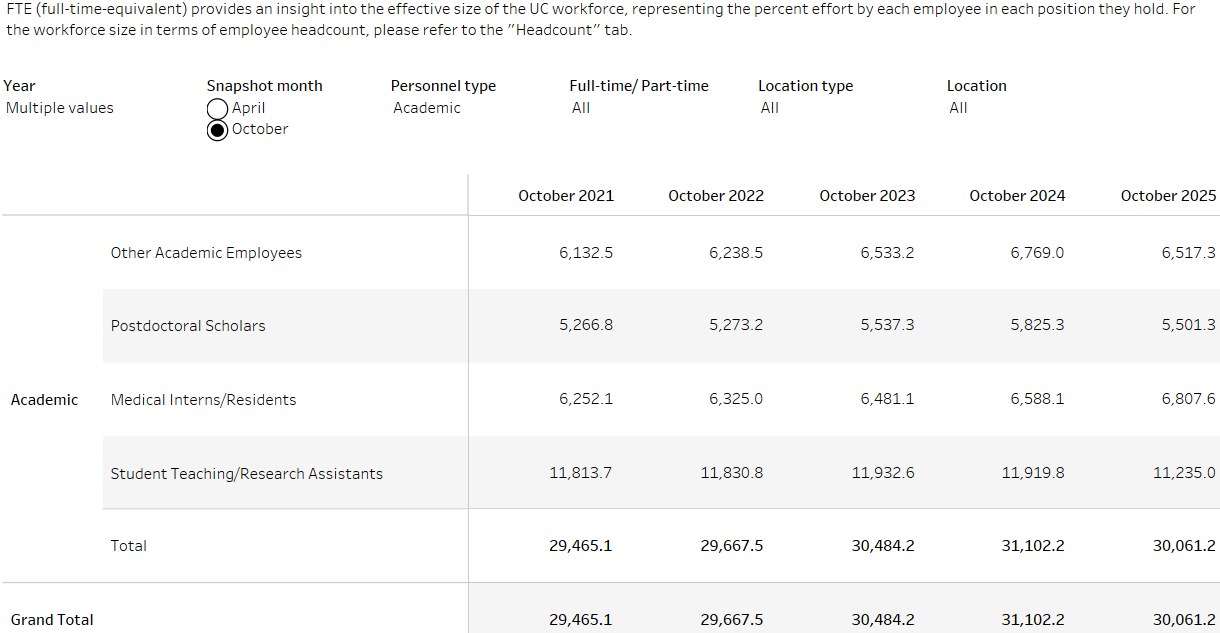
Despite student and faculty growth in the last five years, the non-faculty academic workforce has remained steady, with a modest increase of two percent.
8.2.2 Non-faculty academic workforce FTE
UC employees, full-time equivalent (FTE) dashboard
source: UC Information Center
The non-faculty academic workforce remains relatively stable, with gains in one area offsetting declines in another. Postdoctoral scholars conduct research under the general oversight of a faculty mentor. Student teaching and research assistants hold part-time appointments in conjunction with their graduate studies. Changes in the FTE of postdoctoral scholars and academic researchers are connected to the availability of research funding. Contracts and grants from external sponsors support the vast majority of researchers in the academic workforce, with the federal government providing most research funding. Medical residents and postdoctoral scholars have seen modest growth over five years, with both categories trending upward through 2024 before a slight dip in 2025. Meanwhile, academic student employees (teaching assistants, tutors, graduate student researchers, etc.) have edged down, dropping from about 11,814 FTE in 2021 to 11,235 FTE by 2025.
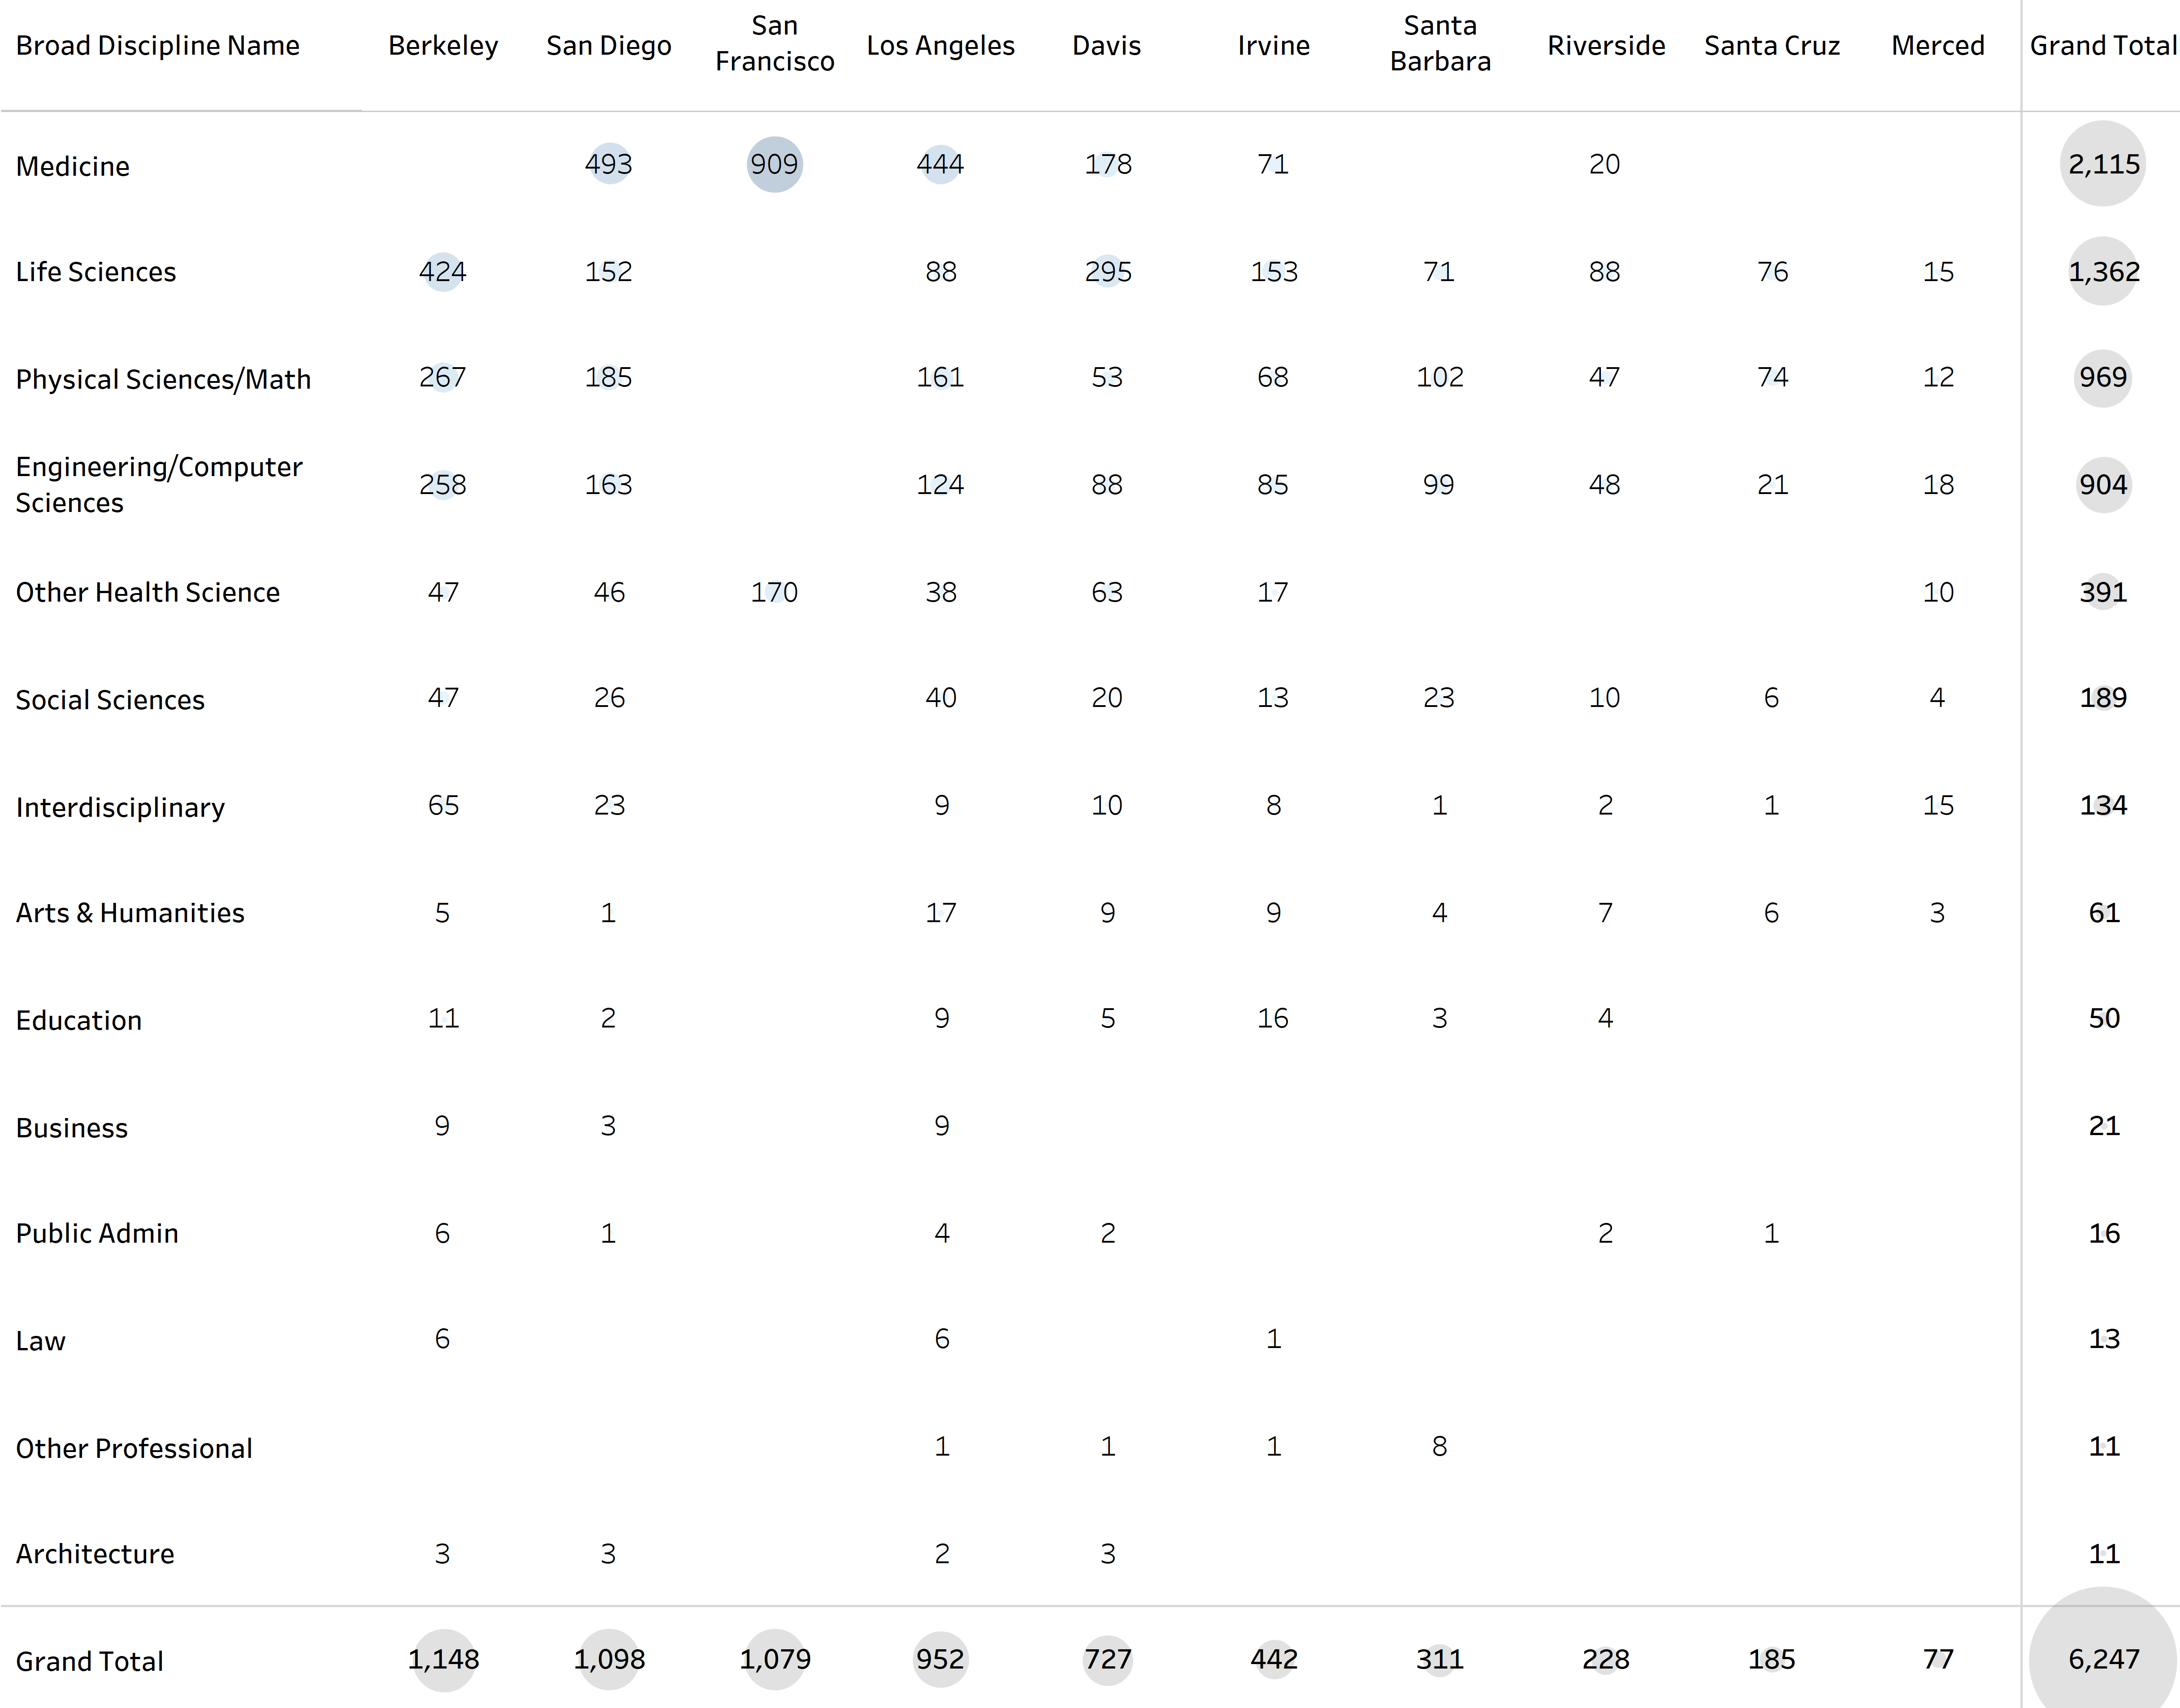
Postdoctoral scholars are concentrated in health sciences, biological and biomedical sciences, science, engineering, and physical sciences, as well as at campuses with larger research programs in those fields.
8.2.3 Postdoctoral scholar headcount, by campus and discipline, as of November 1, 2025
source: UCPath
Postdoctoral Scholars are early-career researchers working under faculty mentorship, primarily funded through grants and contracts. Fields with the most research funding — Medicine, Life Sciences, Physical Sciences, and Engineering — account for the vast majority of UC’s 6,247 Postdoctoral Scholars. Campuses with large research programs, such as San Francisco, Berkeley, San Diego, and Los Angeles, carry the biggest postdoc populations, with UCSF’s health science-focused mission contributing over 900.
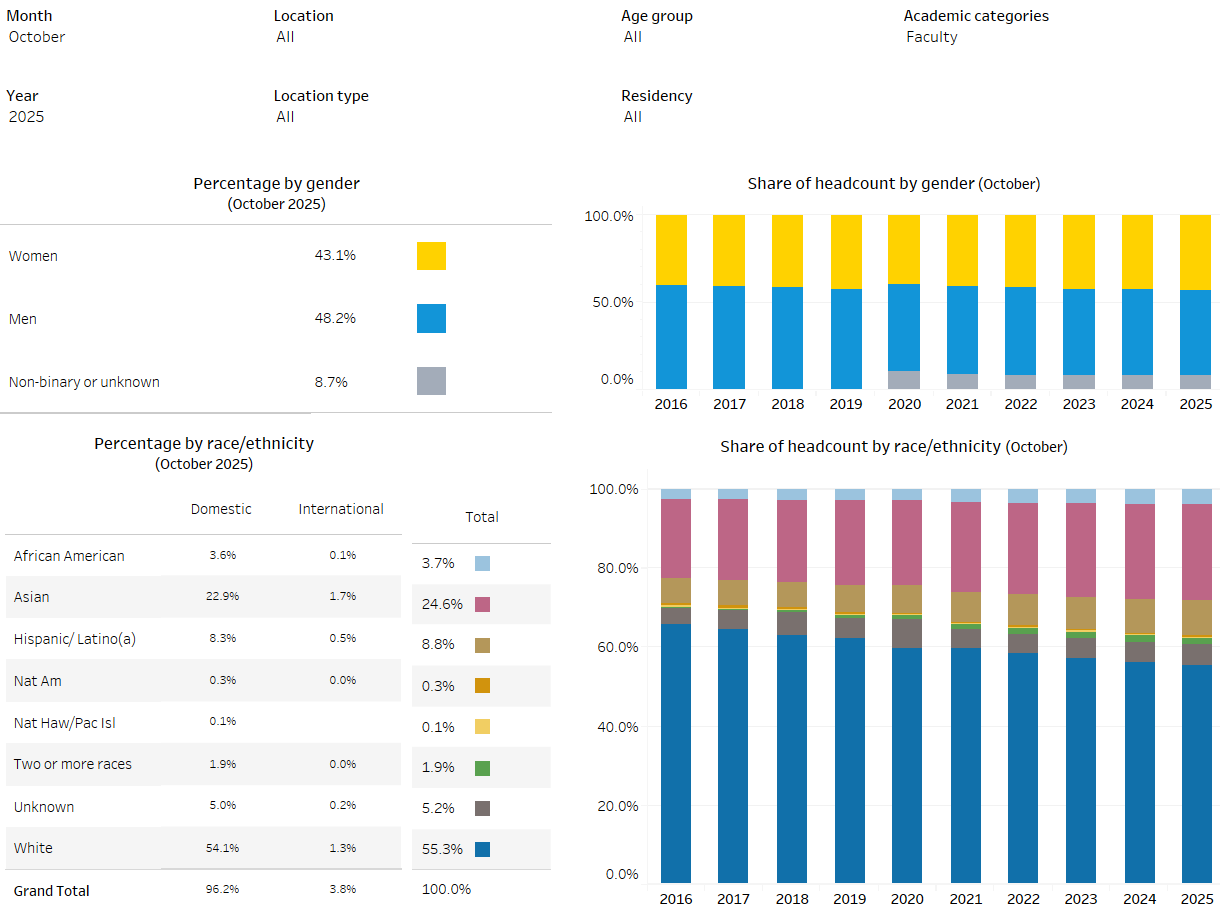
The diversity of UC’s academic workforce varies by employee type. Women and individuals from underrepresented racial and ethnic groups constitute a larger proportion of student teaching and research assistants, medical residents, and postdoctoral scholars than of faculty members.
8.3.1 Academic workforce race/ethnicity and gender by type
UC workforce diversity dashboard | Academics
source: UC Information Center
As of October 2025, white faculty account for 55 percent of the faculty workforce; men hold 48 percent of positions versus 43 percent for women. Faculty composition shapes the experience of UC’s increasingly diverse student body in the classroom, in research mentorship, and in who students see as role models. The most diverse parts of UC’s academic workforce are postdocs, residents, and student employees, i.e., positions that feed the future faculty pipeline. Progress at the ladder-rank level is relatively slower. Positions occupied by students and recent graduates (e.g., teaching assistants, research assistants, postdocs, residents/interns) tend to be more diverse, reflecting increasing diversity in graduate student populations. Ladder-rank faculty diversity has been the slowest to change, due to long tenures. UC is exploring ways to improve data quality and reverse the recent trend of growth in the share of the population with unknown race/ethnicity.
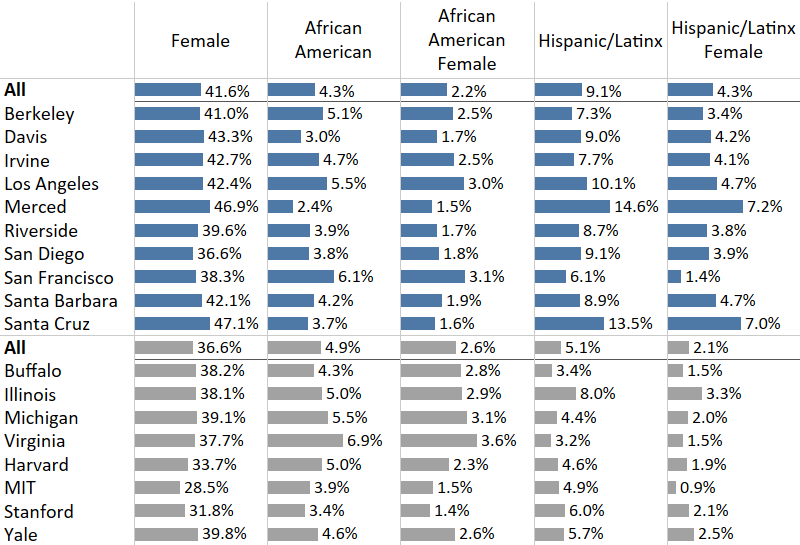
UC has greater diversity in terms of women and Hispanic/Latino(a) faculty than most of its peers.
8.3.2 Percent of tenure and tenure-track faculty who are women and/or African American or Hispanic/Latino(a), UC and comparison institutions, Fall 2024
source: IPEDS
UC leads its peers on faculty diversity, especially Hispanic/Latino(a) representation. Across nearly every category, UC campuses outperform comparable private universities and are at par against public peers. The “Comparison 8” group of universities consists of four public institutions (Illinois, Michigan, University at Buffalo, Virginia) and four private institutions (Harvard, MIT, Stanford, Yale). UC’s commitment to reflect California’s diversity starts with who’s at the front of the classroom. These numbers show how UC compares to other institutions. UC averages 41.6 percent female faculty as compared to 36.6 percent at comparison institutions. UC’s Hispanic/Latino(a) faculty at 9.1 percent tops the comparison group’s 5.1 percent. For African American faculty, UC (4.3 percent) is below public peers (4.9 percent).
note: IPEDS data does not capture race and ethnicity for employees who are not U.S. citizens or permanent residents. Therefore, the UC data shown here may differ from other analyses of faculty demographics.Hispanic/Latinx is used in the chart and is interchangeable with Hispanic/Latino(a).
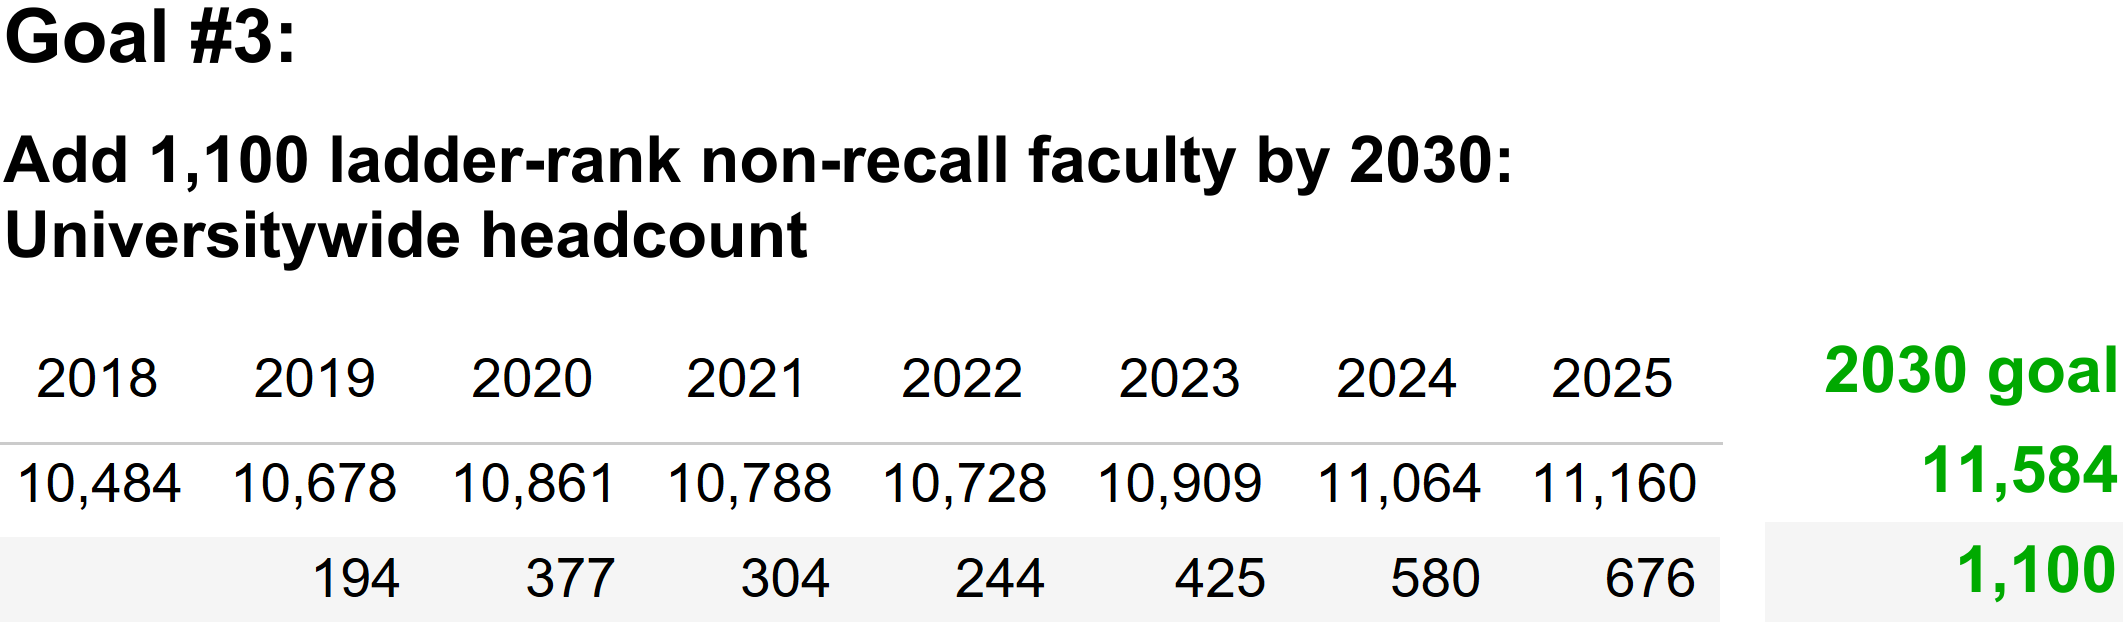
UC is 39 percent away from the UC 2030 goal of hiring 1,100 ladder-rank and equivalent faculty.
8.4.1 UC ladder-rank faculty headcount, excluding recall faculty*, Universitywide, October 2018 to 2025
UC 2030 dashboard
source: UC Corporate Personnel System and UCPath
Growth among UC ladder-rank and equivalent (LRE) faculty has been modest over the last couple of decades, relative to the growth in the student body. One of UC’s goals in the multi-year framework adopted by the UC Regents in 2019 is to invest in the next generation of the professoriate. To fulfill this, UC set a goal to grow non-recall LRE faculty by 1,100 between 2018 and 2030. UC added 676 net new faculty by October 2025 and is on track to meet this goal.
* Recall faculty are retired faculty who return part-time for temporary instruction and/or research needs. They are excluded here to focus on more permanent faculty appointments only.
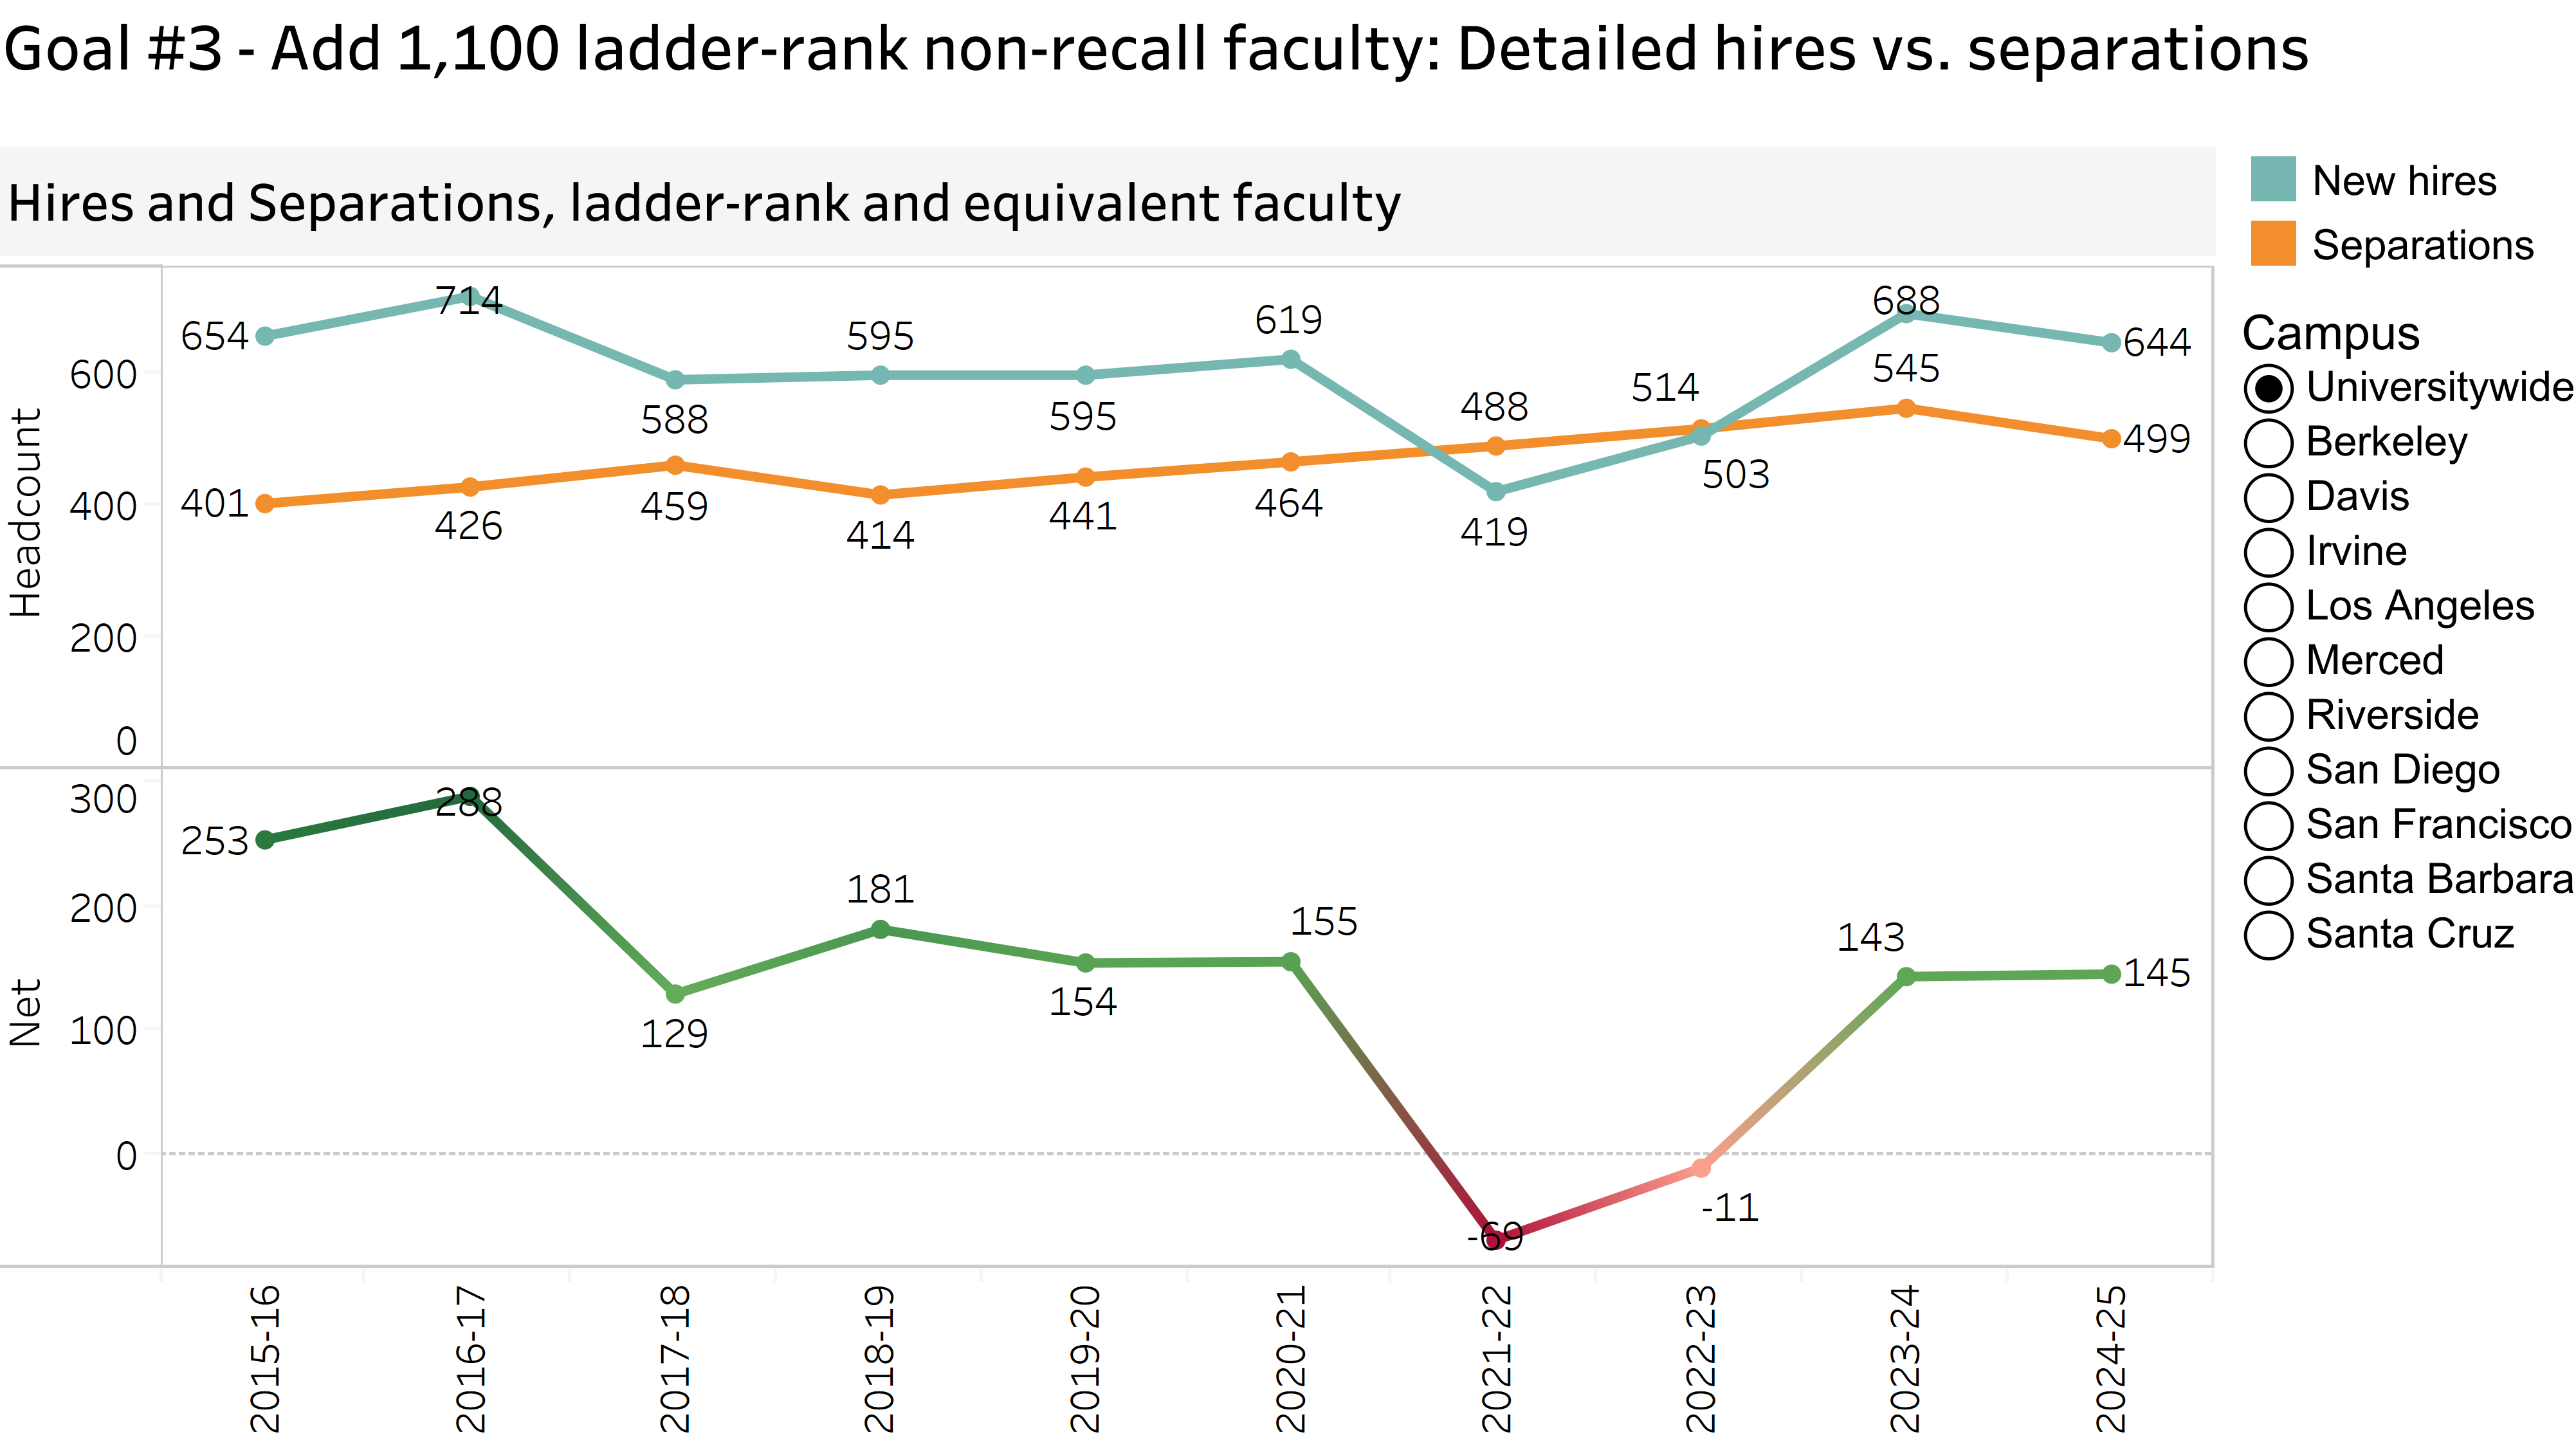
Hiring of new faculty has recovered from the slowdown during the COVID-19 pandemic. Separations are also on a modest increase in recent years.
8.4.2 New hires and separations of ladder-rank and equivalent faculty, Universitywide, 2015–16 to 2024–25
UC 2030 dashboard | Goal #3 - hires vs. separations
source: UC Systemwide Academic Personnel
New ladder-rank faculty hires rebounded to 644 in 2024–25, close to pre-pandemic levels. Net growth of +145 faculty is a solid recovery from the near-zero gains of 2021–23. UC 2030 Goal #3 calls for adding 1,100 net new ladder-rank faculty. Every year of flat or negative net growth makes that target harder to reach. Separations have risen steadily from 419 in 2021–22 to 499 in 2024–25. More faculty leaving means UC might take longer to reach the UC 2030 Goal #3.
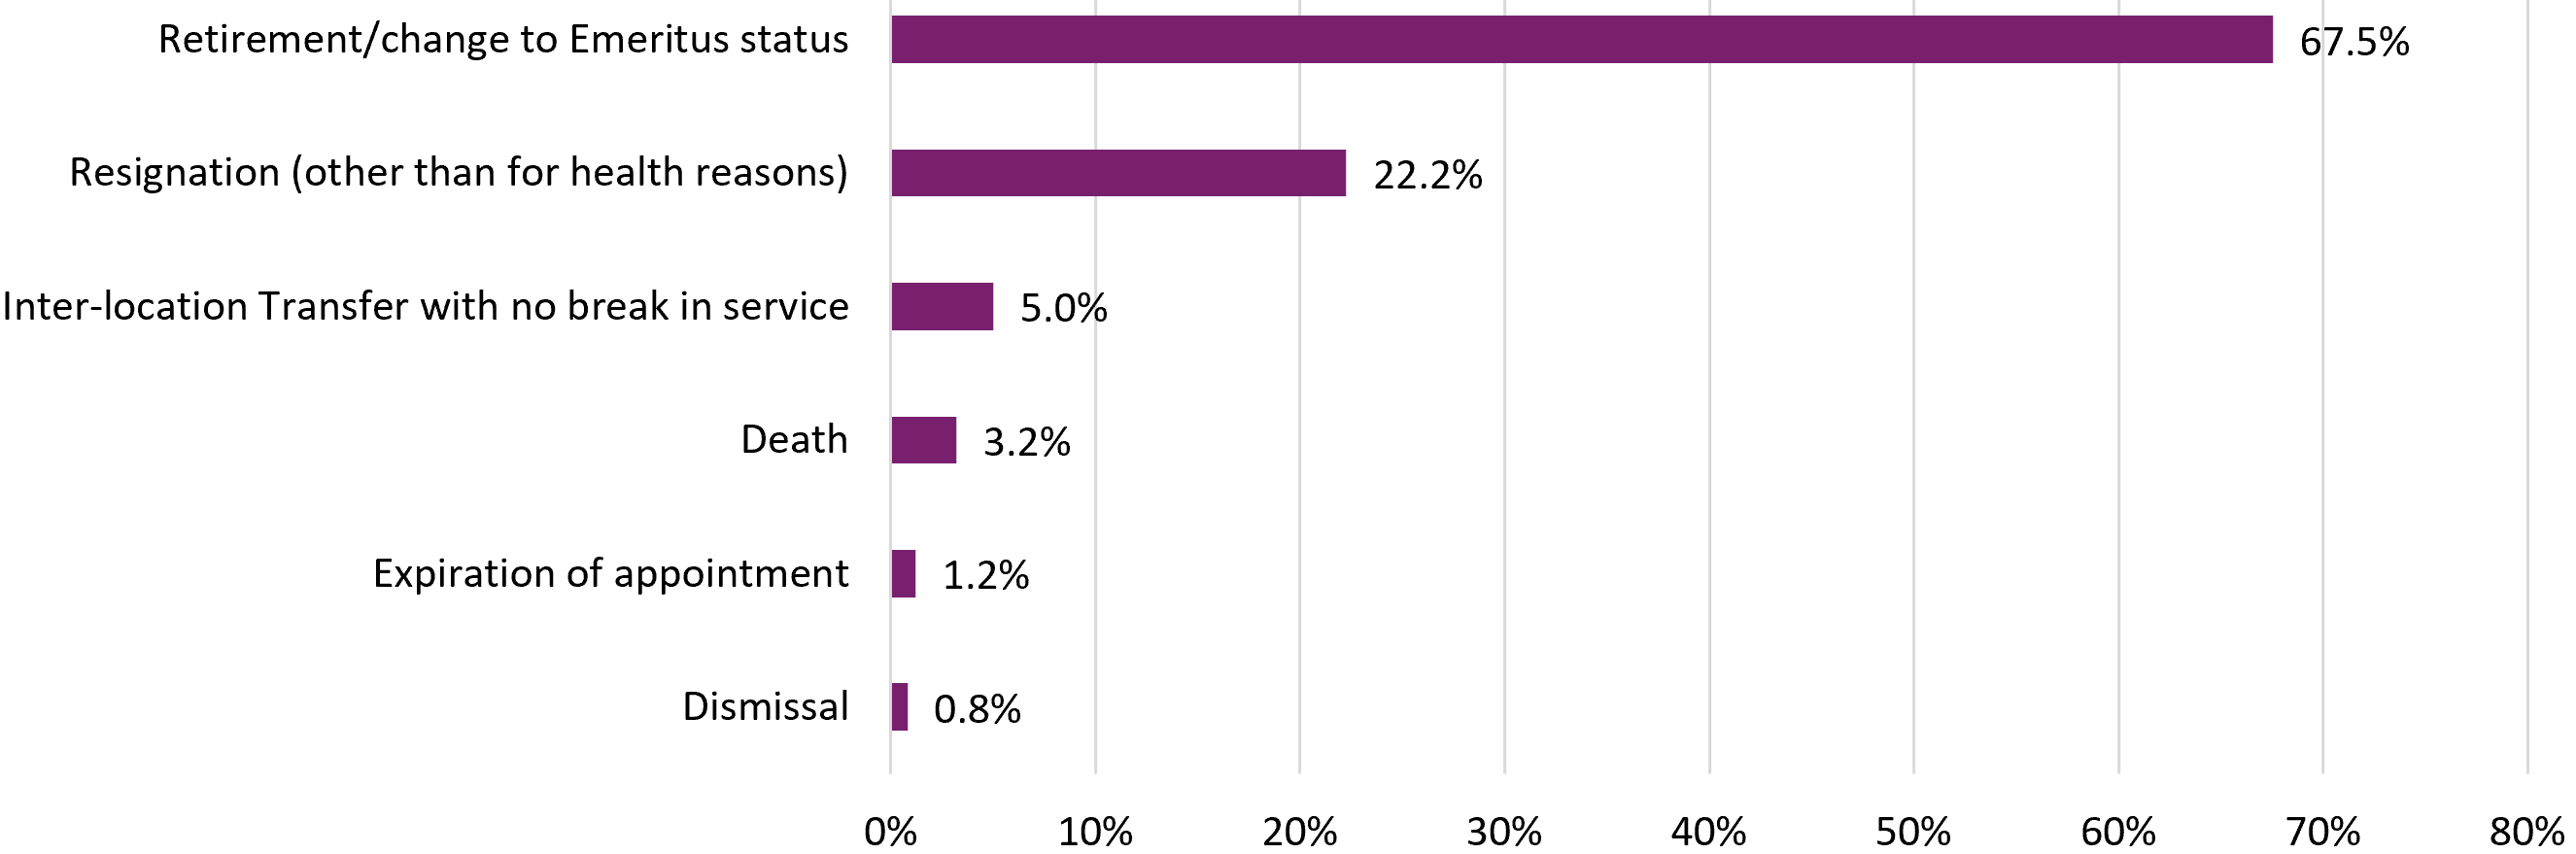
Retirement remains the most common separation reason among UC faculty, followed by resignation and inter-location transfer.
8.4.3 Faculty separation reasons, academic year 2024–2025
source: UC Systemwide Academic Personnel, UCPath
Investing in the next generation of faculty and research is one of the three goals of the UC 2030 framework. UC continues to grow the graduate and professoriate pathway by hiring additional ladder-rank faculty. Two out of three faculty departures (67.5 percent) are retirements or transitions to emeritus status. Voluntary resignations account for another 22 percent. Retirement-driven separations are foreseeable. But resignations might be an effect of competitive pressures in the faculty job market.
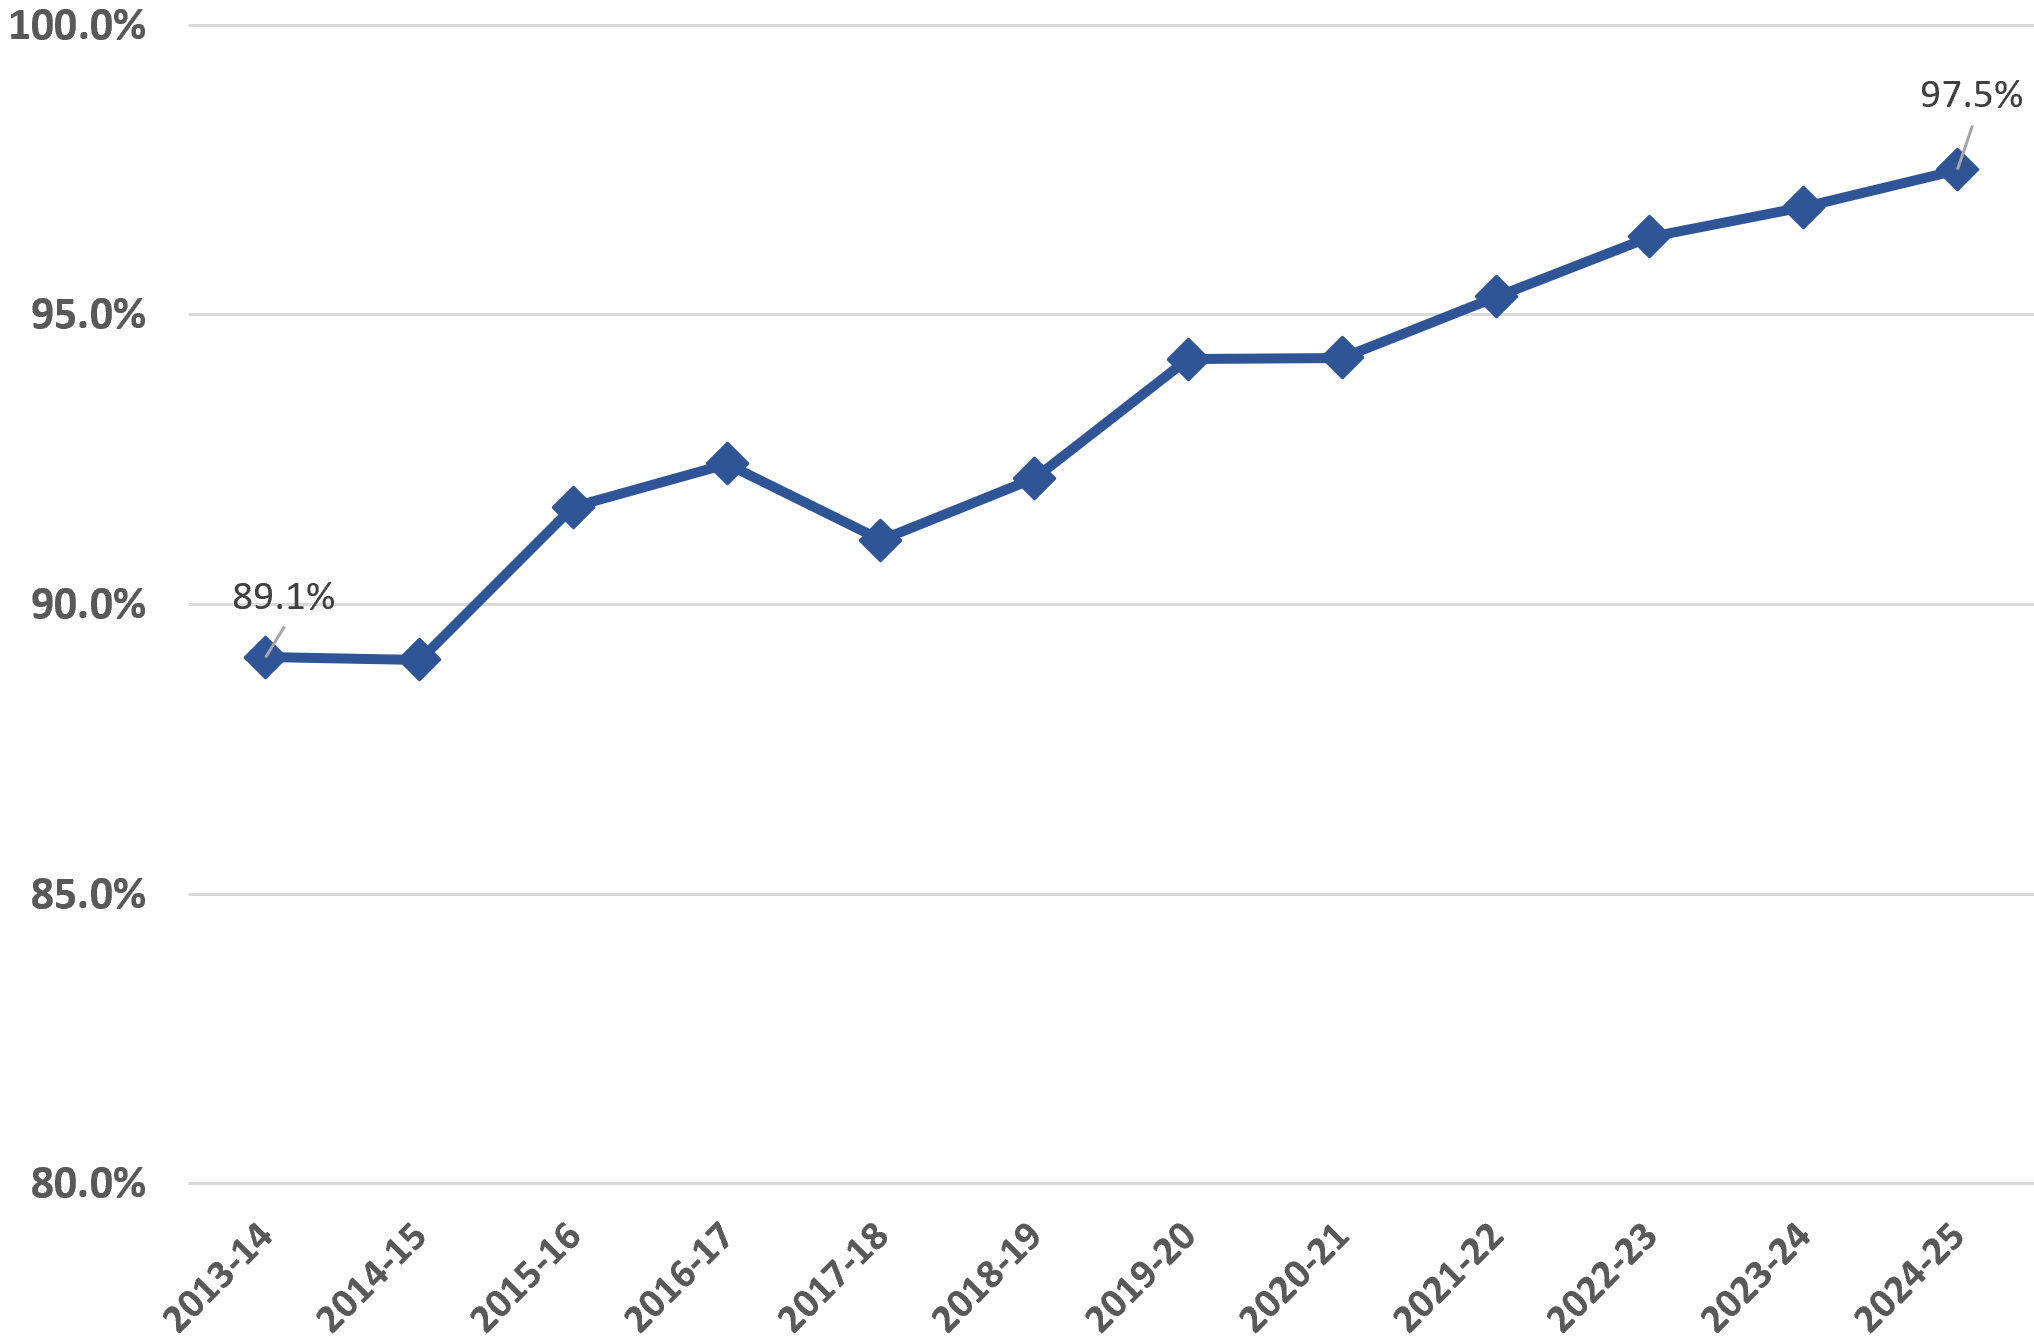
UC faculty salaries have increased, getting closer to market. In 2024–25, faculty salaries were 2.5 percent below the market benchmark.
8.4.4 Ladder-rank faculty salaries as a percentage of market, 2013–14 to 2024–25

University of California Budget for Current Operations 2026–27 report | page 159
source: UC Budget for Current Operations, 2026–27
Past cuts to the University’s budget have resulted in disparities in faculty and staff salaries compared to the market benchmark. The market rates are sourced from World at Work Annual Salary Budget Survey, which represents data from over 1,000 employers from all sectors in the western United States. Due to funding constraints, the University has struggled to bring faculty salaries to par with comparators. As of 2024–25, UC's faculty salaries were 2.5 percent below market.
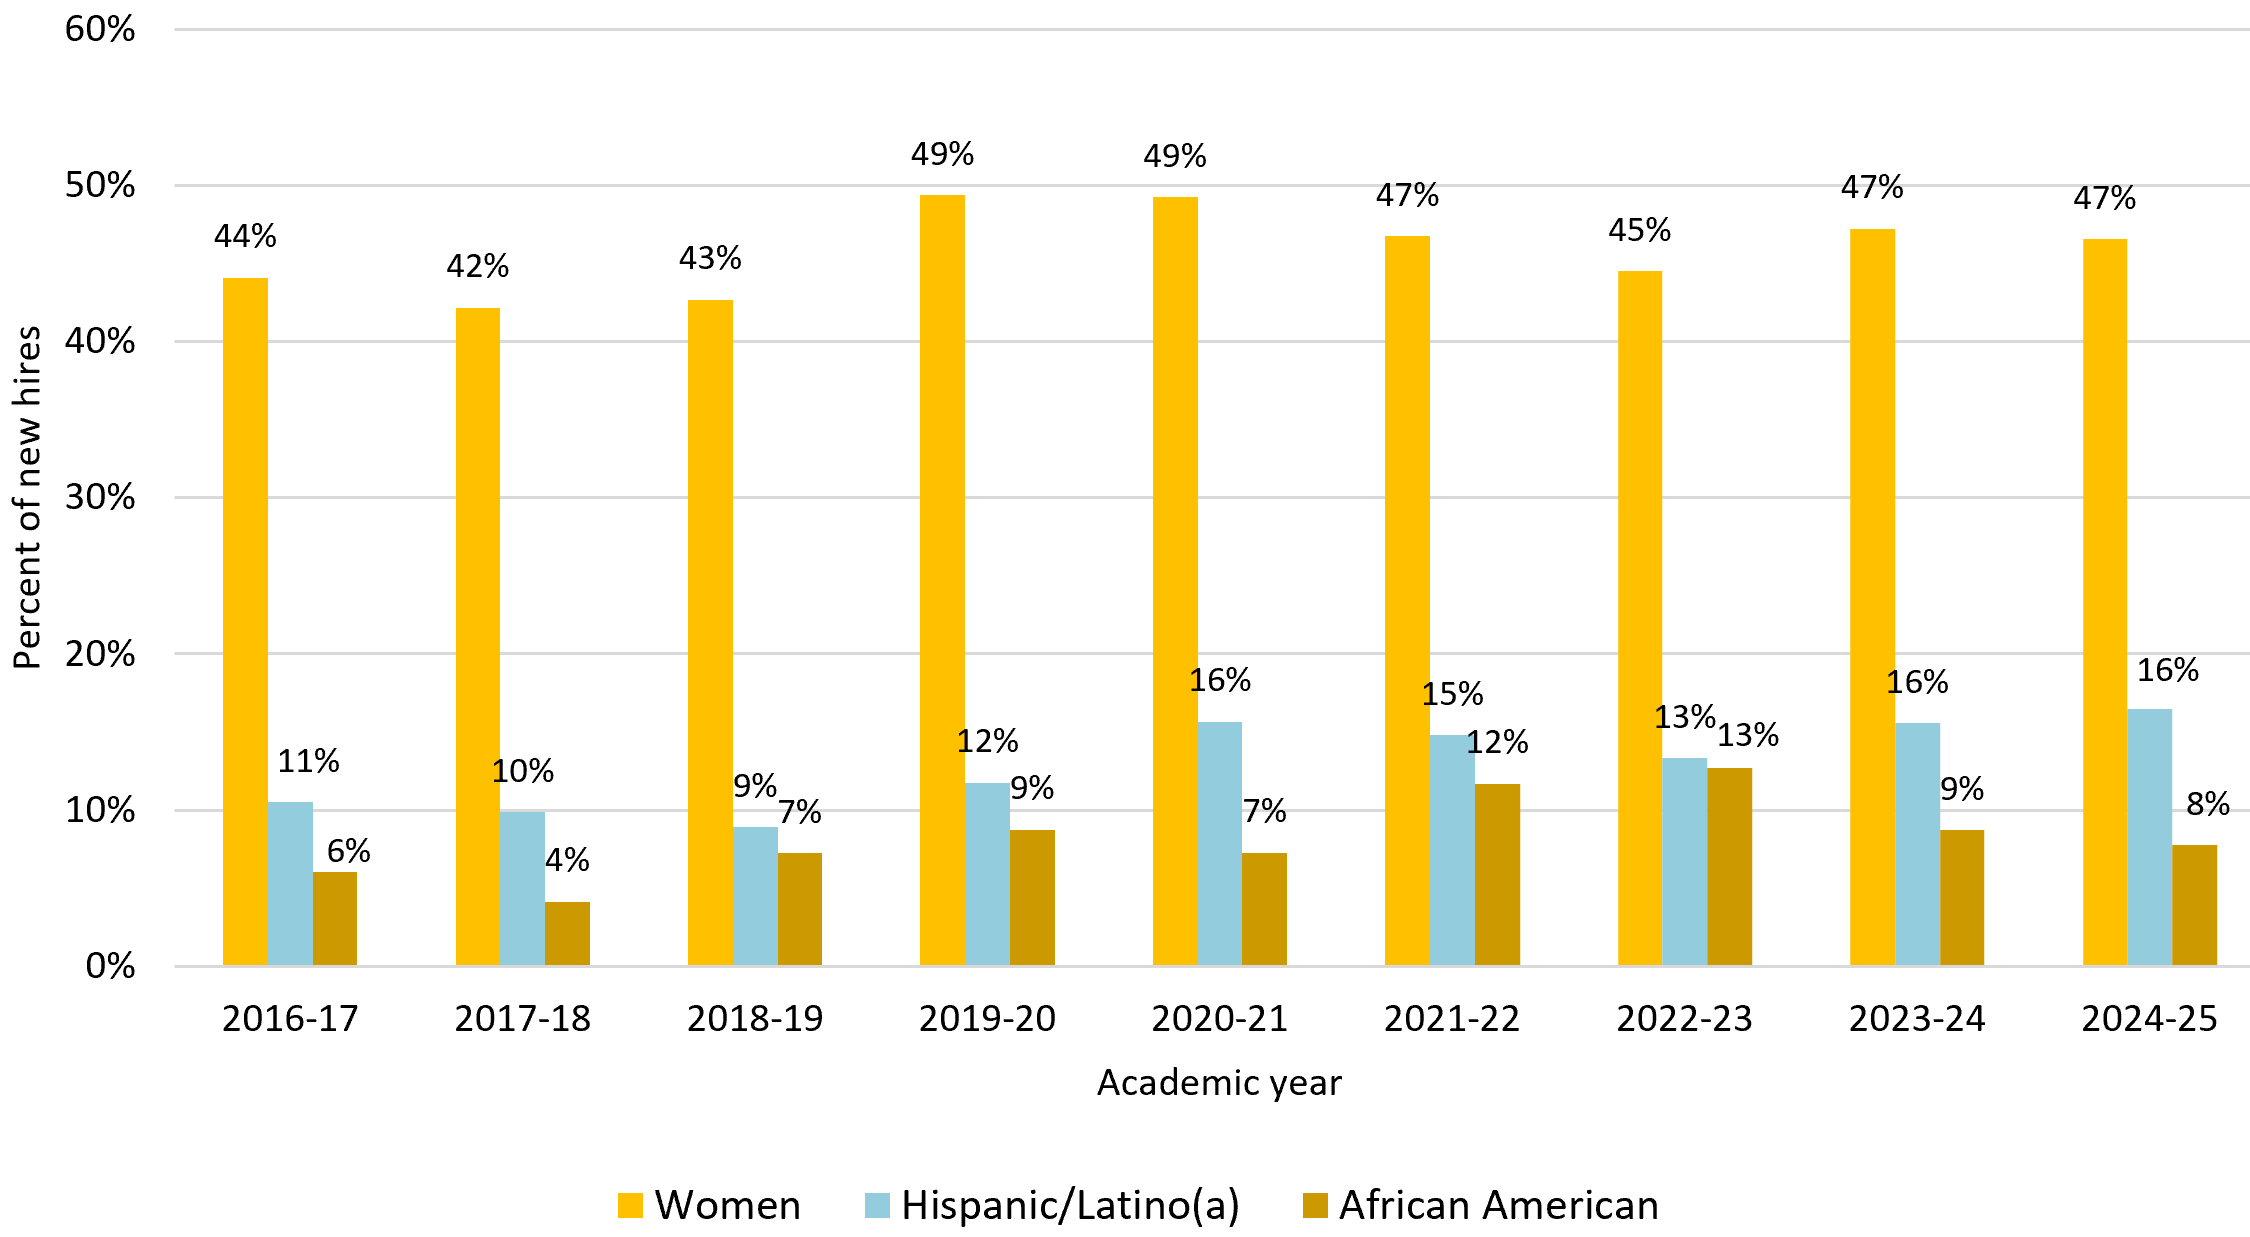
UC’s new faculty hires are more diverse.
8.4.5 UC pathways to professoriate
source: UC Systemwide Academic Personnel
The percent of women and Hispanic/Latino(a) faculty has remained flat or slightly increased among new hires over the past decade. The percent of African Americans hired has declined in recent years. The percent of women hired fluctuated between 44–49 percent of new hires, landing at 47 percent in 2024–25. The percent of Hispanic/Latin(a) hires increased from 11 percent in 2016–17 to 16 percent in 2024–25. The percent of African American hires peaked at 13 percent in 2022–23, then dropped back to eight percent in 2024-25
Through its Grow our Own initiative, UC is increasing opportunities for UC undergraduate and PhD students to become future faculty by creating more research opportunities for undergraduate students and working to encourage these students to pursue doctoral degrees.
For more information
Explore the UC Information Center dashboards that provide downloadable data and context on UC’s faculty and other academic employees with this subject area-specific url:
universityofcalifornia.edu/about-us/information-center#employees
In addition to those dashboards supporting indicators in this chapter, other examples include:
Other resources
Download data tables for chapter 8 indicators (Excel format)
Chapter Eight: Faculty and Other Academic Employees
Key takeaways:
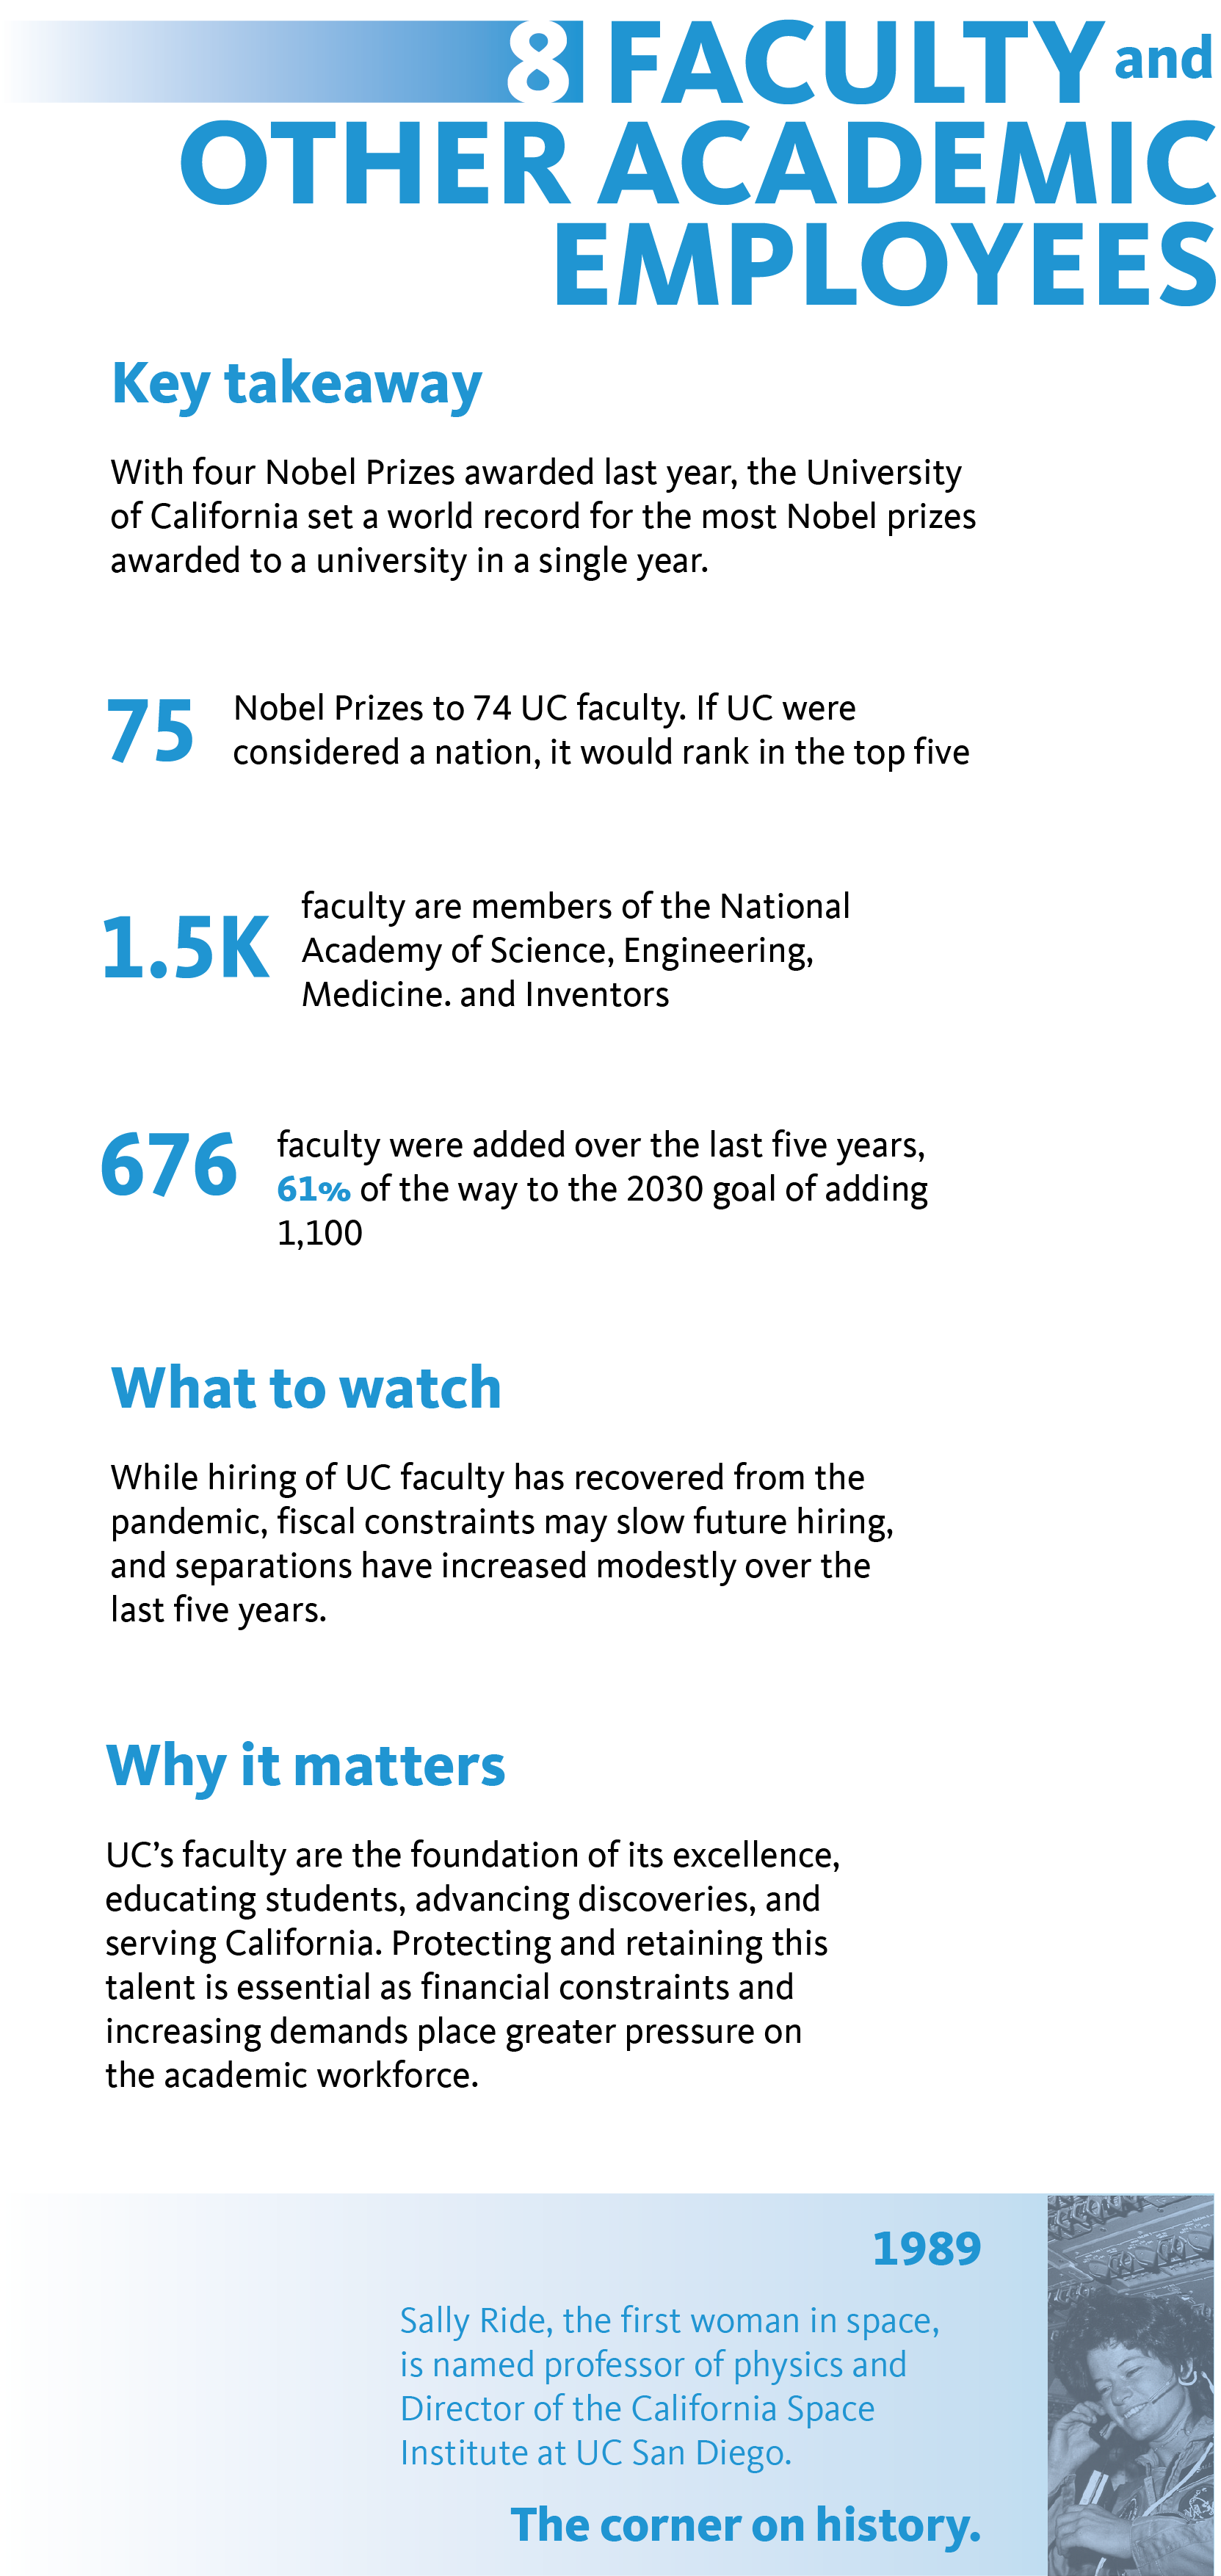
- With four Nobel Prizes awarded last year, the University of California set a world record for the most Nobel prizes awarded to a university in a single year.
- Seventy-five Nobel Prizes have been awarded to seventy-four UC faculty. If UC were considered a nation, it would rank in the top five.
- One thousand five hundred UC faculty are members of the National Academy of Science, Engineering, Medicine, and Inventors.
- UC added 676 faculty over the last five years, sixty-one percent of the way to the 2030 goal of adding 1,100.
What to watch:
While hiring of UC faculty has recovered from the pandemic, fiscal constraints may slow future hiring, and separations have increased modestly over the last five years.
Why it matters:
UC’s faculty are the foundation of its excellence, educating students, advancing discoveries, and serving California. Protecting and retaining this talent is essential as financial constraints and increasing demands place greater pressure on the academic workforce.
UC’s corner on history:
In 1989, Sally Ride, the first woman in space, was named professor of physics and Director of the California Space Institute at UC San Diego.