Accountability Report 2017

Chapter 7:

Goals

The University of California is dedicated to fostering a community that provides leadership for constructive participation in a diverse, multicultural world. The University has a long history of supporting initiatives that foster an inclusive living, learning and working environment.

The University’s diversity goals are established in Regents Policy 4440: University of California Diversity Statement, which states, in part:

Because the core mission of the University of California is to serve the interests of the State of California, it must seek to achieve diversity among its student bodies and among its employees.

The State of California has a compelling interest in making sure that people from all backgrounds perceive that access to the University is possible for talented students, staff, and faculty from all groups.

Therefore, the University of California renews its commitment to the full realization of its historic promise to recognize and nurture merit, talent, and achievement by supporting diversity and equal opportunity in its education, services, and administration, as well as research and creative activity.

The University particularly acknowledges the acute need to remove barriers to the recruitment, retention, and advancement of talented students, faculty, and staff from historically excluded populations who are currently underrepresented. 

Summary of findings

UC is making progress in several key areas related to diversity and inclusion. These include:

  • A growing number of Hispanic/Latino(a) undergraduates
  • Increasing undergraduate graduation rates across all racial/ethnic groups
  • Increasing proportions of female ladder-rank faculty across all discipline groups and a slight increase in the percentage of Hispanic/Latino(a) faculty
  • Slow but steady progress in the percentage of underrepresented graduate academic students
  • An increasingly diverse career staff workforce

At the same time, however, challenges include:

  • Low enrollment of African American and American Indian undergraduate students
  • Low proportion of female and underrepresented faculty compared to availability pools in most disciplines (presented in Chapter 5 of this report)
  • Issues of not feeling respected reported by undergraduates of historically underrepresented groups
  • The graduation gap between underrepresented and White and Asian undergraduates (presented in Chapter 3 of this report)

Evaluating diversity

UC’s diversity is evaluated a variety of ways: current demographic characteristics and trends of its students, faculty and staff; policies and activities that promote equity and inclusion; and survey data that reveal perceptions of campus climate and respect.

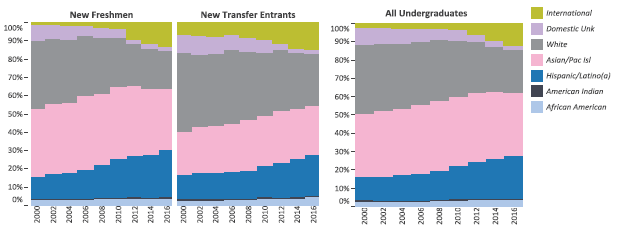
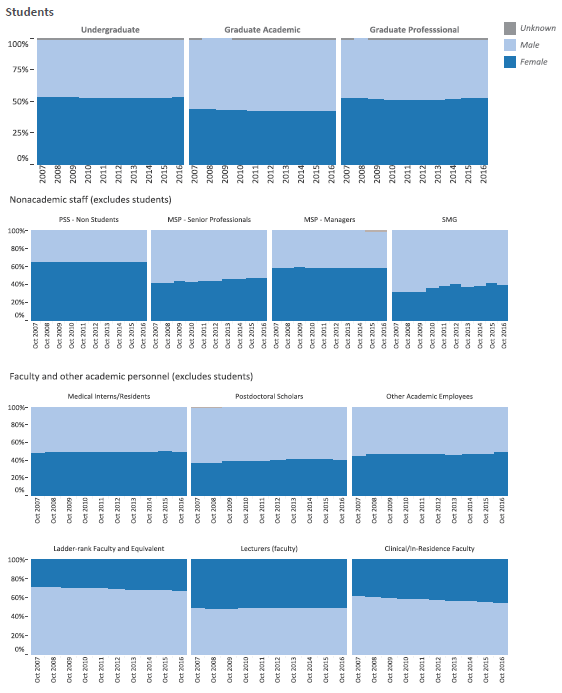
The indicators in this chapter present an overview of trends for undergraduate, graduate academic and graduate professional students. This feeds into an overview of the University by race/ethnicity and gender.

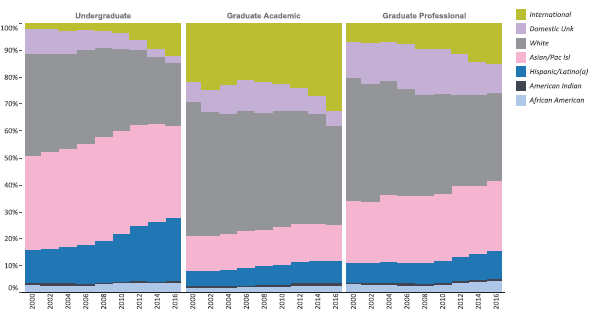
Trend data illustrate growing proportions of underrepresented and international students in the undergraduate population. Over the last 15 years, the proportion of Hispanic/Latino(a) undergraduates has grown tremendously, reflecting the growing number of Hispanic/Latino(a) students in California and improved high school graduation rates. Five UC campuses (Irvine, Merced, Riverside, Santa Cruz and Santa Barbara) are designated by the federal government as Hispanic-Serving Institutions (HSIs). UC Davis, UCLA and UC San Diego are also emerging HSIs.

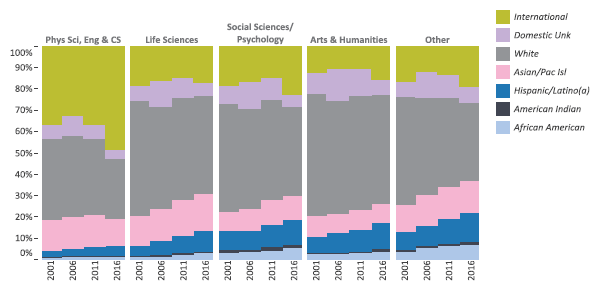
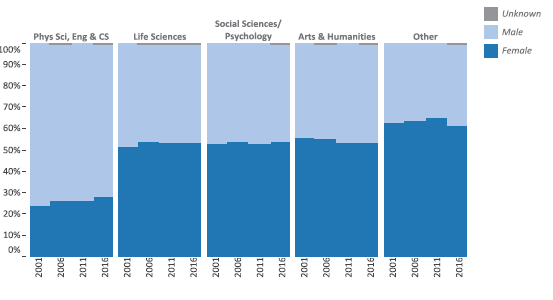
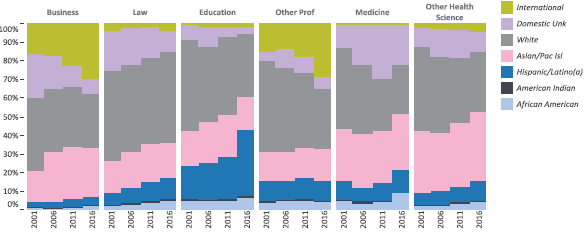
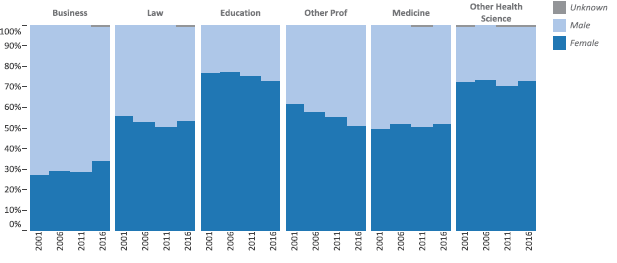
Among graduate academic students, underrepresented populations show steady increases across disciplines, with growth in international students generally in physical science and engineering. Female students are the majority in all disciplines except for physical science and engineering. Graduate professional degree programs show similar patterns for underrepresented and international students, with variation by discipline. Education programs have a larger proportion of underrepresented students, and business and other professional degree programs have growing international populations. The proportion of female students in graduate professional degree programs is trending slightly downward but remains around 50 percent or higher for all disciplines except business.

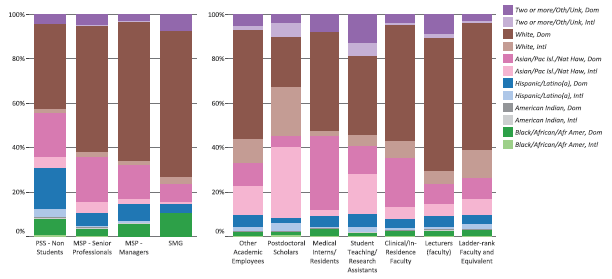
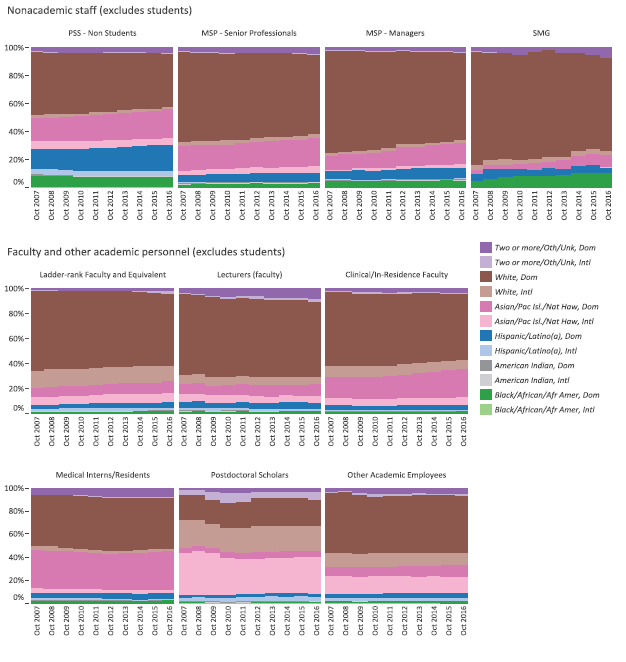
For staff, the proportions of nonwhite and female Managers and Senior Professional (MSP) and Senior Management Group (SMG) positions are smaller than their proportions in Professional and Support Staff (PSS) positions. The proportion of females among ladder-rank faculty is lower than proportions among other academic employees.

Surveying students about diversity on campus

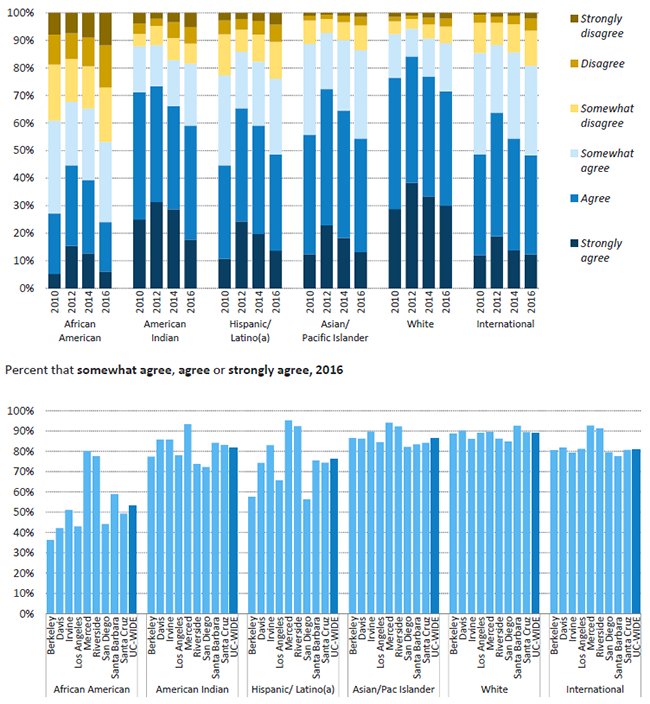
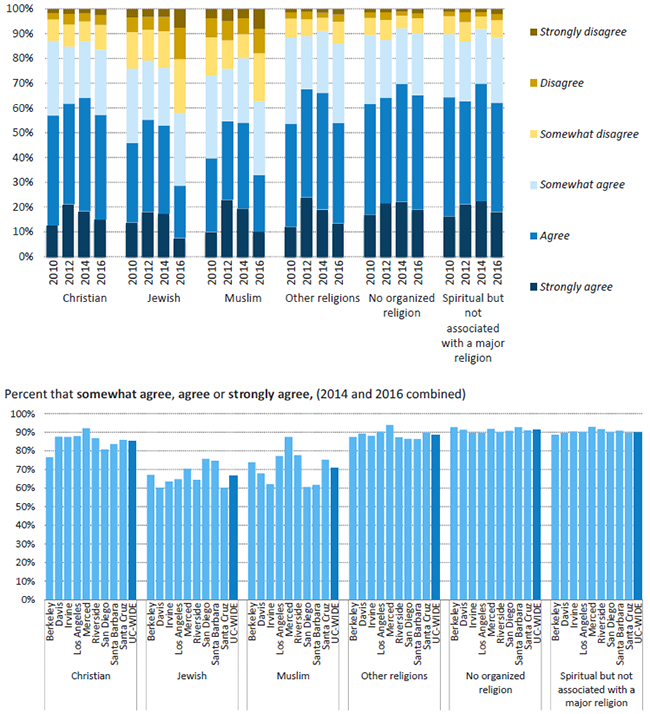
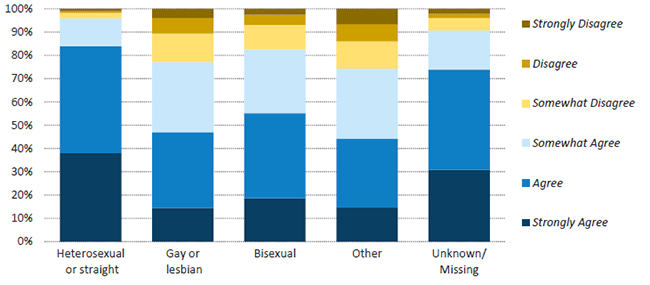
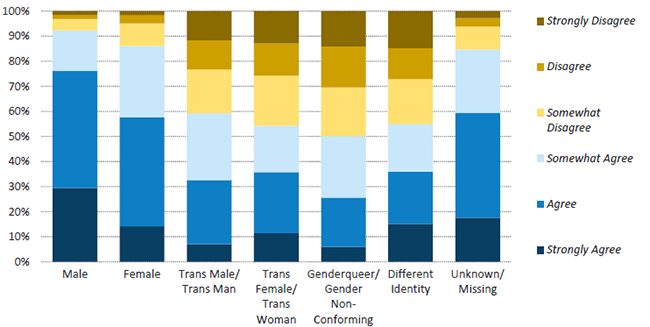
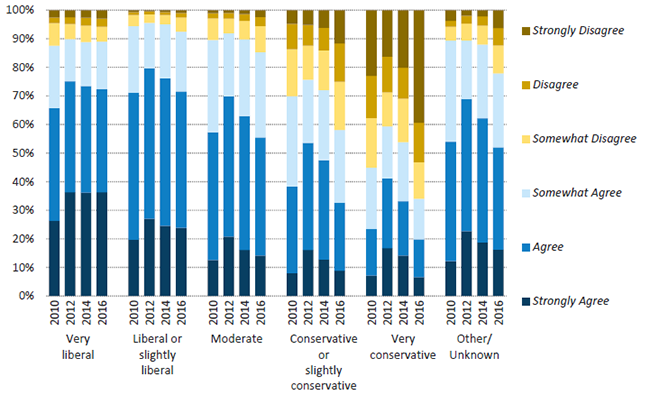
This chapter presents responses to the UC Undergraduate Experience Survey (UCUES), given every two years to all undergraduates. The University’s goal is to ensure that all students are respected on campus, regardless of race/ethnicity, religious affiliation, gender, sexual orientation or political beliefs.

UCUES data show most undergraduates feel students of their race/ethnicity are respected on campus, but the proportion of African American respondents sharing this perspective is lower than other groups. Among religious identifications, Muslim and Jewish students are less likely to feel respected. LGBQ students also are less likely to feel respected. Students identifying as having conservative political beliefs are less likely to feel respected.

Diversity indicators elsewhere in this report

Graduation rates for entering freshmen and undergraduate transfers by race/ethnicity are presented in Chapter 3 — Undergraduate Student Success.

Indicators for new faculty hiring compared to national availability pools for underrepresented groups and women are presented in Chapter 5 — Faculty and Other Academic Employees.

Looking forward—diversity initiatives

Through its college preparation outreach programs, UC devotes considerable resources to offering college preparation support to more than 100,000 K–12 and community college students annually. This effort results in a greater number of students who are prepared and qualified for UC. Of the high schools served by UC, roughly 70 percent have consistently been among the lowest-performing schools in the state. Participants in these programs have higher rates of enrollment in California public college segments, and those who are accepted to UC enroll at higher rates than their peers.

UC’s college preparation programs remove participants’ obstacles to attending UC, encouraging them to apply and enroll at UC at higher rates than those overall for California high school graduates. The most recent data for fall 2015 show the enrollee yield — the ratio of students admitted to UC who enroll — for participants in UC academic preparation programs is higher, at 61.7 percent, than for all California high school graduates at 53.2 percent.

African American participants in a UC college preparation program were also more likely to enroll at a UC campus than were their peers who did not participate (58 percent compared to 50 percent).

In addition to funding UC’s college preparation programs, the 2016–17 state budget for UC included $20 million in one-time funding for support services for “low-income students and students from underrepresented minority groups,” including students who were enrolled in high schools designated by the California Department of Education as eligible for supplemental funding under the Local Control Funding Formula (LCFF) because of their populations of low-income or educationally disadvantaged students. UC campuses are using this funding for two primary purposes: to increase the application, admission and enrollment of students from these schools; and to provide academic support services to enrolled students, focusing on those who are low-income, first-generation-college or otherwise educationally disadvantaged. Outcomes from this initiative will be reported in fall 2017.

In October 2015, the Office of the President launched the President’s Diversity Pipeline Initiative (DPI) to expand the academic pipeline to the University of California for undergraduate students, graduate students and faculty who remain persistently underrepresented at UC. The Diversity Pipeline Initiative builds on existing University resources — admissions policies and practices, academic preparation (outreach) programs and community partnerships, among others. Outcomes from the first year of the DPI include:

  • Admissions of African American students in fall 2016 were up by 30.6 percent from fall 2015.
  • 44 percent of fall 2017 California freshman applicants were from underrepresented minority (URM) backgrounds.
  • 36.4 percent of new California freshmen in fall 2016 were from URM backgrounds.
  • UC college-prep programs saw a 12.7 percent increase in African American student enrollment from 2012–13 to 2015–16.

The UC-HBCU Initiative improves diversity and strengthens graduate programs by investing in relationships between UC campuses and Historically Black Colleges and Universities (HBCUs). Since its inaugural year (2012), more than 315 HBCU scholars have participated in the program, which offers faculty-led summer research opportunities and year-round mentoring. Twenty-seven Ph.D. students and two M.A. students are currently enrolled at UC, and three M.A. students have already graduated from UC as a direct result of the program.

The President’s Postdoctoral Fellowship Program (PPFP) is a keystone program at the University of California that supports diversification of UC faculty through financial support and career development training for postdoctoral scholars that show promise to be successful faculty in the UC system. Fellows have a demonstrated record of commitment to diversity in their research, teaching and/or outreach. The fellowship is extremely competitive, selecting the top 3 percent of applicants. Since the 2013–14 academic year there have been over 500 applicants to the program annually, this year reaching over 850. The program selects approximately 20 fellows annually. The President’s Postdoctoral Fellowship Program and the Chancellors’ Fellowship Programs have accounted for 11.5 percent of new underrepresented minority faculty hired at UC in the last ten years. At present, 165 PPFP fellows have been hired into UC tenure-track positions since 2004.

For more information

Here are links to key products in the UC Information Center in each area:


Each year, UC enrolls a growing number of undergraduates from underrepresented groups (African American, American Indian or Hispanic/Latino(a)); entering freshmen are somewhat more likely to be from an underrepresented group than entering transfer students.

7.1.1      Racial/ethnic distribution of new undergraduates, Universitywide, Fall 2000 to fall 2016

7-1-1

Source: UC Information Center Data Warehouse

A number of factors may explain why entering freshmen are somewhat more diverse than entering transfer students. Among the population of high school graduates sufficiently prepared to qualify for UC, white students are more likely to be from high-income families and to choose private and out-of-state colleges, while Asian American and Hispanic/Latino(a) students are more likely to choose UC. Part of the Transfer Action Team initiative’s charge (discussed at more length in Chapter 1) is to look for opportunities to expand outreach to California community colleges with greater diversity of transfer-eligible students who currently do not apply to UC.


UC is making slow but steady progress in diversifying the racial/ethnic makeup of its graduate academic students.

7.2.1      Racial/ethnic distribution of graduate academic students, by discipline, Universitywide, Fall 2001 to fall 2016 (selected years)

7-2-1

Source: UC Information Center Data Warehouse1

Enrollment of underrepresented racial/ethnic groups (African American, American Indian and Hispanic/ Latino(a)) in UC’s graduate academic programs has grown over the past decade. In 2014–15, UC awarded academic doctoral degrees to underrepresented racial/ethnic groups in higher proportion than did its peers, in every field.

Proportion of underrepresented racial/ethnic groups receiving academic doctoral degrees

2014–15
UC
Other AAU
Public
AAU
Private
Social Sciences
12%
10%
8%
Arts & Humanities
12%
8%
7%
Life Sciences
12%
6%
9%
Physical Sciences
7%
4%
4%
Engineering & CS
5%
4%
4%

Enrollment of underrepresented racial/ethnic groups (African American, American Indian and Hispanic/ Latino(a)) in UC’s graduate academic programs has grown over the past decade. In 2014–15, UC awarded academic doctoral degrees to underrepresented racial/ethnic groups in higher proportion than did its peers, in every field.

UC’s graduate programs draw students from across the nation and around the world, including its own undergraduate students, who make up about one-tenth of UC’s graduate students. As a consequence, UC’s efforts to diversify its undergraduate students also helps to diversify its graduate academic population.

Because recent Ph.D.’s constitute the pool for new faculty, a critical means for increasing the diversity of the faculty is to increase the diversity of the pool of doctoral degree recipients.

1 “Other” disciplines represent about 12 percent of degrees awarded and include interdisciplinary areas (3 percent), academic degrees in professional fields such as a Ph.D. in education (4 percent) or health sciences (3 percent) and miscellaneous areas such as criminology.


Students in physical sciences/engineering/computer science are less likely to be female than in other graduate academic disciplines, though their proportion has grown over time.

7.2.2      Gender distribution of graduate academic students, by discipline, Universitywide, Fall 2001 to fall 2016 (selected years)

7-2-2

Source: UC Information Center Data Warehouse1

The proportion of graduate academic students who are women varies by discipline. Half or more of the graduate academic students in the life sciences, social sciences and humanities are women, compared with almost one-in-three in the physical sciences, engineering and computer science.

Overall, the proportion of degree recipients who are women by broad discipline group is comparable to UC’s AAU peers.

Proportion of women receiving academic doctoral degrees, 2014–15

 
UC
Other AAU Public
AAU Private
Social sciences
53%
57%
50%
Arts & Humanities
53%
52%
52%
Life sciences
53%
52%
54%
Physical sciences
31%
33%
30%
Engineering & CS
21%
22%
25%

Source: IPEDS

1 “Other” disciplines include interdisciplinary areas, miscellaneous fields such as criminology and academic degrees in professional fields such as a Ph.D. in business or law.


The proportion of students from underrepresented racial/ethnic groups enrolled in UC’s professional degree programs varies widely — lowest in business and highest in education.

7.2.3     Racial/ethnic distribution of graduate professional degree students, by discipline, Universitywide, Fall 2001 to fall 2016 (selected years)

7-2-3

Source: UC Information Center Data Warehouse1

UC awards a greater share of its education, medicine and other health science professional degrees to students from underrepresented race/ethnic groups compared with its AAU peers, but a smaller share of its business degrees.

Proportion of underrepresented students receiving professional degrees, 2014–15

 
UC
Other AAU Public
AAU Private
Education
26%
13%
17%
Medicine
16%
10%
14%
Other health sci
16%
11%
11%
Law
10%
12%
11%
Business
7%
8%
8%

Source: IPEDS

1 “Other health sci” includes dentistry, nursing, optometry, pharmacy, public health and veterinary medicine; “Other prof” includes programs such as architecture, library and information science, public policy and social welfare, and other small programs. Medical residents are not included.


The proportion of women enrolled in UC’s professional degree programs varies widely and is trending somewhat downward in nearly all fields.

7.2.4      Gender distribution of graduate professional degree students, by discipline, Universitywide, Fall 2001 to fall 2016 (selected years)

7-2-4

Source: UC Information Center Data Warehouse1

The proportion of women enrolled in UC’s professional degree programs has trended slightly downward in all discipline areas except for business.

As shown in the table to the right, UC graduated roughly the same proportion of women in professional degree programs as the comparison AAU peers — somewhat higher in law and medi cine and somewhat lower in business.

Proportion of women receiving professional degrees, 2014–15

 
UC
Other AAU Public
AAU Private
Education
75%
73%
72%
Medicine
51%
47%
51%
Other health sci
71%
71%
73%
Law
50%
45%
48%
Business
34%
37%
36%

Source: IPEDS

1 “Other health science” includes dentistry, nursing, optometry, pharmacy, public health and veterinary medicine; “Other prof” includes programs such as architecture, library and information science, public policy and social welfare, and other small programs. Medical residents are not included.


Undergraduates have the highest proportion of underrepresented students. Graduate professional and academic populations have comparable representation of underrepresented groups but vary in their share of international students.

7.3.1      Racial/ethnic distribution of students, Universitywide, Fall 2007 to 2016

7-3-1

Undergraduates include approximately 300 postbaccalaureate teaching credential students.

UC systemwide data shows that 28 percent of undergraduate students are from underrepresented groups. About 12 percent of graduate academic and 15 percent of graduate professional students are from underrepresented groups.

International students represent 32 percent of graduate academic and 15 percent of graduate professional students.


The proportion of nonwhite staff is lower among more senior positions, and the proportion of nonwhite academics is highest among nonfaculty academics.

7.3.2      Racial/ethnic distribution of staff, faculty and academic employees, Universitywide, Fall 2016

7-3-2

Source: UC Corporate Personnel System and UC Information Warehouse Data Center1

UC values cultivating a work and learning environment inclusive of all communities. The University seeks to improve representation of domestic racial/ethnic groups that have been historically underrepresented. As shown below, UC is especially challenged by low representation of these groups in senior staff (MSP and SMG), academic and faculty positions.

International employees contribute to the diversity of the UC workforce. These employees bring educational backgrounds and experiences that differ from those of domestic employees. As shown below,  UC is especially challenged by low representation of these groups in senior staff (MSP and SMG), academic and faculty positions.

International employees contribute to the diversity of the UC workforce. These employees bring educational backgrounds and experiences that differ from those of domestic employees. As shown below, the highest proportion of international academics is in the nonfaculty academics category, primarily due to high numbers of international postdoctoral scholars.

  Domestic   International
Black/African American,
American Indian, or
Hispanic/Latino(a)
Asian,
Pac Isl, or
Nat Hawaiian
  All races/ethnicities
PSS (Professional and Support Staff) 26.9% 20.1%   11.0%
MSP (Senior Professionals) 10.3% 20.0%   8.3%
MSP (Managers) 14.2% 15.2%   5.0%
SMG (Senior Management Group) 14.9% 8.3%   3.6%
     
Other academics 7.3% 10.4%   28.4%
Clinical/In-residence Faculty 6.4% 22.0%   15.7%
Lecturers (faculty) 7.9% 9.1%   14,4%
Medical Interns/Residents 8.9% 33.2%   5.8%
Postdoctoral Scholars 3.9% 5.1%   64.8%
Ladder-rank & equivalent 7.5% 9.0%   23.6%

All percentages use the total (both domestic and international) as the denominator.

1 International status for faculty and staff is based on citizenship status instead of IRS tax status. The “Other Academics” group includes only nonstudent employees and comprises many positions (e.g. librarians and administration categories) as well as academic researchers. Students are excluded in all groups.


7.3.3 Racial/ethnic distribution of staff, faculty and academic employees, Universitywide, Fall 2007 to fall 2016

7-3-3

Source: UC Corporate Personnel System and UC Information Warehouse Data Center.


Women constitute more than 40 percent of all student, staff and academic employee groups, except for ladder-rank faculty and senior managers.

 7.3.4      Gender distribution of the University community, Universitywide, Fall 2007 to 2016

7-3-4 

Source: UC Corporate Systems


The share of students who felt their race/ethnicity group was respected declined for all groups between 2014 and 2016.

7.4.1 Response to “Students of my race/ethnicity are respected on this campus,” Universitywide and UC campuses, Spring 2010, 2012, 2014 and 2016

7-4-1

Source: UCUES


7.4 UNDERGRADUATE CAMPUS CLIMATE

The share of students who felt their religion was respected declined between 2014 and 2016, particularly for Jewish and Muslim students.

7.4.2 Response to “Students of my religion are respected on this campus,” Universitywide and UC campuses, Spring 2010, 2012, 2014 and 2016

7-4-2

Source: UCUES


Undergraduates who identify as LGBQ and those who identify as other than male or female are less likely to feel respected on campus than those who do not.

7.4.3      Response to “Students of my sexual orientation are respected on this campus”, Universitywide, Spring 2016

7-4-3

Source: UCUES. Only one year is shown because the response options changed in 2016. Campus data not shown due to small group sizes.

7.4.4      Response to “Students of my gender are respected on this campus,” Universitywide, Spring 2016

7-4-4

Source: UCUES. Only one year is shown because the response options changed in 2016. Campus data not shown due to small group sizes.


7.4 UNDERGRADUATE CAMPUS CLIMATE

Conservative undergraduates are less likely to feel that students of their political affiliation are respected on campus than those with liberal or moderate political opinions.

7.4.5      Response to “Students of my political beliefs are respected on this campus”, Universitywide, Spring 2010, 2012, 2014 and 2016

7-4-5

Source: UCUES