Chapter 12:
Institutional Performance
Overview
UC requires significant resources and planning to support its instruction, research, and public service missions. The indicators in this chapter provide insight into the financial health of the University, the state of capital and space resources, and the environmental sustainability of campus operations.
Financial trends
The University’s revenues, totaling over $36.9 billion in 2018–19 (excluding Department of Energy laboratories), fund its core mission and a wide range of support activities. Over one-third comes from the five UC medical centers, which have collectively nearly doubled in size in the past decade. Contracts and grants are the next largest source of funds and help sustain UC’s research mission.
State General Funds, tuition and fees, and UC General Funds make up the core revenues for the University’s instructional mission. State funds used to be the largest single source of support for instruction; however, cuts in state funding over the past decade reduced this resource. State educational appropriations are less today in inflation-adjusted dollars than they were in 2006–07 and over $1 billion less than what they were in 2000–01, despite significant enrollment growth. The decline in state support has been partly offset by tuition and fees from both enrollment growth and increased rates charged to students, though financial aid increases made up for the tuition and fee increases for many UC students. Improvements in the California economy since 2012, combined with the passage of Proposition 30, have brought some stability to the state budget and thus to the University’s core budget. Modest increases in state funds have allowed for greater stability in tuition and fees and better planning for enrollment growth.
As core revenues per student have declined, the University has sought to increase revenues from other sources. Gift funds have become increasingly important. Private giving has increased; however, over 99 percent is restricted. Gift support tends to be for research, departmental support, and capital projects. The small amounts for instruction and student support cannot offset needs created by enrollment growth that has outpaced growth in core revenues. Private giving varies significantly by campus and relates to the campus’ age, number of alumni, and the presence of health science programs.
Salaries and benefits for academic and support staff are the largest areas of expenditures, which is typical for universities. Although the inflation-adjusted expenditures for educating a student at UC have dropped by 21 percent since 1990, the state’s share of this cost has fallen even more steeply. Consequently, students and their families now contribute a larger share through tuition and fees.
Chronic shortfalls in priority areas — graduate student support, faculty salaries, the ratio of students to faculty, capital renewal, the need to upgrade outdated information systems, and a focus on sustainability — present ongoing financial challenges.
Capital program and funding
The University maintains approximately 6,000 buildings enclosing 148 million gross square feet on approximately 30,000 acres across its ten campuses, five medical centers, nine agricultural research and extension centers, and the Lawrence Berkeley National Laboratory. With such a substantial infrastructure, the University strives to be a good steward of the capital resources entrusted to its care.
UC’s capital program is funded by a combination of state and non-state funds. Historically, the majority of UC’s core academic capital projects were funded by the state. With state funds playing a declining role over the past decade, the University has been forced to rely on other resources. In the past decade, non-state funds, including external financing that utilizes non-state sources to service the debt, have accounted for 80 percent of UC’s capital program funding.
During fiscal year 2017–18, UC approved capital project budgets totaling $2.7 billion. Approximately 87 percent of the cost was met through debt financing that includes external financing supported by state General Funds. The remaining capital projects were funded by non-state sources, including public-private partnerships, which have become a growing part of UC’s capital projects strategy, particularly for student housing.
In 2015–16 and before, the majority of capital projects were aimed at growing core academic programs and replacing aging facilities. In the past three years (2016–17 through 2018–19), there has been an increase in projects that address enrollment growth and program improvements. UC must maintain and upgrade its facilities, of which close to half are more than 35 years old, with many in need of seismic upgrades.
UC sustainability
The University of California is a national leader in sustainability. UC’s sustainability commitment began in 2003 with a Regental action that led to the adoption of a Presidential Policy on Green Building Design and Clean Energy Standards in 2004. Demonstrating the University’s commitment to wise stewardship of its resources and the environment, the Policy has since expanded to include multiple areas of focus: Climate Protection, Green Building Design, Clean Energy, Sustainable Transportation, Sustainable Building Operations, Zero Waste, Sustainable Procurement, Sustainable Food Service, Water, and Sustainability in UC Health. The University’s Sustainable Practices Policy was updated again in 2019.
The University first established a systemwide commitment to climate action leadership in 2007, when all ten Chancellors signed the American College & University Presidents’ Climate Commitment. Furthering this leadership, in November 2013, UC announced an initiative to achieve carbon neutrality by 2025. This initiative will make UC the first major research university system to achieve carbon neutrality. Most recently, all ten UC Chancellors and President Napolitano signed a climate emergency declaration letter in September 2019 that recognizes “the need for a drastic societal shift to combat the growing threat of climate change.”
The University’s Carbon Neutrality Initiative has advanced the University’s work on climate and carbon neutrality research and education, and furthers its leadership in sustainable business practices. Even as the campuses expand, overall greenhouse gas emissions have continued to drop due to improvements in energy efficiency, developing new sources of renewable energy, and enacting a range of related strategies to cut carbon emissions. For example, the University’s Wholesale Power Program is providing 100 percent clean electricity to seven campuses and three medical centers that are eligible to select an alternative energy provider. The Wholesale Power Program supplies approximately 25 percent of the University’s electricity use. UC now generates more on-site renewable energy than any other university in the country and has over 100 renewable energy projects across the system. The University also funded 34 students with Carbon Neutrality Initiative Fellowships during the 2019–20 school year to work on projects supporting UC’s climate neutrality goal.
Upfront investments in energy efficiency are often costly, but energy efficiency projects across the system have so far netted over $285 million in cumulative avoided energy costs since 2005. Moreover, UC’s policy requiring that all new construction projects and major renovations receive LEED® (Leadership in Energy and Environmental Design) certification helps assure that campus growth does not increase energy costs and climate pollution as much as it would otherwise. As of 2019, UC has 321 LEED certifications, the most of any higher education institution in the country. In addition to LEED and energy efficiency requirements, starting in 2019, new buildings are now required to take advantage of the University’s access to carbon-free electricity and not use fossil-fuel combustion for space and water heating except under special circumstances.
Additionally, UC’s fleet continues to move toward zero-emission vehicles. At least 50 percent of all new fleet vehicles purchased in fiscal year 2018–19 at six campuses were all-electric or hybrids.
Looking forward
The COVID-19 pandemic and its associated shelter-in-place requirements have resulted in significant financial losses across the state, both to general campus and auxiliary operations and UC Health operations. It is unclear how significant and lasting this financial loss will be and how campuses will need to adjust during this period. Next year’s UC Accountability Report will begin to report on those losses.
For more information
Over time, UC's varied sources of revenue have grown at different rates.
12.1.1 Revenues, by source, Universitywide, 2000–01 to 2018–19
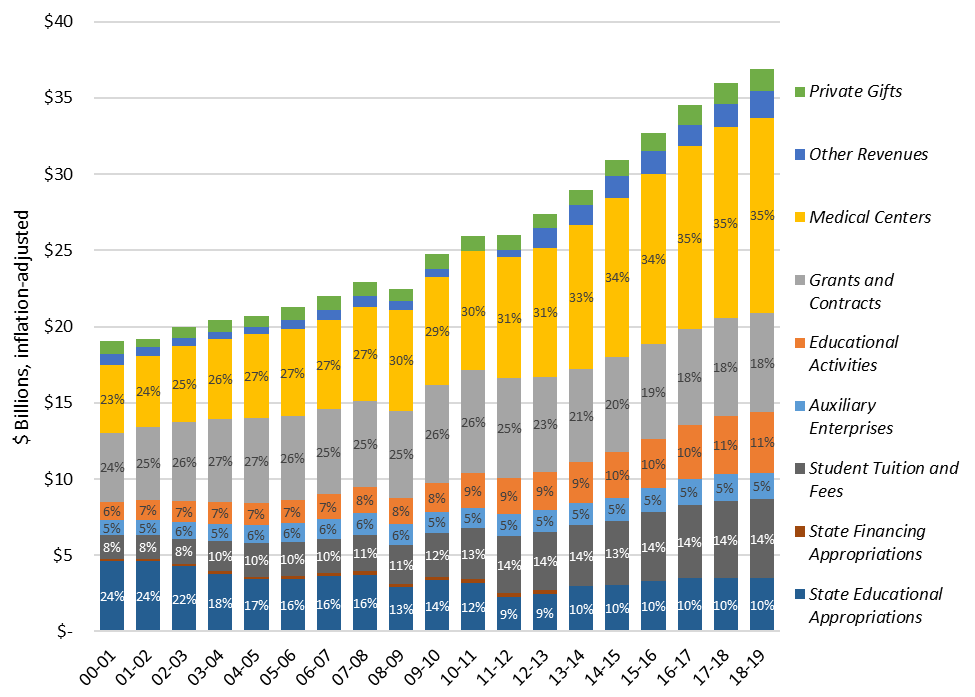
Source: UC Revenues and Expense Trend Report. Amounts do not include Department of Energy Laboratories.
Two major trends are reflected in the University’s revenue sources over time. First, revenues associated with the University’s medical centers and related activities have grown substantially since 2000–01. Medical center revenues now represent 35 percent of all UC revenues. On top of this category, a significant portion of revenues shown as “Educational activities” above is also related to health services.
Second, among the University’s core fund revenues, state appropriations now contribute less to the University’s operating budget than student tuition and fees. In 2018–19, State General Funds comprised 40% of UC’s core fund budget, while student tuition and fees comprised 42%.
Historically, state funding had been the largest single source of support for the University’s core budget. UC used to receive 8.1 percent of all state General Funds in 1966–67, while today it receives only 2.7 percent of those funds.
State educational appropriations are for educational and other specific operating purposes, whereas state financing appropriations provide principal and interest payments for lease-purchase agreements.
Since 2000–01, available core revenues per student have declined by 36 percent.
12.1.2 Per-student average inflation-adjusted core revenues, Universitywide, 2000–01 to 2018–19
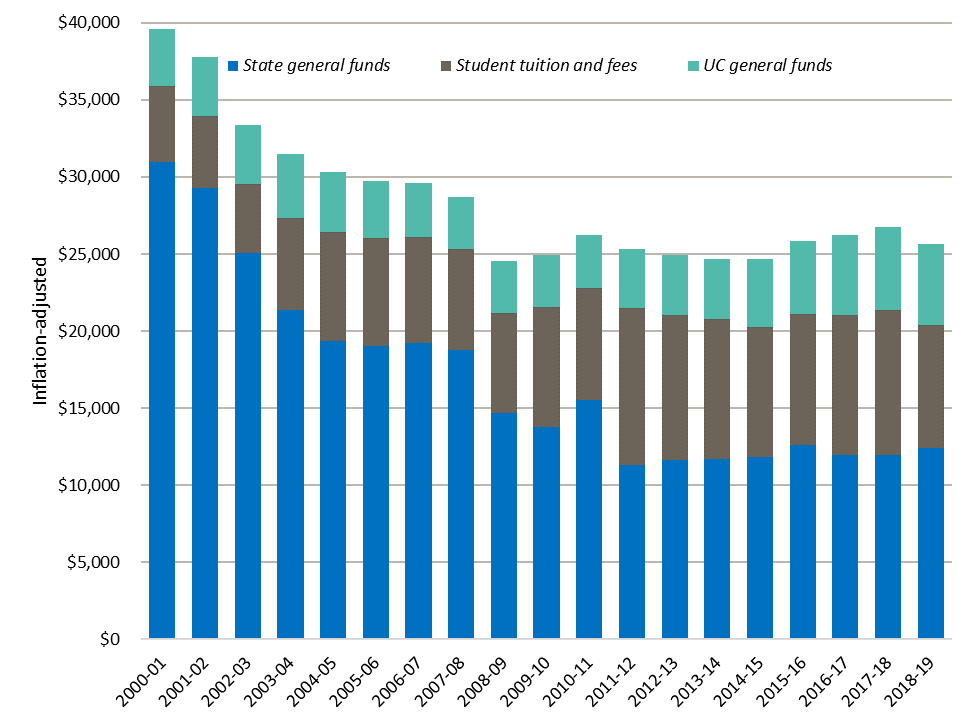
Source: UC Budget Office
Since 2000–01, average inflation-adjusted revenues per student have declined 35 percent. During the same period, the State General Fund portion has fallen even more steeply, by 60 percent.
In some years, the University increased student tuition and fee levels to partly offset the long-term decline in state support. Financial aid increases have covered some or all of these cost increases for families with financial need. These increases in student fee revenue have not, however, fully offset the reduction in state funding per student.
UC General Funds are composed mostly of Nonresident Supplemental Tuition Revenue and indirect cost recovery from research contracts and grants.
Less core revenue per student has put downward pressure on general campus instructional spending per student in particular, as seen in indicator 12.1.5. Ultimately, this pullback may affect the quality of instruction and the student experience.
Virtually all gift funds (99 percent) are restricted by donors in how they may be used.
12.1.3 Current giving by purpose, Universitywide, 2000–01 to 2018–19
Source: UC Institutional Advancement
The University is energetically pursuing increased philanthropic giving as a means to help address budget shortfalls and expand student financial aid.
In 2018–19, new gifts to the University totaled about $2.75 billion. Virtually all of these funds are restricted for specific purposes and are not available to support general operating costs. In addition, approximately $678 million was designated for endowment, so only the income/payout is available for expenditure. Gifts designated for department support are only eligible for use by a specific department or academic division.
The University’s remarkable achievement in obtaining private funding in recent years — even during state and national economic downturns — is a testament to UC’s distinction as a leader among the nation’s public colleges and universities in generating philanthropic funds. These gifts reflect the high regard in which the University is held by its alumni, corporations, foundations, and other supporters.
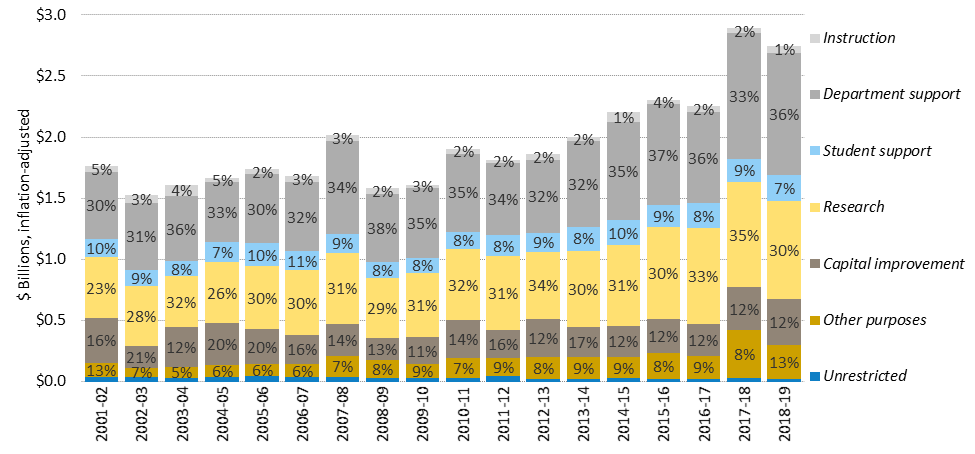
Personnel costs and medical centers are an increasing portion of UC expenditures.
12.1.4 Expenditures by function and type, Universitywide, 2000–01 to 2018–19
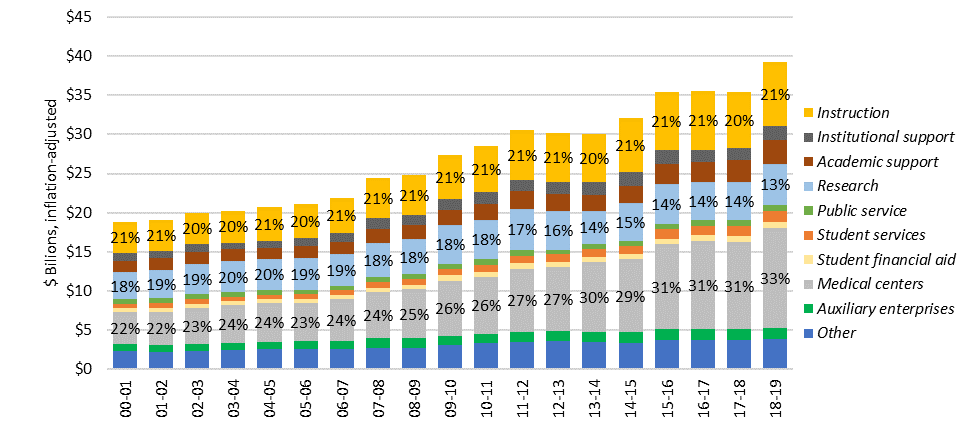
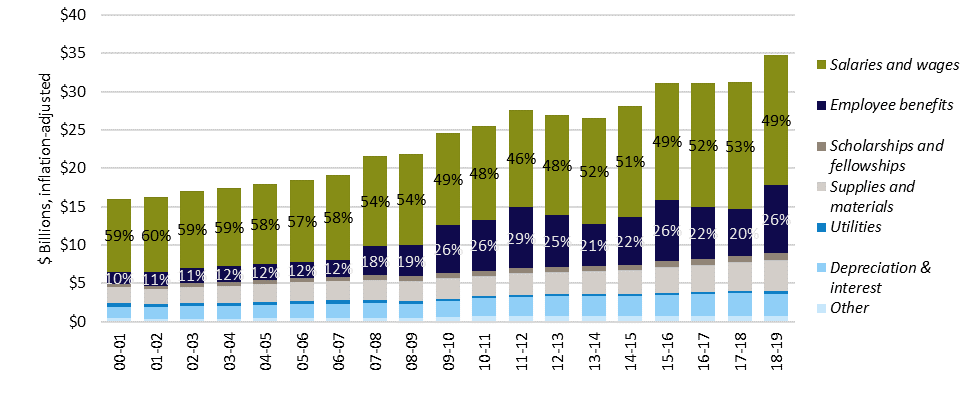
Source: UC Revenue and Expense Trends Report. Dollars are inflation-adjusted dollars using CCPI-W. Amounts do not include Department of Energy Laboratories.
When viewed by function, the combination of instruction, research, and public service accounted for 36 percent of total expenditures during 2018–19, while medical centers (UC’s teaching hospitals) accounted for 33 percent. Other expenses by function include interest, depreciation, and miscellaneous expenditures.
Looking at expenditures by type, nearly 65 percent are dedicated to personnel costs since higher education, health care delivery, and research are inherently labor-intensive enterprises. Salary costs have increased both due to higher average salaries and increased full-time equivalent (FTE) employees, particularly at the medical centers. These increases also affect employee benefits; however, benefit costs also fluctuate due to variations in investment returns on the pension and the discount rate for retiree health.
Since 1990–91, total instructional expenditures per UC student have declined by 21 percent, yet students and their families bear a greater share of that cost.
12.1.5 Average general campus core fund expenditures for instruction per student, 1990–91 to 2018–19
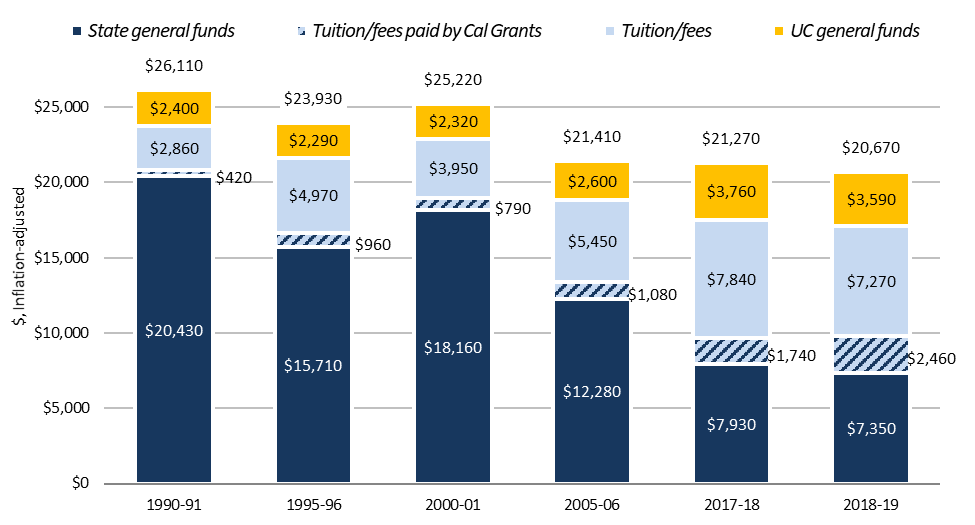
Source: UC Budget Office, inflation-adjusted amounts
Since 1990–91, average expenditures for instruction per student from core funds have declined by 21 percent in inflation-adjusted dollars. Of this amount, the share provided by state support for the University’s budget declined from 78 percent in 1990–91 to only 36 percent of the total in 2018–19. In contrast, the contribution from tuition and fees has increased from 13 percent to 47 percent during the same period.
The state’s Cal Grant program has covered tuition and fee increases for many California resident undergraduate students. However, even after taking Cal Grants into account, state funding covered only 47 percent of instructional expenditures from core funds in 2018–19 compared to 80 percent in 1990–91.
Although the figures in 12.1.2 and 12.1.5 are related, they technically depict different information. Indicator 12.1.2 shows the total amount of core funds at the University’s disposal, relative to the total number of students enrolled, for efforts including instruction, student services, academic support, research, and administration. By contrast, 12.1.5 spotlights UC’s expenditures on general campus instruction alone, relative to the total number of students enrolled. Put another way, 12.1.2 and 12.1.5 feature how the following metrics have changed over time: UC’s core fund source-mix and total, and UC’s expenditures on general campus instruction, respectively.
The majority of UC’s capital project funding over the last ten years continues to be derived from non-state fund sources. Starting in 2013–14, changes to the California Education Code allowed UC to direct a portion of its existing state operating funds support to capital.
12.2.1 Sources of capital project funding by year of approval, Universitywide, 2007–08 to 2018–19
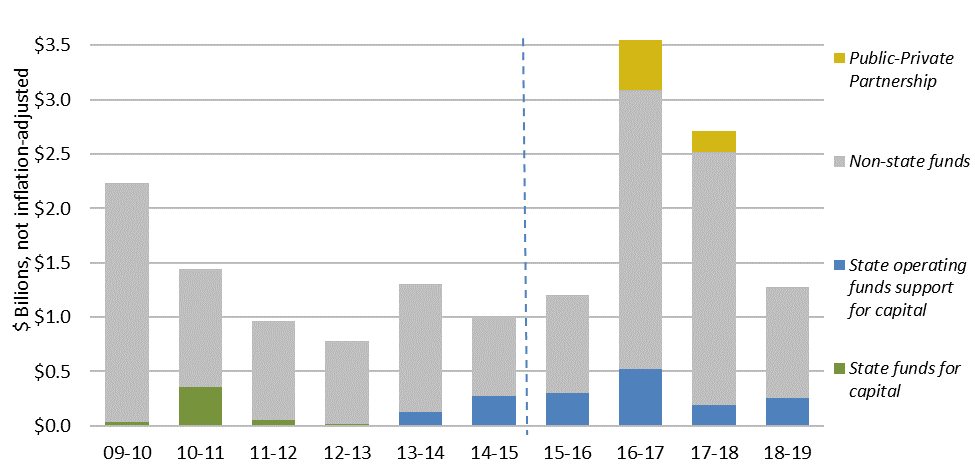
Source: UC Capital Asset Strategies
The University’s capital program is driven by the campuses’ and medical centers’ strategic plans. UC’s capital program is funded by a combination of state and non-state funds. The nature of state funds has changed in recent years.
As illustrated in indicator 12.2.1, the dominant source for capital is non-state resources. Public-Private Partnerships are not included in the 2018–19 totals. A General Obligation (GO) bond was placed on the March 2020 ballot but it was not passed by the voters.
Legislation in 2013–14 and 2018–19 enacted a change in how UC could fund its debt service, availability payments and expenditures for capital outlay. Instead of receiving dedicated capital funding from the state, UC can direct a portion of its State General Fund appropriations to fund debt service for state-eligible capital projects. The portion of State General Funds that is directed to capital does not represent new state funding and is made up of funds that are redirected from operations to support capital.
State funds were historically the primary source of funding for core academic facilities and seismic compliance for acute care hospitals, however, due to the elimination of specific state appropriations, some needs have been financed by the University. Non-state sources fund most of UC’s state-eligible capital needs as well as all self-supporting enterprises, such as housing, parking, athletics, and medical centers. To the extent that non-state funds are used to support core academic capital needs, less funding is available to support other high- priority needs such as deferred maintenance, seismic, and enrollment growth.
The 2018–19 capital project program is heavily supported by external financing.
12.2.2 Sources of capital spending detail, Universitywide, Project budgets approved in 2018–19
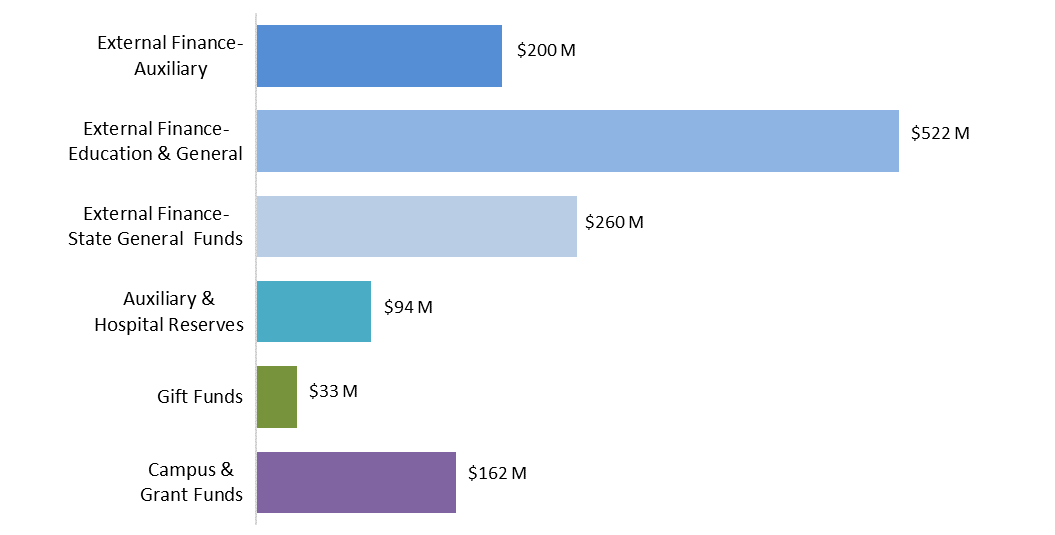
Source: UC Capital Asset Strategies
The University and each campus carefully consider how to deploy resources to optimize the benefits to academic programs and the University’s mission as a whole.
With state funding playing a declining role in the University’s capital program over the past decade, the University has relied on other means to fund capital projects. As noted in indicator 12.2.2, approximately 21 percent of capital funding for the 2018–19 capital program utilized external financing supported by state General Funds that could have been used to support operations.
In addition, campuses redirect non-state funds to projects that otherwise would have been funded with state resources.
External financing continues to play an important role in funding capital needs. About 57 percent of capital project funding in 2018–19 came from non-state supported external financing. The non-state financing supports student housing projects as well as research projects related to program improvements in the sciences.
The remainder of UC’s capital program is funded by gift funds, campus funds, and other non-state sources. These campus funds are derived from a variety of sources, including indirect cost recovery and investment earnings.
The majority of capital funds approved for expenditure in 2018–19 supported projects addressing growth in enrollment and renovation or replacement of aging facilities.
12.2.3 Types of capital projects, based on budgets approved by year, Universitywide, 2012–13 to 2018–19
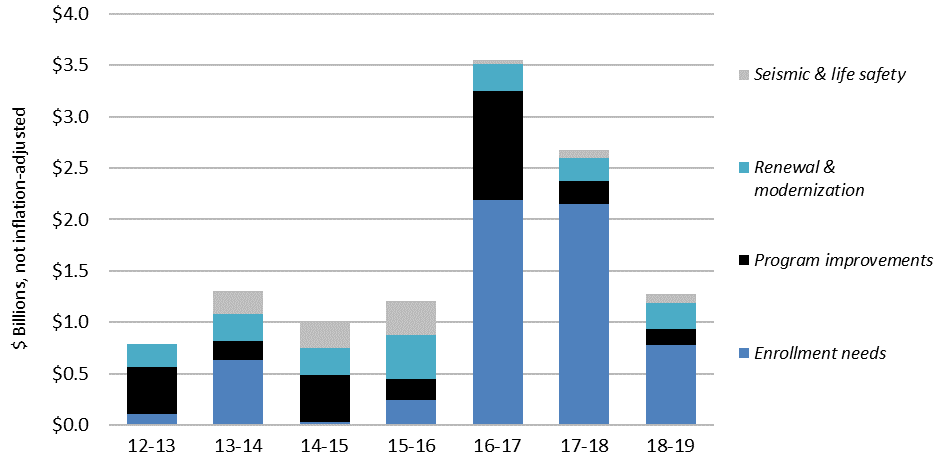
Source: UC Capital Asset Strategies
Capital projects may address several objectives. Continuing enrollment growth has largely driven the University’s requirement for new teaching laboratories, classrooms, and student housing and services. In 2018–19 alone, UC approved $775 million for projects that address enrollment needs. The campuses must expand teaching laboratories and classrooms to meet the increases in enrollment.
Program improvements and modern program initiatives require state-of-the-art space, often necessitating the repurposing of existing facilities or new construction. In 2018–19, UC devoted approximately $163 million for program improvements to address academic, research, and clinical priorities.
Campus facilities age and must be renewed and modernized to ensure safety, extend the useful life of the buildings, and improve energy efficiency. Building systems, elevators, and roofs need periodic replacement and renewal during the lifespan of a building. In 2018–19, UC approved $246 million for these types of projects.
In addition to general renewal, the University continues to review the seismic safety of its facilities. UC devoted $90 million to seismic and life-safety improvements to buildings in 2018–19.
In the past decade, UC space has increased by approximately 11 percent, with most of the growth targeted for instruction and research, and residential uses.
12.2.4 Assignable square footage (ASF), Universitywide, 2009–2019
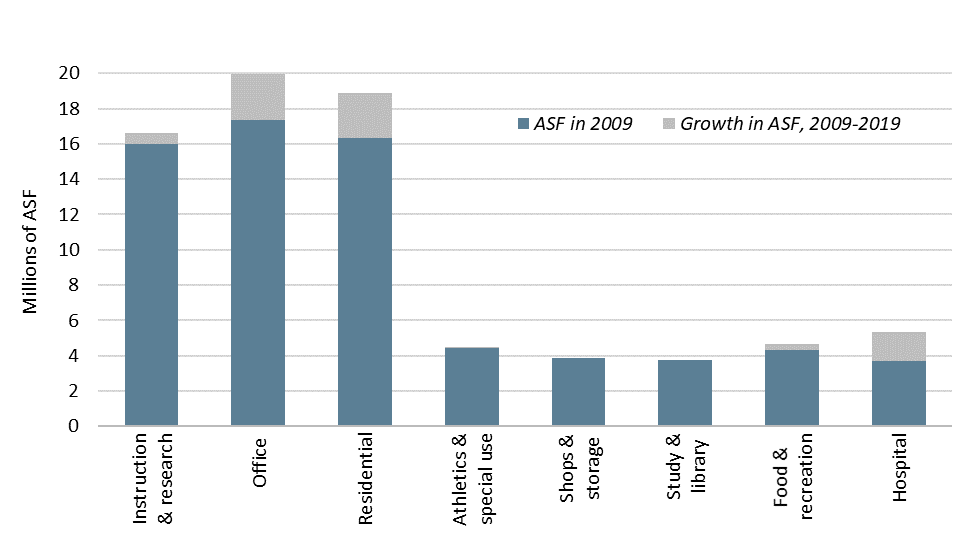
Source: UC Capital Asset Strategies
Assignable square footage (ASF) is the space available for programs or assigned to specific uses. It does not include corridors, bathrooms, or building infrastructure.
Indicator 12.2.4 illustrates the growth in space over the last decade, according to categories for assignable space. Since 2009, space has increased by 7.3 million ASF for a total of 77 million ASF.
In the past decade, instructional and research space increased by about 600,000 ASF, office space by 2.6 million ASF, and residential space by 2.6 million ASF. The space increase for these areas (12 percent) is has not kept pace to the to the increase in fall enrollment (26 percent) for the same period. Residential space has grown as campuses strive for more on-campus student housing to improve student life in living/learning communities and to reduce environmental impacts from commuting. Increases in the student population have also required additions to athletic, recreational, and food service space.
Hospital space significantly grew in the past decade. All five medical centers experienced growth but most of the growth in hospital space can be attributed to UCSF Medical Center at Mission Bay and Ron Conway Family Gateway Medical Building (2015), and the Jacobs Medical Center at UC San Diego Health (2016).
UC has made consistent progress toward its greenhouse gas emission goals.
12.3.1 Greenhouse gas emissions compared to climate goals, Universitywide, 2009–2025
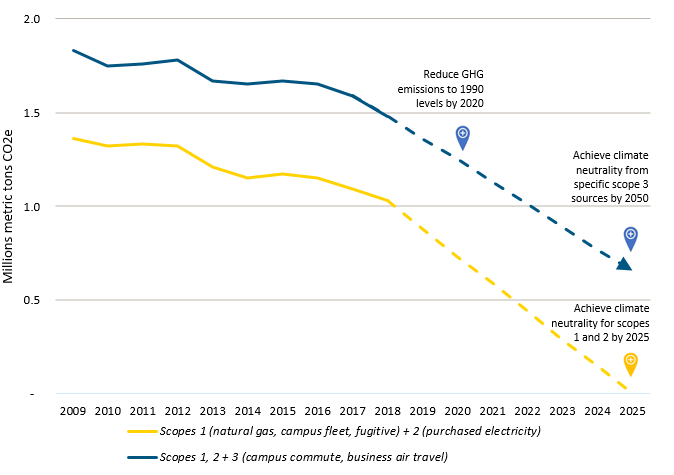
Source: UCOP Energy and Sustainability Office
The University’s scope 1 and scope 2 greenhouse gas (GHG) emissions decreased by 15 percent since the Carbon Neutrality Initiative was announced in 2013, committing the University to carbon neutrality by 2025. This includes a three percent reduction in scope 1 emissions and a 14 percent reduction in scope 2 emissions in 2018 compared to 2017. Emissions in 2019 are expected to show a further decrease as UC’s Wholesale Power Program procured more clean electricity.
The University also generates more on-site renewable energy than any other university in the country, approaching 50 megawatts. UC’s inventory of renewable energy supplies includes generation from over 100 on-site and off-site sources.
Energy efficiency upgrades resulted in cumulative net avoided costs for the University of $285 million by the end of 2019.
12.3.2 Cost avoidance from energy efficiency projects, Universitywide, 2005–2019
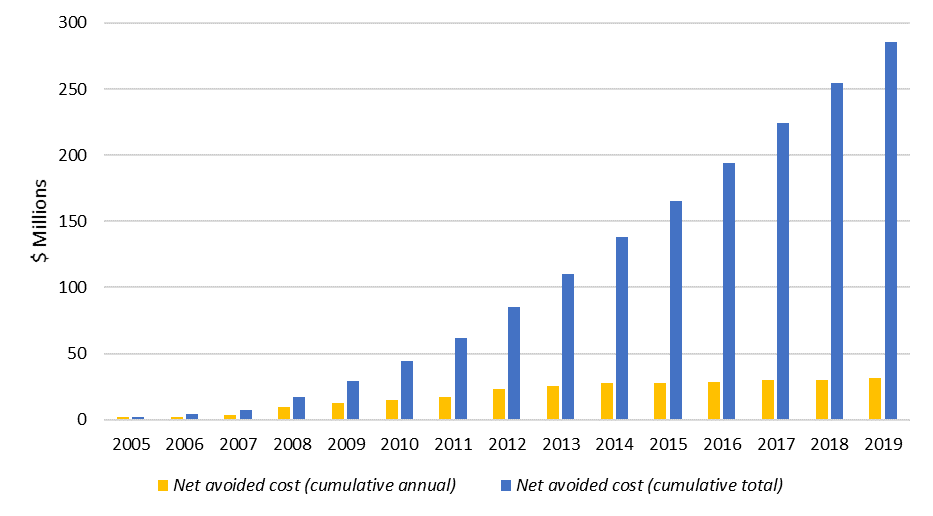
Source: UCOP Energy and Sustainability Office
In 2004, the University formed a statewide energy efficiency partnership program with California State University and the state’s four investor-owned utilities to improve the energy performance of higher education facilities. The partnership has provided funding for equipment retrofits, monitoring-based commissioning, and training and education.
Since its inception, over 1,000 energy efficiency and new construction projects have registered with the Energy Efficiency Partnership Program, which has allowed UC campuses to avoid over $285 million in utility costs while reducing greenhouse gas emissions. Fifty-four UC projects participated in the program in 2019.
While campuses have used a portfolio approach to balance projects with shorter and longer paybacks, the future focus on the remaining deeper energy efficiency retrofits to achieve climate goals will result in lower levels of net avoided costs due to larger up-front investments.
By the end of 2019, UC had achieved 321 LEED® certifications, more than any other university in the country.
12.3.3 LEED® certifications, Universitywide
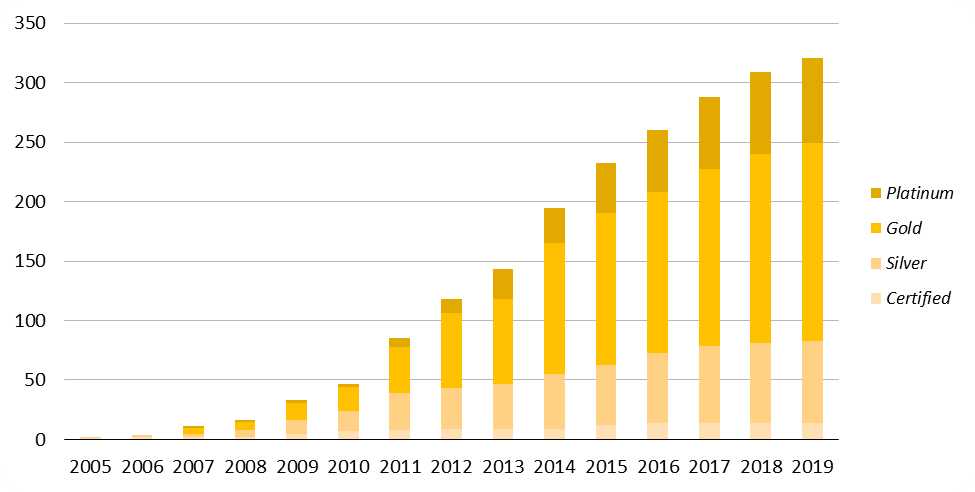
Source: UCOP Capital Resources Management
The University’s sustainable practices policy requires that all new buildings and renovations are designed and constructed to a minimum LEED® (Leadership in Energy and Environmental Design) for New Construction Silver rating. The policy also states that each campus shall seek to certify as many buildings as possible through the LEED – Existing Buildings, Operations and Maintenance (EBOM) rating system to “green” the day-to-day, ongoing environmental performance of its existing facilities.
UC has 321 LEED certifications systemwide, with 43 projects certifying under the LEED – EBOM system. In 2019, UC added two new LEED Silver, seven LEED Gold, and three LEED Platinum certifications. UC’s total of 321 LEED certifications is the most of any university.
UC LEED® certifications are listed at ucop.edu/sustainability/policy-areas/green-building/index.html.