Chapter 2:
Undergraduate students: affordability
Goals
The goal of the University’s undergraduate financial aid program is to ensure that the University remains accessible to all academically eligible California students, regardless of their financial resources.
Affordability is among UC’s highest priorities. The University has maintained a strong record of enabling families from all income levels to finance a high-quality education, and it closely monitors the impact of its pricing decisions and financial aid programs.
Maintaining inclusive access
The total cost of attendance and the composition of undergraduates in terms of financial resources set the framework for what is required to provide adequate financial support.
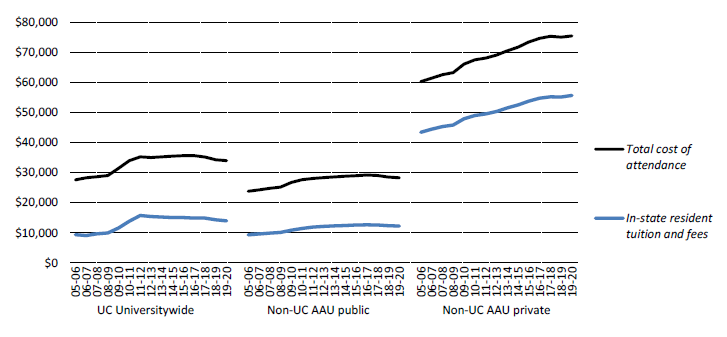
For in-state students who live on campus, the total annual cost of attendance, which comprises tuition and fees and other expenses (e.g., living and personal expenses, books and supplies, transportation, and health care), has remained relatively flat over the last several years at about $35,000. This figure compares to about $27,000 on average at other Association of American Universities (AAU) public institutions and around $71,000 for the AAU private institutions (2.1.1).
The income profile indicators demonstrate that the University remains accessible to low-income students. Between 2008–09 and 2019–20, the proportion of UC in-state undergraduates in the lowest income category increased from 14 percent to 21 percent, with offsetting declines among upper- and upper-middle-income families (2.2.2). These trends reflect both the manageability of UC’s net cost for low- and middle-income families, and the decline in the incomes of UC families since the 2009 economic recession.
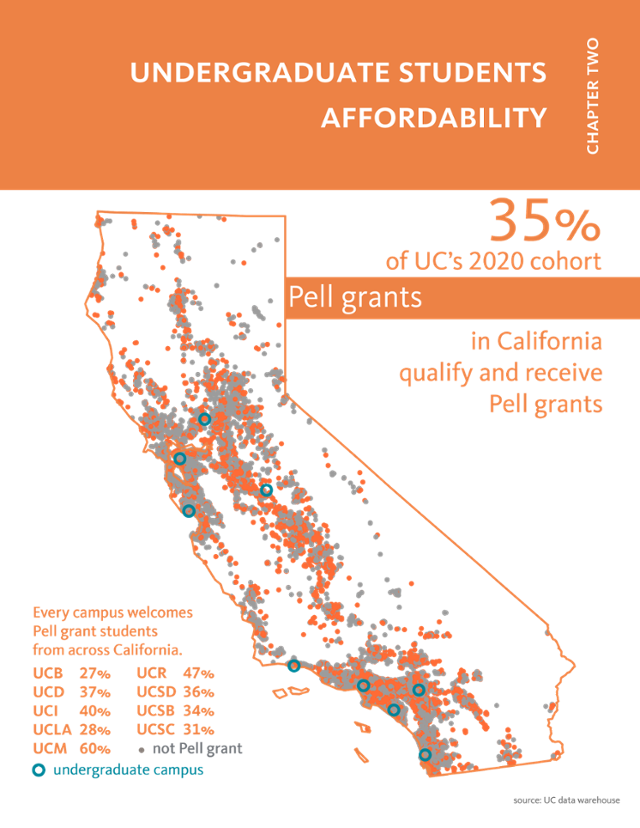
In fall 2020, 35 percent of all UC undergraduates received a Pell Grant, which is a federal grant for low-income students with family incomes typically under $50,000. Pell Grant recipients comprise a higher share of UC’s student body than they do at both AAU public (22 percent) and AAU private (16 percent) institutions (2.2.1).
Financing a UC education
UC is able to provide access to students across the economic spectrum thanks to a progressive financial aid program that considers how much parents can afford; federal, state, and University gift aid or grants; and a manageable student “self-help” contribution from work or borrowing.
Gift aid dramatically reduces the net cost of attendance (total cost of attendance less gift aid) for students and enables those from low- and middle-income backgrounds to enroll in sizable numbers and proportions. The resulting inflation-adjusted net cost of attendance for in-state students from families in the lowest income bracket (less than $60,000) has declined or remained stable since 2004–05.
Federal and state governments provide critical support through the Pell Grant and Cal Grant programs. In addition, UC’s commitment to affordability is evident in the University’s strong systemwide financial aid program. As a result of this robust institutional financial aid program, which combines support from different sources, 56 percent of California resident undergraduates paid no tuition in 2019–20. Furthermore, over two-thirds of UC’s own grant program helps students cover non-fee costs such as room, board, and book expenses.
Both UC and the State of California have made it a priority to provide financial support to undocumented students. Approximately 4,500 undocumented students received Cal Grants or need-based UC grants in 2019–20, totaling $99.9 million. The California Dream Loan Program continues to provide student loans to undocumented Assembly Bill (AB) 540 students at CSU and UC.
The Legislature has provided $2.5M in UC’s annual budget for the program, which has been matched by UC’s own funding of $2.5M each year. Undocumented students who qualify for a waiver of nonresident supplemental tuition under AB 540 have been eligible for Cal Grants and UC grants since 2013 under the California Dream Act.
An undergraduate’s self-help requirement can be met through a combination of work and loans. UC relies on student surveys — including the UC Undergraduate Experience Survey (UCUES) and Cost of Attendance Survey — to measure how much students work. UCUES data show that over 50 percent of undergraduates do not work. Studies indicate that 20 hours of work per week is the threshold at which undergraduate academic performance may be adversely affected, and UC’s financial aid programs are structured to expect no more than 20 hours. Nevertheless, in the most recent UCUES survey (2020), ten percent of students reported working more than 20 hours per week, the same share as two years earlier.
For the academic year 2019–20, about 36 percent of California undergraduates relied on federal student loans to help finance their education, with loan amounts averaging $5,900. Parental borrowing under the federal PLUS program remained at about six percent, with the average PLUS loan amount at about $16,000 per year.
Since 2014–15, California’s Middle Class Scholarship program has provided a new source of gift assistance for students at UC and the California State University with household incomes of up to $171,000 who receive limited or no need-based financial aid. In 2019–20, UC students received $34 million in Middle Class Scholarship awards.
Addressing basic needs
Universities across the nation are attempting to address student basic needs. UC provides unprecedented access to low-income students and has prioritized efforts to address food and housing insecurity. Spring 2020 UCUES survey results show 39 percent experience low to very low food security (20 percent report very low food security) and four percent report being homeless. The UC Office of the President (UCOP) has partnered with UC Systemwide Basic Needs Committee members to share data collection efforts and findings with intersegmental groups, including our California State University and California Community College colleagues, and has presented survey results to the UC Board of Regents Special Committee on Basic Needs.
The Regents Special Committee on Basic Needs issued a series of recommendations related to assessing and supporting student basic needs. Among the recommendations was to expand UC student access to the state CalFresh program. To facilitate this, the Committee recommended conducting research on the barriers to CalFresh eligibility and trends in CalFresh enrollment systemwide by the end of 2021. UCOP will partner with the California Policy Lab to conduct this study.
Limiting cumulative debt
The proportion of undergraduates leaving with debt is lower than a decade ago. About 44 percent of the class of 2019–20 graduated with debt, with an average amount of $19,200. This translates into a monthly repayment amount of about $204 for ten years at a five percent annual interest rate. This level of debt is manageable, considering that a typical graduate who takes out loans earns about $3,500 a month within two years after graduation (2.3.5). Comparison data show the 2018–19 cumulative debt for UC undergraduates was $19,200, compared to $27,500 for public four-year institutions and $33,400 for private nonprofit four-year institutions (2.3.6). UC President Michael Drake has also proposed creating a debt-free path to UC that would eliminate the need to borrow for qualifying students.
pandemic impact
The 2020 COVID pandemic disrupted the University’s education delivery, moving nearly all courses online. The pandemic also had several impacts on students, parents, and how they paid for college costs. Both graduate and undergraduate students were impacted and both received emergency grant support from the federal government, the State of California, and UC.
Students who were living in on-campus housing were largely forced to move home with their families or into off-campus housing. Those who would have faced hardship moving off-campus were provided with accommodation. Because living off-campus and, particularly, with their families, is less expensive, the aggregate financial need for students was reduced. This reduction in aggregate need extended into 2020–21.
The federal Coronavirus Aid, Relief, and Economic Security (CARES) Act provided $12.6 billion directly to colleges and universities. Across UC campuses, $130 million was made available through CARES for student support, providing an average of $834 to 134,381 recipients. UC and State funds supplemented CARES emergency grants with $5 million to provide equivalent support for undocumented students, which provided an average award of $1,139 to 4,457 students.
Looking forward
Both the Governor and State Legislature have proposed ideas for reforming and expanding the Cal Grant Program. In 2019–20, Governor Newsom’s proposal for Cal Grant awards to parenting students was implemented. The State Legislature requested the California Student Aid Commission (CSAC) propose changes to the Cal Grant Programs. Although the economy puts broad reform on hold, the CSAC recommendations would have benefited UC students by eliminating requirements that disenfranchise nontraditional students. The University is also engaged in federal advocacy efforts to double the Pell, along with examining other opportunities to increase affordability for UC students.
Under the UC 2030 multi-year plan, UC’s goal is to increase timely graduation, which would reduce student debt and the cost of education.
For more information
UC resident tuition and fees and total costs have remained relatively flat over the last several years, and while they still exceed the national average for other AAU public institutions, they remain below the average for AAU private institutions.
2.1.1 Total cost of attendance for undergraduate in-state residents, Universitywide and comparison institutions, 2019 inflation-adjusted dollars, 2005–06 to 2019–20
Source: IPEDS1
The total cost of attending college includes tuition and fees as well as living expenses, books and supplies, transportation, health insurance, and personal expenses. The total cost of attendance is higher at UC than at AAU public comparison institutions primarily because of higher costs beyond tuition and fees, especially the high cost of living in California.
UC tuition and fees and the total cost of attendance have remained relatively flat over the past several years.
1 Charges are for in-state students living on campus. Averages are simple averages. Weighted averages for UC can be found at ucop.edu/student-affairs/data-and-reporting/student-budget-tables/index.html. A list of the 28 non-UC AAU public and 26 AAU private institutions in the comparison groups can be found in the data glossary.
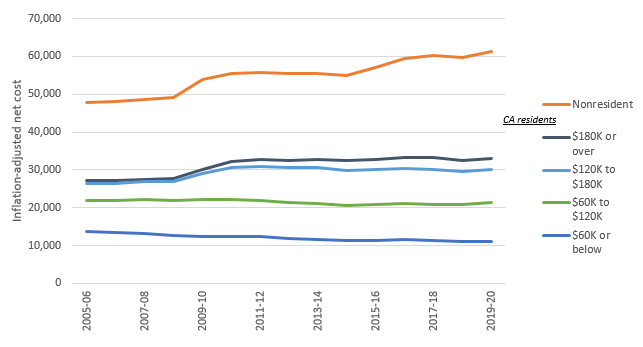
Regardless of income, the net cost of attendance after financial aid for CA resident students has remained stable or declined since 2010–11. The net cost of attendance for nonresident students is substantially higher and has grown.
2.1.2 Net cost of attendance by family income and California residency, Universitywide, 2019 inflation-adjusted dollars, 2005–06 to 2019–20
Source: UC Corporate Student System1
A general measure of the University’s affordability is its average net cost of attendance. This represents the total cost of attendance at the University for undergraduates after taking into account scholarships and grants. Scholarships and grants reduce the net cost of attending UC for students at all income levels but have the greatest impact on students from low- and middle-income families.
The availability of scholarships and grants has mitigated the impact of cost increases on students from families earning less than $100,000.
Between 2005–06 and 2019–20, net cost has declined by about $2,600 in inflation-adjusted dollars for in-state students in the lowest income category due to this scholarship and grant support.
Nonresident students face a much higher net cost of attendance because they face annual supplemental tuition charges in excess of $29,000, and since 2016–17, have not been eligible to receive institutional need-based grant aid.
1 Income ranges are approximate. Independent students are excluded. Net cost is the full cost of attendance less any grants, scholarships, and fee exemptions. Income is based on amounts reported in either the Free Application for Federal Student Aid (FAFSA) or the UC Application for Undergraduate Admission, or, if missing, is imputed based on demographic profiles.
UC enrolls a higher percentage of Pell Grant recipients than public or private peers.
2.2.1 Undergraduate Pell Grant recipients, UC and comparison institutions, 2018–19
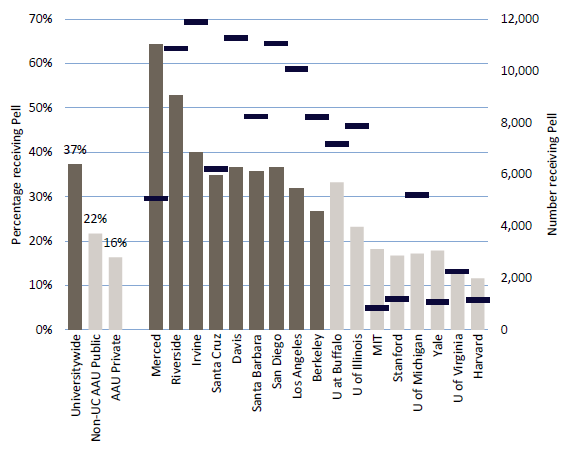
Source: IPEDS1
The percentage of undergraduate students with Pell Grants, a federal aid program for low-income students, provides a useful means to compare different institutions in terms of their accessibility for low-income students. It is also a useful indicator for comparing the socio-economic diversity of an institution’s undergraduate student population.
The data shown above represent the most recent year for which data on comparison institutions are available. The proportion of UC undergraduates receiving Pell Grants went up from 31 percent in 2008–09 to 37 percent in 2018–19. This is primarily a result of increased federal spending, which made more students eligible for Pell Grants, as well as the economic downturn from the 2009 recession, which caused broad declines in family income. By fall 2020, 35 percent of UC undergraduates and 41 percent of CA Residents received Pell Grants. Nationally, the percentage of Pell Grant recipients has declined steadily since 2010–11, partially due to a growing economy prior to the 2020 pandemic.
1 Percentage reported is that of students who received Pell Grants at any time during the year as a percentage of all undergraduates. Note that Pell Grant eligibility criteria change annually because of the federal appropriations process and other formula changes. Thus, trend analysis of Pell recipients would not be a valid measure of changes in low-income students but rather would reflect the changes in eligibility criteria. A list of the institutions in the AAU comparison groups can be found in the data glossary.
A large proportion of UC students come from low-income families, particularly among in-state students.
2.2.2 Undergraduate income distribution, Universitywide, 2019 inflation-adjusted dollars
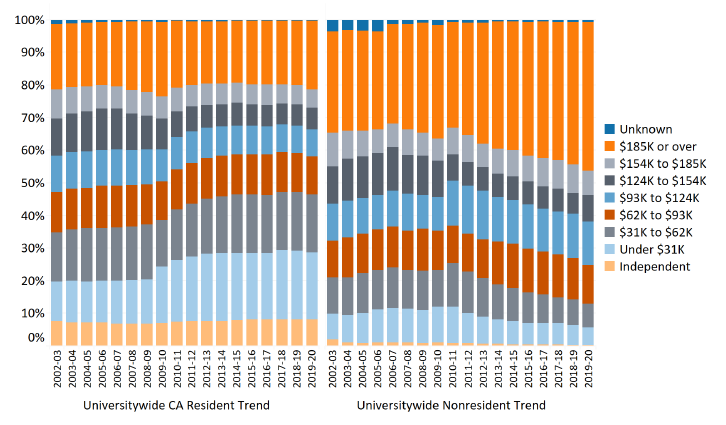
Source: UC Corporate Student System1
In-state students are more likely to be from low-income families, with 21 percent in the lowest income category in 2019–20. Since 2008–09, the proportion of low-income CA resident students increased noticeably, with an offsetting decline among upper- and upper-middle-income families. During the last two years, however, the income distributions of CA resident families have stabilized.
This suggests that the University’s financial aid programs keep the net cost of attendance within reach of CA resident and low- and middle-income families.
Conversely, more than 45 percent of nonresident students came from families in the highest income category in 2019–20. This proportion has increased steadily over the years while those in the lower- and middle-income categories have decreased.
Nonresidents are not eligible for UC financial aid.
1 Note that prior to 2007–08, an increasing number of students at one campus with parent incomes above $100,000 were incorrectly categorized as having an income of $100,000. This problem was fixed in 2007–08, resulting in an apparent (but not actual) decline in the percentage of students shown in the $107,000 to $134,000 category and a corresponding increase in the percentage shown in higher income categories.
The share of UC students who felt that the cost of attendance was manageable has been relatively stable over the past several years.
2.3.1 Student response to “With grants and scholarships, if any, the total cost of attending the school is manageable," Universitywide and comparison institutions 2011–12 to 2019–20
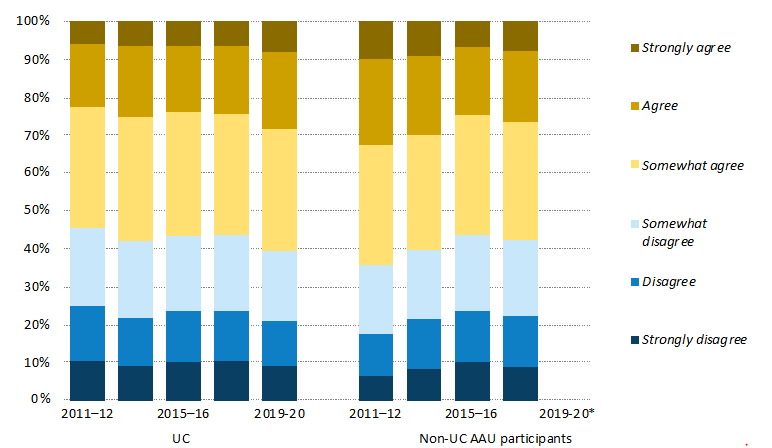
Source: UCUES and SERU1
Sixty percent of UC undergraduates in spring 2020 felt that the cost of attendance was manageable. This figure has risen gradually from 55 percent since the spring 2012 UCUES survey. In the most recent year available, fifty-eight percent of survey respondents at other participating American Association of University (AAU) institutions in agreed that the cost of their education was manageable.
The list of non-UC AAU participants in this comparison was not the same for all four years shown. The non-UC schools included University of Minnesota, Rutgers University, University of Pittsburgh, USC, Texas A&M University, University of Virginia, University of Michigan, Indiana University, Purdue University, University of Iowa, University of Washington, University of Oregon, University of Texas at Austin, University of Florida, University of North Carolina, University of Kansas, and Michigan State University.
1 SERU is the Student Experience in the Research University survey, which is administered at a number of AAU institutions.
Universitywide, 44 percent of students reported being food insecure and five percent reported experiencing homelessness.
2.3.2 Percent of students who are food insecure or are experiencing homelessness, Universitywide and by campus, 2020
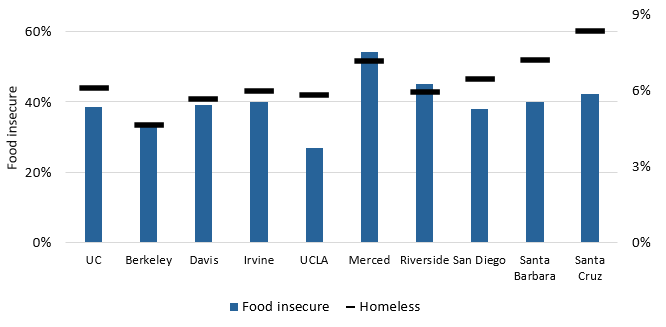
Source: UCUES 2020
A growing body of research has revealed that basic needs insecurity, the lack of the minimum necessary supports for well-being, jeopardizes student success.
Recognizing basic needs support as a key facilitator of student degree attainment, UCOP collaborated with the UC Systemwide Basic Needs Committee, which comprises campus representatives, to institutionalize data collection concerning student basic needs.
Forty-seven percent of undergraduates experienced food security in 2018. UC’s goal is to reduce that by half, to 24 percent, by 2025.
2.3.3 Percent of students who experienced food insecurity in 2018 and 2020, with the 2025 Goal
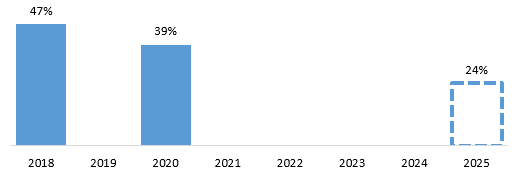
Source: UCUES and GUEA
UC has also set a goal to reduce undergraduates experiencing housing insecurity from 7 percent, in 2020, to 3.5 percent, by 2025.
2.3.4 Percent of students who experienced housing insecurity in 2020, with the 2025 Goal
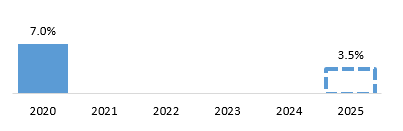
Source: UCUES and GUEA
Since 2016, UCOP has included items related to basic needs in UCUES, using the USDA standard for food insecurity measures, while developing the indicator for homelessness to track a broader measure of housing insecurity. The food insecurity survey replaced the 2016 two-item module with a six-item module developed by the U.S. Department of Agriculture. The six-item module distinguishes between low and very low food security (combined to identify students experiencing food insecurity), while the two-item module can only be used to identify students experiencing food insecurity.
The inclusion of food and housing insecurity items in UCUES will allow the University to measure the impact of basic needs campus services and track the University’s progress in improving student basic needs. Also, it should be noted that students who responded to the 2020 UCUES were taking online classes, so they may have been staying with parents or family members, which may have affected the results.
To guide the University in its journey to reduce basic needs insecurity, the Regents’ Special Committee on Basic Needs issued a 2020 report, which established long-term aspirational goals to reduce food and housing insecurity at the University by 50 percent by 2025.
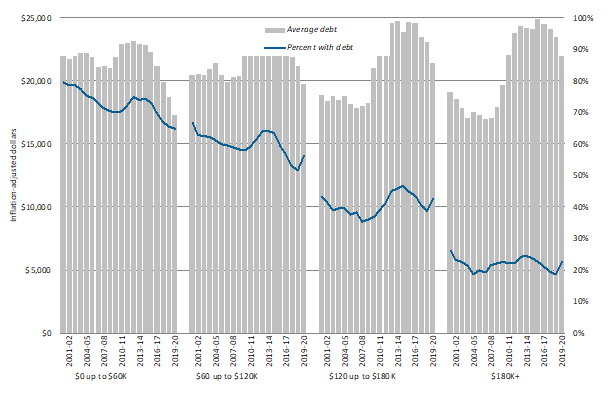
The average inflation-adjusted debt at graduation of student borrowers has gradually declined to $19,000 over the past 19 years, while the percent graduating with no debt has increased.
2.3.5 Student loan debt burden of graduating seniors, inflation-adjusted, Universitywide, 2000–01 to 2019–20 (average debt of those with debt shown above each year)
Source: UC Corporate Student System1
Fifty-two percent of UC undergraduates graduate with no debt at all. For those who do borrow, the average student loan debt at graduation in 2019–20 was about $19,200. The monthly repayment for this amount is about $204 for ten years at the five percent average interest rate that typically applies to student loans. Lower payments are available with longer repayment periods. For more information about estimated loan repayment amounts using this rate, visit the “Loans and Earnings” tab of the UC Alumni-at-work dashboard at: universityofcalifornia.edu/infocenter/uc-alumni-work
These figures reflect the borrowing of all graduating UC students. California resident students, however, are more likely than out-of-state students to graduate with debt. In 2019–20, about 52 percent of UC graduates who originally entered as California resident freshmen had student loan debt upon graduation, compared to only 12 percent of out-of-state students. In-state graduates’ average debt, however, was significantly lower than that of the out-of-state students who borrowed ($18,800 vs. $27,800).
1 Figures are adjusted for inflation in 2019 dollars using CA CPI-W. Borrowing shown here represents loans coordinated through the campus financial aid offices; some families also borrow from outside sources, which are not captured in this indicator. Data only include graduates who originally entered as freshmen.
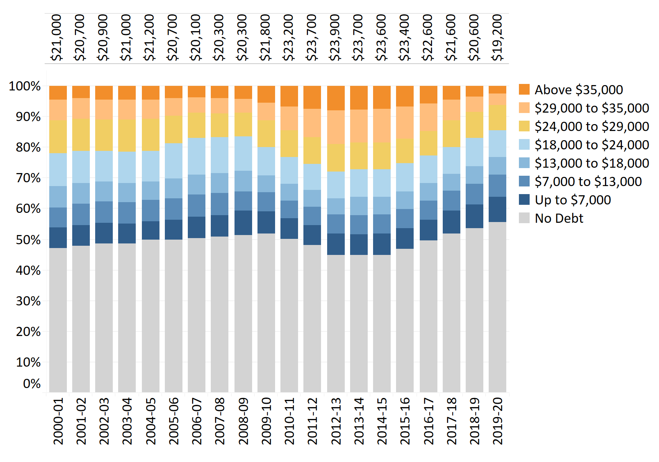
Despite recent increases, the proportion of students graduating with loan debt across all incomes in 2019–20 was lower or comparable to what it was 19 years ago.
2.3.6 Student loan debt burden of graduating seniors by parent income, Universitywide, 2019 inflation-adjusted dollars
2001–2002 to 2019–20
Source: UC Corporate Student System1
The proportion of students who borrow decreased steadily from 2000–01 through 2009–10 for students in nearly every income category. From 2010–11 through 2012–13, student borrowing increased, both in percentage and in cumulative amount. This uptick in borrowing may reflect a combination of higher costs and a reduction in other borrowing alternatives (e.g., home equity loans). In the last year, however, student borrowing remained the same or decreased slightly for the lowest two income categories and for the highest income category. UC student debt remains below the national average for both public and private non-profit four-year institutions.
2.3.7 Average cumulative loan debt, UC and national comparison institutions, 2018–19 graduates
|
Merced
|
$17,872
|
|
Davis
|
$18,985
|
|
Santa Barbara
|
$18,995
|
|
UC Average
|
$19,225
|
|
Irvine
|
$19,597
|
|
Berkeley
|
$19,773
|
|
San Diego
|
$20,536
|
|
Riverside
|
$20,779
|
|
Santa Cruz
|
$21,375
|
|
Los Angeles
|
$21,441
|
|
|
|
|
Public four-year
|
$27,539
|
|
Private nonprofit four-year
|
$33,389
|
|
National Average
|
$28,950
|
Source: Common Data Set and TICAS. National average excludes private for-profit institutions.
1 Figures are adjusted for inflation in 2019 dollars using CA CPI-W. Borrowing shown here represents loans coordinated through the campus financial aid offices; some families also borrow from outside sources, which are not captured in this indicator. Independent students and students with unknown parent incomes are not shown. Data only include graduates who originally entered as freshmen.
By five years after graduation, students from almost all of UC’s baccalaureate programs have debt-to-earnings ratios of less than ten percent.
2.3.8 Debt-to-earnings ratios for UC undergraduate alumni at two and five years after graduation, Universitywide and by Campus, Undergraduate graduating cohorts 2000–2017, with student loan debt who are working in California
|
Debt-to-earnings 2 years after graduation
|
|
Debt-to-earnings 5 years after graduation
|
|
Campus
|
% of programs with <10% debt-to-income ratios
|
10th
|
Median
|
90th
|
|
% of programs <10% debt-to-income ratios
|
10th
|
Median
|
90th
|
|
Berkeley
|
95.3%
|
3.1%
|
5.5%
|
8.2%
|
|
100.0%
|
2.3%
|
3.9%
|
5.7%
|
|
Davis
|
97.7%
|
3.4%
|
5.6%
|
8.5%
|
|
100.0%
|
2.6%
|
3.8%
|
5.7%
|
|
Irvine
|
87.4%
|
4.4%
|
7.2%
|
11.0%
|
|
98.9%
|
3.0%
|
4.8%
|
6.6%
|
|
Los Angeles
|
94.5%
|
3.8%
|
6.7%
|
9.3%
|
|
99.1%
|
2.9%
|
4.4%
|
6.3%
|
|
Merced
|
83.3%
|
5.4%
|
8.5%
|
12.2%
|
|
100.0%
|
3.4%
|
5.1%
|
6.8%
|
|
Riverside
|
65.9%
|
5.6%
|
8.9%
|
12.8%
|
|
98.8%
|
3.8%
|
5.6%
|
7.8%
|
|
San Diego
|
94.4%
|
4.5%
|
6.8%
|
9.3%
|
|
100.0%
|
3.3%
|
4.6%
|
6.6%
|
|
Santa Barbara
|
92.6%
|
4.3%
|
7.3%
|
9.5%
|
|
100.0%
|
3.5%
|
4.9%
|
6.6%
|
|
Santa Cruz
|
88.7%
|
3.1%
|
5.5%
|
8.2%
|
|
100.0%
|
2.3%
|
3.9%
|
5.7%
|
|
UC
|
90.5%
|
4.3%
|
7.2%
|
10.1%
|
|
99.6%
|
3.0%
|
4.8%
|
6.9%
|
Source: AEO (CA Employment Development Department), student financial aid and degree data
Students who graduate from UC’s baccalaureate programs go on to achieve positive earnings trajectories and have manageable student loan repayment obligations. The benchmark used to evaluate manageability is the percentage of average earnings required to repay a student’s debt at graduation based upon a standard ten-year repayment plan at five percent interest. UC considers debt that requires between five percent and nine percent of a student’s postgraduate earnings to be manageable. Students may choose alternative repayment plans (e.g., income-based plans) based on their individual circumstances. These can increase debt manageability for students with high levels of debt and/or low income, but can result in higher interest costs over time.
About 91 percent of UC baccalaureate program graduates systemwide have a debt-to-earnings ratio of ten percent or less at two years after graduation and nearly all of the programs do at five years after graduation.
Some arts, humanities, and social science programs have debt ratios that exceed ten percent two years after graduation. This stems from a variety of factors, including the lower average earnings associated with industries in which these graduates tend to work. (See 3.3.3 for earnings by major and industry in Chapter 3.)
1 Under a standard ten-year repayment plan at five percent interest.