Goals
California’s Master Plan for Higher Education gives the University of California the responsibility of enrolling and preparing graduate academic and professional students to help meet the needs of California and the nation and to further the UC mission of teaching, research, and public service. Thus, reviving adequate support for the University of California is important, as its graduate education enterprise fuels California’s role as a national and international leader.
UC’s goals for graduate education are to offer outstanding degree programs, advance research, support undergraduate instruction, and prepare students to join a professional workforce or innovate on behalf of it. UC produces the leaders of the future — the teachers, artists, thinkers, innovators, scientists, inventors, doctors, lawyers, and nurses; and it creates an environment of exploration and discovery that stimulates innovation and invention. UC’s internationally renowned graduate education enterprise serves to drive California’s economy and its role as a global leader. UC graduate education allows California to grow, create jobs, drive industry, tackle unique challenges facing the state, and help improve the everyday lives of its inhabitants.
Types of graduate degrees
UC awards both graduate academic degrees and graduate professional degrees.
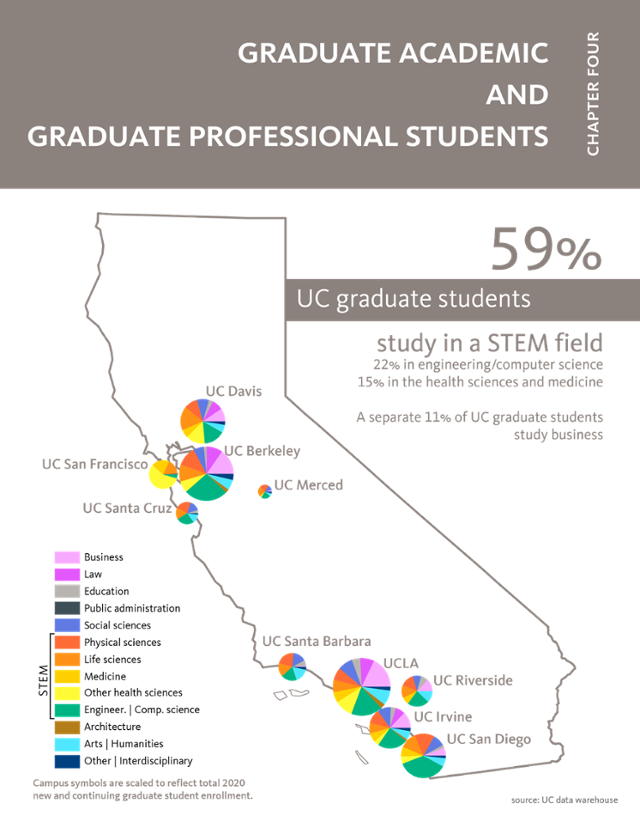
Graduate academic degrees — These include academic doctoral and academic master’s degrees in education, life sciences, physical sciences, social sciences, arts, humanities, and engineering/computer science. The largest proportion of graduate academic degrees awarded at UC is in the STEM fields — science, technology, engineering, and mathematics. From the 2016–17 to 2019–20 academic years, more than 70 percent of UC graduate academic degrees were awarded in STEM fields.
Graduate professional degrees — UC’s professional degrees include professional master’s and professional practice degrees in fields such as law, medicine, nursing, business, education, architecture, public policy, and the arts. The graduate professional category includes professional master’s degrees (e.g., M.B.A., M.Ed.) and professional practice degrees (e.g., J.D., M.D.). In the field of medicine, UC offers the nation’s largest instructional program in health care and health sciences.
The University maintains multiple funding models for its graduate professional programs. Many partially State-supported programs (e.g., M.B.A., law, medicine) assess professional degree supplemental tuition (PDST), which allows the professional schools to ensure their excellence, accessibility, and inclusiveness, and assists with affordability (by requiring return-to-aid for tuition revenue). Programs assessing PDST commit substantial resources to student financial support, including grants and scholarships. Since PDST began in 1994, both the number of professional degree programs that charge PDST and the amount charged have increased.
Other UC graduate professional programs, primarily master’s programs, follow a self-supporting funding model. The largest are business and management programs. These programs receive no State support and are funded entirely by revenues generated by the program and other non-State revenues. Self-supporting programs allow the University to serve additional students beyond those supported through State resources. They also fulfill higher education and workforce needs. Some self-supporting programs serve nontraditional populations such as full-time employees, mid-career professionals, and international students with specialized goals. Many programs are offered through an alternative mode of delivery, such as online or hybrid instruction, alternative scheduling, or at off-campus locations.
Graduate enrollment share
UC’s graduate education enterprise enrolls over 59,000 students, with doctoral students representing the largest number (28,600), and professional (23,800) and master’s (6,800) comprising the remainder. Despite its size, UC’s graduate education enterprise represents a smaller share of its total enrollment than that of its peers. Graduate students comprise 21 percent of total student enrollment at UC, which is lower than the proportion of graduate enrollment among other Association of American Universities public (27 percent) and private (56 percent) peer institutions. In addition, while the graduate share of UC’s total enrollment has remained relatively constant over the last decade at 21 percent, the doctoral enrollment percentage has declined. The graduate professional percentage has risen steadily (4.2.1). Despite these enrollment trends, UC research degree production is comparable to other public university competitors. For example, in number of research degrees produced and percentage of research degrees produced in comparison to other types of degrees, UC compares favorably to its competitors. While enrollment needs will vary by program, it is important that academic doctoral student enrollment be supported at sufficient levels to drive UC’s research enterprise and support faculty innovation.
UC is proposing a multi-year framework that seeks to improve degree attainment and produce 200,000 more degrees through 2030, in addition to the projected one million degrees. About 40,000 of these additional degrees would be at the graduate level.
Supporting diverse career paths and making research accessible
To promote and highlight the work of master’s and doctoral students across UC campuses, UC holds an annual research communication competition called UC Grad Slam. The event challenges its ten participants — the winners of each campus’s Grad Slam — to distill years of academic research into a three-minute presentation free of technical lingo. Grad Slam encourages students to communicate their research in a clear and compelling way to non-specialists — a skill that employers need and value. Campuses provide workshops and resources for students to develop this skill set. The contest also demonstrates to the public that UC research benefits their lives in both ordinary and quite extraordinary ways. While UC was unable to hold the 2020 installment of systemwide Grad Slam due to the coronavirus pandemic, Grad Slam returned in 2021 in a virtual format. UC Merced Applied Mathematics Ph.D. student, Shayna Bennett, was named systemwide champion for presenting her dissertation research, “A New Tool to Fight Invasive Species.”
UC graduate students also applied their research to make important contributions to the fight against COVID-19. One of the primary symptoms of COVID-19 is difficulty breathing, and approximately one percent of people who contract the virus require ventilators to push air in and out of the patient’s lungs and support their recovery. As COVID-19 became more widespread, many hospitals experienced acute shortages of ventilators to treat patients. Along with Drs. James Friend and Lonnie Petersen, UC San Diego graduate students developed simple, ready-to-use ventilators through 3-D printing technology — which is only one example of many where graduate students are addressing global concerns in real time.
Career Pathways Survey and UC Graduate Student Experience Survey (UCGSES)
In 2017, UC launched the Ph.D. Career Pathways Survey, which is a partnership between the University of California and the Council of Graduate Schools. The survey’s third phase was conducted in 2020, and its purpose is to better understand the career preparation and pathways of Ph.D. students and alumni. While the Council of Graduate Schools is specifically focused on humanities and STEM Ph.D.’s, the University of California is collecting data from doctoral students and alumni in all disciplines.
Results showed high levels of employment and satisfaction with UC Ph.D. programs. Ninety-two percent of respondents were working in a job for pay, 69 percent indicated they were working in a field closely related to their degree, and 54 percent were employed at a higher education institution. Eighty-eight percent of respondents stated that their Ph.D. training prepared them well for their current job, 76 percent stated that they would pursue a Ph.D. in the same field, and 80 percent indicated they would choose the same institution for their Ph.D. education if given the opportunity to choose again.
In 2021, UC launched the UC Graduate Student Experience Survey (UCGSES). This systemwide survey was developed based on the UC Graduate Well Being Survey, Ph.D. Career Pathways Survey, and UC campus graduate and professional student surveys. This survey will be administered every two years to solicit graduate and professional students’ opinions on a broad range of academic and co-curricular experiences, including instruction and training, advising, basic needs, and student services.
Equity and inclusion: Expanding academic pathways
A more diverse and inclusive community of scholars at all levels has been a longstanding goal for UC, but progress at the doctoral, postdoctoral, and faculty levels has been particularly slow. UC’s difficulties reflect challenges in both enrolling individuals from underrepresented groups in doctoral programs and in attracting and hiring them as postdoctoral scholars and faculty. Systemwide initiatives aimed at increasing the diversity of UC’s academic community include:
UC-Hispanic Serving Institutions Doctoral Diversity Initiative (UC-HSI DDI) — Launched in fall 2019, the UC-HSI DDI aims to improve faculty diversity by enhancing pathways to the professoriate for underrepresented students from California Hispanic Serving Institutions (HSIs). The UC-HSI DDI includes two components: 1) competitive grant awards to UC faculty/faculty administrators to support short-term and long-term programs/projects to enhance and expand pathways to the professoriate for underrepresented students; and 2) funding to directly support graduate student preparation for the professoriate. Funding includes resources to support a limited number of Ph.D. students, named UC President’s Pre-Professoriate Fellows (UC PPPF), who are California HSI alumni and have advanced to candidacy at UC. The UC President’s Pre-Professoriate Fellowship fosters their interest in and preparation for the professoriate. Additional professional development support for underrepresented Ph.D. students is provided to encourage and help equip them to consider careers in the professoriate. Another goal of the UC-HSI DDI is to enhance the climate of academic programs through interventions, incentives and efforts that foster an academic culture of inclusion and equity — especially for faculty and students from underrepresented communities.
The inaugural cycle of the UC-HSI DDI received great interest and an impressive response for this systemwide competition. In 2019–-20, the Initiative received 31 proposals, totaling a funding request of nearly $7 million. Six of 31 grants were awarded to the Davis, Irvine, Merced, Riverside and San Diego campuses. Three grants focus on STEM fields, one on social sciences, and two are interdisciplinary; together, these projects partner with 24 HSIs, and involve over 350 students. Despite the COVID-19 pandemic, grantees continue to implement their proposed efforts to support the UC-HSI DDI using remote strategies and developing web-based resources to support students and faculty dedicated to accessing and improving pathways to the professoriate for URM scholars. The Initiative also supported 29 UC President’s Pre-Professoriate Fellows in 2020.
UC LEADS — The University of California Leadership Excellence through Advanced DegreeS (UC LEADS) program prepares promising UC undergraduate students for advanced education in science, technology, engineering, and mathematics (STEM) fields. The program prepares underrepresented UC undergraduate students for doctoral education opportunities at a UC campus. From its inception in 2000, 1,107 scholars participated in UC LEADS, celebrating 20 years of programmatic effort and yielding significant outcomes Ninety-nine percent of UC LEADS scholars graduate with their undergraduate degree, 76 percent pursue graduate school or have already earned degrees in a master’s or doctoral program, and 47 percent of UC LEADS scholars attended UC for graduate school. Given the importance of gender and ethnic equity within STEM-based doctoral programs, it is notable that 46 percent are women, 54 percent are first-generation college students, and 48 percent are from underrepresented minority groups. Thirty-seven UC LEADS alumni are now working as tenure track faculty, including seven within the UC system, while another 12 are employed in non-tenure track faculty positions and 11 hold other academic career positions. Others work around the world as industry and government scientists, teachers, medical doctors, and entrepreneurs.
UC-HBCU Initiative — The University of California-Historically Black Colleges and Universities (UC-HBCU) Initiative was established to increase the number of African Americans completing Ph.D.’s at UC by investing in relationships between UC faculty and HBCUs. The program has raised UC’s profile within the HBCU community and facilitated faculty research collaborations in addition to enrolling and retaining students. UC has hosted 644 UC-HBCU summer interns across nine campuses since it first hosted students in summer 2012. UC currently has 69 Ph.D. fellows enrolled at eight UC campuses (Berkeley, Davis, Irvine, UCLA, Santa Barbara, Santa Cruz, San Diego, and Riverside) as a direct result of the Initiative: 77 percent in STEM fields, and 23 percent in Social Sciences/Humanities. Ten Ph.D. and 12 master’s students have graduated.
University of California President’s Postdoctoral Fellowship Program (PPFP) — The PPFP was established to encourage outstanding women and minority Ph.D. recipients to pursue academic careers at UC. The program offers postdoctoral research fellowships, professional development, and faculty mentoring to outstanding scholars in all fields whose research, teaching, and service will contribute to diversity and equal opportunity at UC. More information about the PPFP is presented in Chapters 5.
Looking ahead
The University continues to develop programs to enhance the graduate student experience. UC’s overall excellence rests on the strength and scope of its graduate programs. Unlike undergraduate enrollment planning, which is based on California’s Master Plan, graduate enrollment planning includes the assessment of state and national needs, faculty expertise, program quality (which includes international competitiveness), and financial support. In early 2018, Provost Michael Brown convened a workgroup on graduate education, which examined the current condition and needs of UC’s academic doctoral education enterprise. The workgroup, a subcommittee of the Academic Planning Council, examined key areas of importance within graduate education such as providing multi-year guaranteed funding packages upon admission, improving student stipend amounts, prioritizing mental health and well-being, improving diversity, equity and inclusion, and enhancing professional development support. The workgroup issued its final report in 2019, urgently stressing that without adequate support for doctoral education, UC risks its excellence and continued role as a key contributor to California’s economy and a global leader in research.
The report highlights long-term inadequacies of UC graduate student support, including the negative impact of Ph.D. students not being offered multi-year packages upon admission. This issue continues to be challenging. However, some progress is being made. Currently, UC Irvine, UC Santa Cruz, and UC San Diego guarantee five years of funding support for academic doctoral admits. UC Berkeley has committed to offering this support in the near future and UC Davis has expressed its commitment to work toward the goal of offering such support. The remaining campuses continue to examine this matter. These commitments let students know they will have guaranteed funding support (in various forms, including fellowship, graduate student researcher appointment, and/or teaching assistantship) for five years or for the normative time to complete their degree (if less than five years). The assurance that they will be funded each year can help reduce some of the financial stress students face. In an effort to help mitigate financial concerns and better support doctoral students, several campuses are also offering various forms of cost-of-living or housing supplements.
As part of the UC 2030 planning goals to diversify pathways to the professoriate, UC leadership has expressed interest in examining opportunities to enhance the undergraduate to graduate to professoriate pipeline. Enhanced effort in this area is expected in the future.
For more information)
Universitywide graduate academic applications have increased substantially since 2011, while admits and new enrollments have remained relatively flat.
4.1.1 Graduate academic applications, admits, and new enrollees by degree program, Universitywide, Fall 2011 to Fall 2020
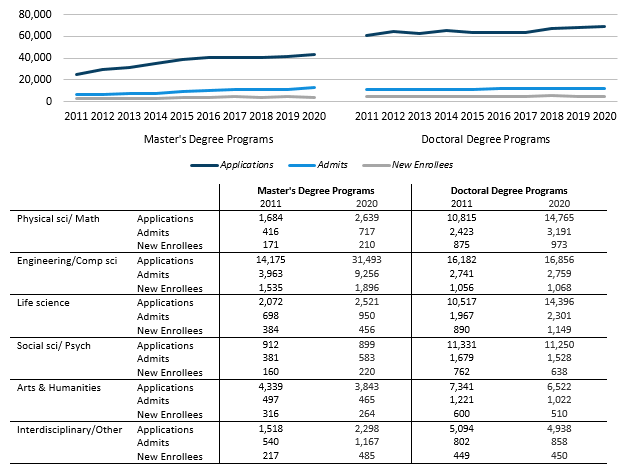
Source: UC Corporate Student System. A small number of professional doctoral programs are also included in these data. Universitywide
applications and admits are duplicated in this report since students often apply to more than one campus.
The demand for UC academic master’s and doctoral programs has increased since 2011. Applications for admission grew from 85,000 in 2011 to 112,400 in 2020. Nearly all of this increased demand has come from prospective international students, with international applications growing from 40,300 to 66,200. Engineering and computer science programs have higher demand from international students than do other disciplines. Recent survey data compiled by the Council of Graduate Schools show a similar nationwide trend of growth, with engineering as the most popular field.1
Since 2011, admits increased from 17,300 to 24,700 in 2020, and new enrollments increased from 7,400 to 8,300. Though applications are now predominantly (59 percent) from international students, both admits and new enrollments of domestic students exceed those of international students.
1 cgsnet.org/ckfinder/userfiles/files/2017_International_Survey_Report_Final.pdf
Since 2011, the number and share of graduate academic admissions have significantly increased for international students.
4.1.2 Graduate academic applications, admits, and new enrollees by race/ethnicity and discipline, Universitywide, Fall 2011 and 2020
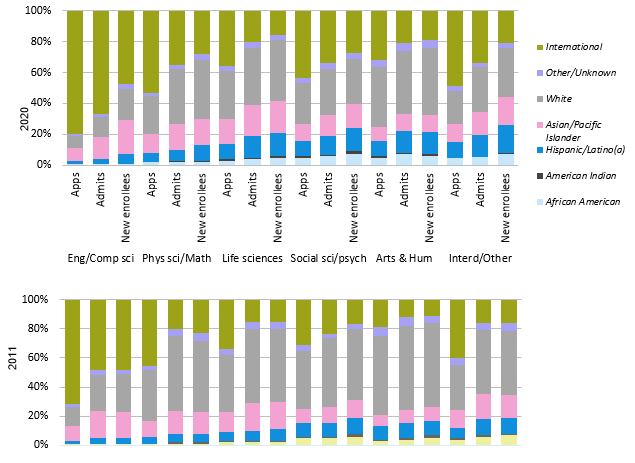
Source: UC Data Warehouse
International students represent the majority of applicants, admits, and new enrollees in engineering and computer science graduate programs. The share of international students in all other disciplines also increased between 2011 and 2020. Social science and humanities programs have the highest shares of enrollment among underrepresented minority students, and those shares increased between 2011 and 2020.
Given recent events, including political decisions affecting visas to the COVID-19 pandemic, UC and the national higher education community are examining the impact on international students and UC degree programs.
Graduate enrollment, as a share of UC’s total undergraduate and graduate enrollment, has remained relatively steady since 2001.
4.2.1 Graduate enrollment share of total, Universitywide, Fall 2001 to Fall 2020
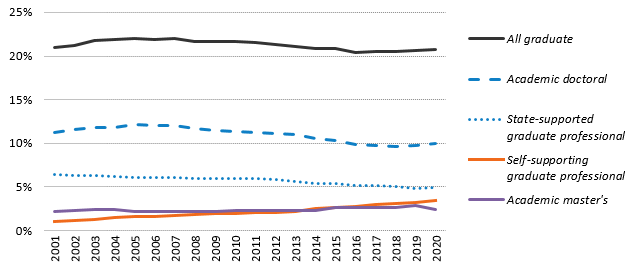
Source: UC Corporate Student System. Academic master’s students include post-baccalaureate, teaching-credential students. Graduate professional includes professional master’s (e.g., M.B.A., M.Ed.) and professional practice (e.g., J.D., M.D.) degrees.1
With 21 percent graduate enrollment in 2020, including health science students, UC was lower than the average for non-UC AAU1 public institutions, at 27 percent, and the average for AAU private institutions, at 56 percent.
In fall 2020, the proportion of academic doctoral students varied across UC’s general campuses, from eight percent at Riverside, Santa Cruz, and Merced to 12 percent at Berkeley. At San Francisco, an exclusively graduate health-sciences campus, academic doctoral students made up 29 percent of fall 2020 enrollments. Since 2010, the share of academic doctoral students has declined at most campuses due to more rapid growth in the undergraduate, master’s, and professional populations.
UC awards 23 percent of California’s graduate academic master’s degrees, 62 percent of its academic doctoral degrees, and 21 percent of its graduate professional practice degrees.
| Percent of students who are academic doctoral |
|
Fall 2010 |
Fall 2020 |
| San Francisco |
26% |
29% |
| Berkeley |
16% |
12% |
| Los Angeles |
12% |
11% |
| Davis |
11% |
10% |
| Santa Barbara |
11% |
10% |
| San Diego |
10% |
9% |
| Riverside |
9% |
8% |
| Irvine |
10% |
9% |
| Santa Cruz |
7% |
8% |
| Merced |
5% |
8% |
| Universitywide |
11% |
10% |
|
(26,250) |
(28,605) |
Source: UC Data Warehouse
1A list of the institutions in the AAU comparison groups can be found in the data glossary.
UC net stipends remain below competitive offers, although the gap decreased substantially between 2013 and 2020.
4.2.2 Average net stipend offered to graduate academic doctoral students admitted to UC compared with their first-choice non-UC schools, Universitywide, 2013, 2017, and 2020
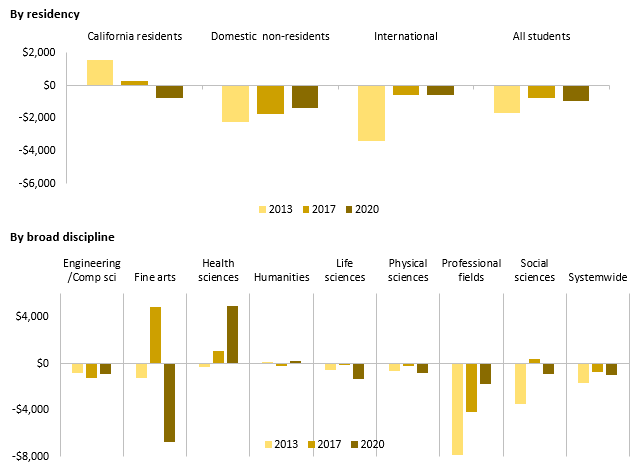
Source: UC Graduate Student Support Survey. Graduate academic professional doctoral programs include EdD, D.Env., DrPH., D.P.T. and D.N.S.
Doctoral students are crucial to a university’s research enterprise and instructional programs. To attract the most highly qualified applicants, universities offer aid packages that include the cost of tuition and stipends. Net stipend is the amount of aid that students have for living expenses after tuition and fees are paid. It does not include loans that the student may be offered. The “stipend gap” varies by discipline, as shown in the chart above. Since 2013, UC has made considerable progress in closing the net stipend gap with competing institutions, reducing it from $1,600 to about $900 in 2020. However, a considerable gap remains between UC’s average net stipend and growing living costs in California. This is a significant problem with negative implications for UC research and graduate education. It poses challenges in recruitment of students, and for enrolled students, inhibits their ability to adequately meet basic living needs. California’s high cost of living is also detrimental to UC faculty recruitment and retention.
More than half of UC doctoral students graduate without debt. Doctoral students in the physical and life sciences have seen smaller increases in debt since 2005-06, and graduate with less average loan debt than those in the social sciences and arts and humanities.
4.2.3 Academic doctoral students’ graduate debt at graduation, by discipline, domestic students, Universitywide, Graduating classes of 2005-06 to 2019-20 (every two years)
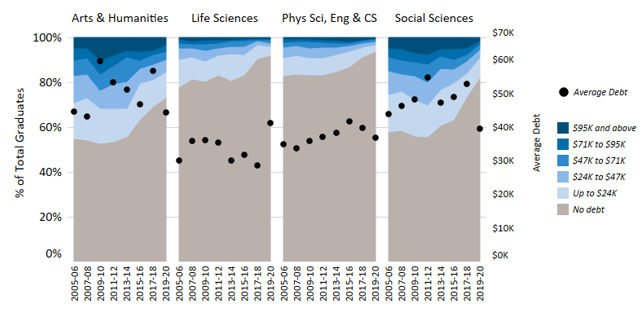
Source: Corporate Student System1
Depending on the field of study, between 73 percent (arts and humanities) and 93 percent (physical and life sciences) of UC doctoral students take on no additional debt during graduate school.
Several factors account for the difference in debt burden between doctoral students in the physical and life sciences and those in other disciplines. Physical and life science students are more likely to be supported by research grants, which facilitates
their ability to spend more time on research, rather than carrying consistent teaching assistant responsibilities, as is the more common funding model in arts and humanities and some social sciences. In addition, physical and life science programs take less time on average to complete than do programs in the social sciences or arts and humanities (partly due to the noted funding model differences).
1Debt categories are inflation-adjusted in 2019 dollars using CA CPI-W. “Other” includes interdisciplinary and professional fields. Life sciences include health sciences.
Graduates with the highest debt levels come from professional schools that charge higher supplemental tuition.
4.2.4 Graduate professional degree student debt at graduation, by discipline, domestic students, Universitywide, Graduating classes of 2005-06 to 2019-20 (every two years)
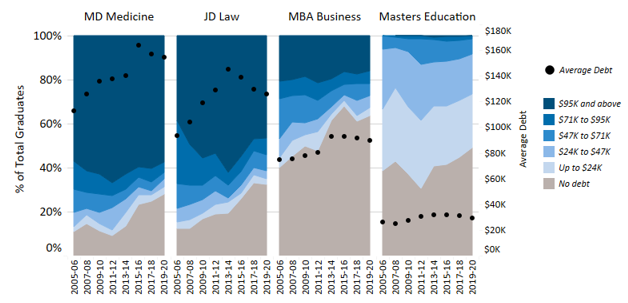
Source: UC Corporate Student System1
On average, 48 percent of the aid awarded to graduate professional degree students comes in the form of loans rather than fellowships or grants. By comparison, loans constitute three percent of the aid awarded to graduate academic students. Graduate funding models require greater reliance on loans for professional degree students, as their programs are of shorter duration, and many fields offer potentially higher incomes after graduation.
Most graduate professional degree students finance part of their education by borrowing. The increases since 2005–06 in average inflation-adjusted debt levels of graduating professional degree students vary considerably. Increases in graduate debt result from a combination of factors, including steady growth in tuition, cost of living increases, and greater student reliance on federal student loan programs.
1 Average debt is among graduates with debt. Debt categories are inflation-adjusted in 2019 dollars using CA CPI-W.
Like other major research universities, UC awards a high proportion of graduate academic degrees in science, technology, engineering, and mathematics (STEM) fields.
4.3.1 Graduate academic degrees awarded by discipline, UC and AAU private and public comparison institutions, Number of degrees grouped in 3-year intervals: 2007-08 to 2009-10, 2010-11 to 2012-13, 2013-14 to 2015-16, 2016-17 to 2018-19; campus-level data for 2016-17 to 2018-19.
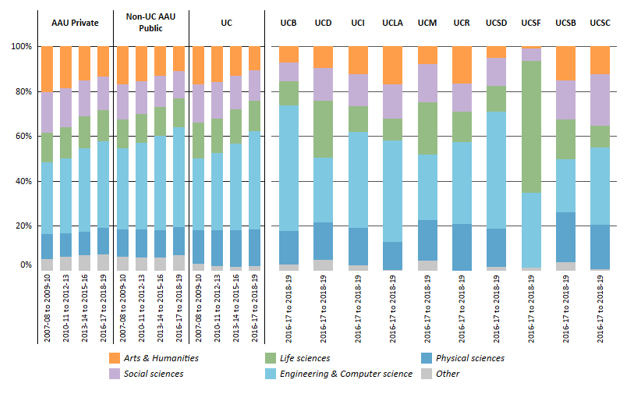
Source: IPEDS1
UC graduates have had major impacts on the nation and the world — creating much of California’s biotechnology and computer industries, developing research breakthroughs that have led to major medical advances, shaping ideas about our world and culture, creating the economic and social infrastructure of our communities, and assuming political leadership in California and the nation.
UC’s graduate STEM programs reflect the predominant industries in California’s economy. In addition to leading all California institutions in the production of engineering and computer science degrees, UC far outpaces them in the production of degrees in the biological sciences — key to driving the growth of California’s biotechnology sector.
Since 2007–08, the number of graduate academic degrees awarded at UC grew by 43 percent, compared to 59 percent at the group of AAU private institutions and 38 percent for the group of non-UC AAU public institutions.
1"Other" includes interdisciplinary and academic degrees in otherwise professional fields, such as architecture, communications, and public administration.
UC’s doctoral completion rate increased in nearly every field over the two most recent cohorts studied.
4.3.2 Doctoral completion rates after ten years, by broad field, Universitywide, Fall 2002-2004, 2005–2007, and 2008–2010 entry cohorts
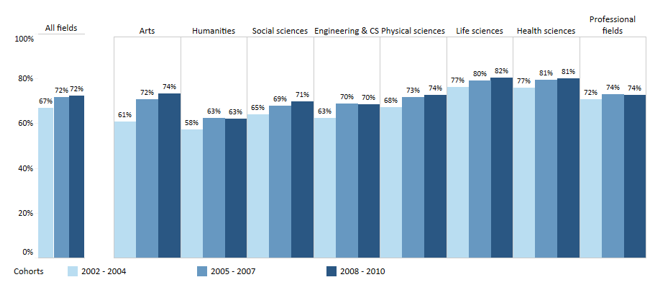
Source: UC Corporate Student System
The Universitywide ten-year doctoral completion rate across all fields for the fall 2008–10 entering cohorts was 72 percent. This is an increase from the 67 percent completion rate reported for the 2002–04 cohort. Among broad disciplines, life sciences and health sciences continue to have the highest completion rates. Engineering and computer sciences, social sciences, and humanities showed the lowest rates, owing to the longer normative time in those fields and different financial support models, although both experienced an increase compared to previous cohorts.
The overall improvement in ten-year completion rates may be attributed to at least two factors. First, student demographics have shifted to include a larger percentage of international students, who, as a group, have a higher ten-year completion rate than the overall cohort’s rate. (A variety of factors influence this difference, including different tuition rates for international students, which can drive motivation/expectation to complete programs sooner rather than later.) Second, shifts over time in enrollment toward disciplines with higher completion rates (STEM fields) affect the overall ten-year completion rate.
The Doctoral Completion Rates dashboard is available at: universityofcalifornia.edu/infocenter/doctoral-rates
UC’s median ten-year time to doctorate by ethnicity and gender compares well with AAU institutions.
4.3.3 Median ten-year time-to-doctorate, by ethnicity and gender, Universitywide, AAU public and AAU private comparison institutions, 2015 to 2017 exit cohort
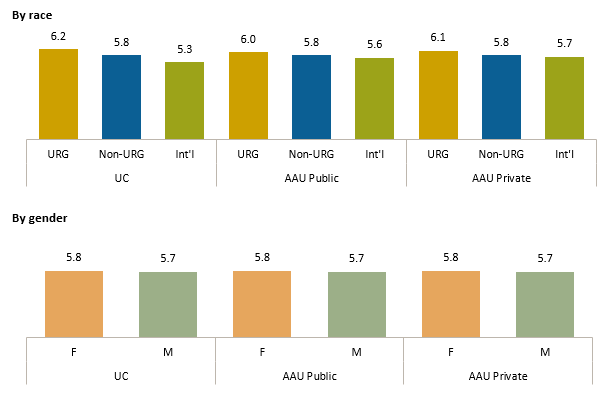
Source: Survey of Earned Doctorates, National Opinion Research Center
The median number of years required to complete a doctoral degree at UC (elapsed time-to-doctorate) is comparable to that at other major research universities. Men and women complete the doctorate in about the same amount of time at UC. Students from underrepresented groups (URG) have longer time-to-doctorate at UC and comparison institutions, whereas international students required substantially less time to complete the doctorate.
It should be noted while UC’s URG completion rate is comparable to that of non-UCs, the gap between UC URGs and non-URGs is the largest among the comparison groups. At this point, it is a small difference but worth tracking to be sure it does not increase and better yet to see if it is decreased/eliminated.
The Time to Doctorate dashboard is available at: universityofcalifornia.edu/infocenter/time-to-doctorate
UC’s median ten-year time-to-doctorate varies by ethnicity, gender, and discipline.
4.3.4 Median ten-year time-to-doctorate, by ethnicity and gender, by discipline, Universitywide, 2017 through 2019 exit cohort
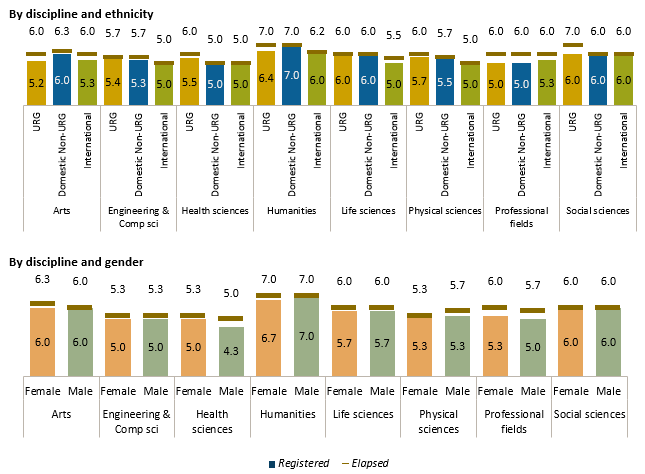
Source: UCOP Corporate Student System
Three out of eight UC disciplines (engineering and computer science, health sciences, and physical sciences) graduate students from underrepresented groups (URG) with longer registered time-to-doctorate (RTD) than non-URG and international students. Arts and humanities fields graduate URG students have slightly shorter RTD than non-URG students. For elapsed time-to-doctorate (ETD), the health sciences, physical sciences, and social sciences graduate URG students with longer ETD than non-URG and international students.
International students have shorter ETD and RTD in humanities, life science, and physical science disciplines.
Men and women generally have comparable time-to-doctorate, with exceptions in health sciences and professional fields, where women have a longer ETD and RTD; the arts, where women have a longer ETD; and the humanities, where men have longer RTD.
The Time to Doctorate dashboard is available at: universityofcalifornia.edu/infocenter/time-to-doctorate
More than half of UC’s academic doctoral degree recipients plan to stay in California, a greater share than those who attended high school or college in California.
4.3.5 Origin and planned destination of UC academic doctoral degree recipients, Universitywide, 2008–09 to 2017–18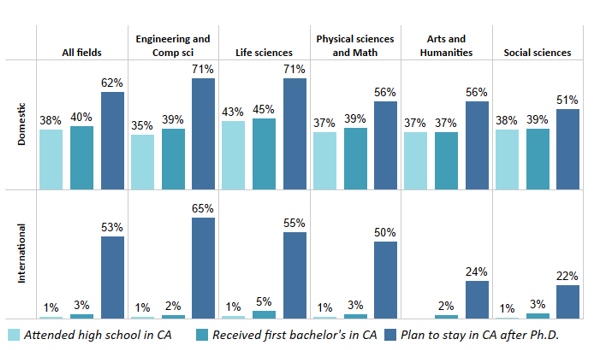
Source: Survey of Earned Doctorates.
The most recent data for UC’s doctoral degree recipients, based on those graduating between 2008–09 and 2017–18, show that over half plan to stay in California. Sixty-two percent of domestic doctoral degree recipients intend to stay, though only 40 percent of this cohort received their bachelor’s degrees in California, and only 38 percent attended high school in California. This proportion is higher in engineering, computer science, and life sciences fields, indicating that UC graduates are an important force in California’s robust economy in these areas.
Though a negligible share of UC’s international (not a U.S. citizen nor permanent resident) doctoral recipients attended high school or college in California, half intend to stay after graduation.
The Survey of Earned Doctorates (SED) is conducted for all individuals receiving a research doctoral degree. It is sponsored by the National Science Foundation, National Institutes of Health, U.S. Department of Education, U.S. Department of Agriculture, National Endowment for the Humanities, and NASA.
Half of UC academic doctoral and master’s graduates who stay in California work in higher education.
4.3.6 Industry of employment of UC graduate academic students in CA, by year after graduation, Universitywide, 2000 to 2017 graduating cohorts
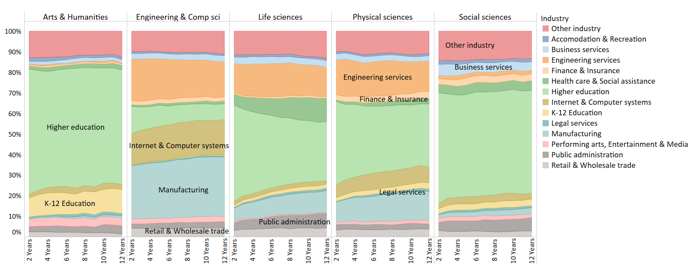
Source: California Employment Development Department and UC Corporate Student System1
Graduates of UC academic doctoral and master’s degree programs go on to work in a broad range of industries in California. UC’s engineering and computer science programs supply workers to the state’s high-skilled and high-tech industries. Since 2000, over 26,000 graduates of these programs have entered the California workforce, with 34 percent working in the manufacturing sector and 27 percent working in engineering services. Another 24 percent go on to work in the state’s internet and computer services industry. About 18 percent of engineering and computer science graduates go on to teaching and research positions in the state’s college and university systems.
More than 56,000 graduates of UC academic doctoral and master’s degree programs in fields other than engineering/computer science have entered the California workforce since 2000. Over half of them (50 percent) have gone on to work in the state’s higher education workforce, which includes all of the two-year and four-year colleges, both public and private. This highlights the critical role of UC’s graduate academic programs in producing the cadre of faculty who teach California’s future college-educated workforce and conduct research that advances the state and national economies.
The contributions of UC academic doctoral and master’s graduates to the state workforce go beyond higher education. About 16 percent of the employed graduates of UC physical sciences and life sciences programs work in the state’s manufacturing sector, while another 22 percent work in the engineering industry. This shows that the skills gained in UC academic doctoral and master’s programs are both applicable and relevant to key high-tech industries.
The job market for doctoral and master’s degree recipients is nationwide, and those who leave California are not tracked in this data source.
1 Includes very small numbers of graduate professional students, who do not affect the overall picture.
Like other major research universities, UC awards a high proportion of professional degrees in business.
4.4.1 Graduate professional degrees awarded by discipline, UC and AAU private and public comparison institutions, Number of degrees grouped in 3-year intervals: 2006–07 to 2008-09, 2009–10 to 2011–12, 2012–13 to 2014–15, 2015–16 to 2017–18; campus-level data for 2016–17 to 2018–19.
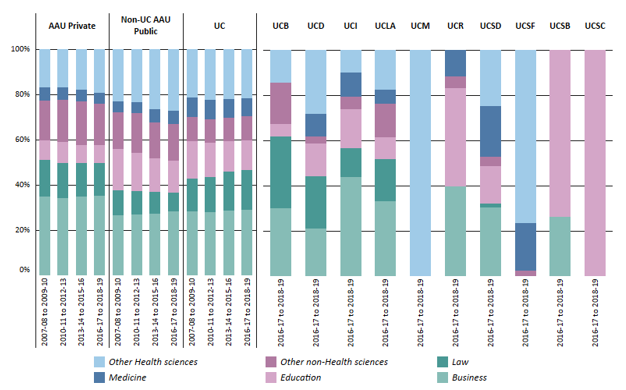
Source: IPEDS1
The proportion of professional degrees awarded by UC is comparable to AAU private and public institutions, with the greatest proportion of degrees awarded in business. The number and size of graduate professional degree programs vary by campus, with UCLA awarding the greatest number of professional degrees.
UC has also grown in the proportion of law degrees, in part due to the School of Law at UC Irvine, which opened in 2009.
Since 2003, UC has opened new professional schools in several other areas, including the Rady School of Management at UC San Diego in 2003, the School of Medicine at UC Riverside in 2013, the Sue and Bill Gross School of Nursing at UC Irvine in 2017, and the School of Public Health at UC San Diego in 2019.
1 UC Merced added a professional master’s program in public health in 2017. “Other” includes disciplines such as public administration, architecture, communications, and library science.
UC professional programs prepare graduates for careers related to their field of study.
4.4.2 Industry of employment of UC graduate professional students in California, by year after graduation, Universitywide, 2000 to 2017 graduating cohorts
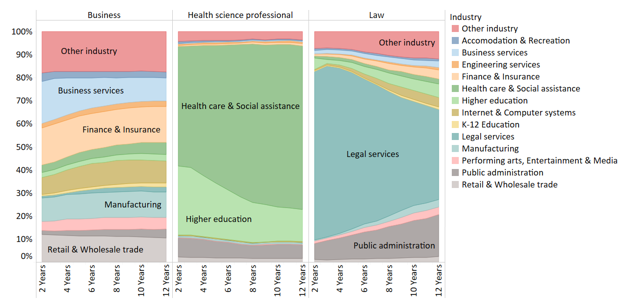
Source: California Employment Development Department and UC Corporate Student System1
Graduates of UC Master of Business Administration (MBA) programs contribute significantly to the state’s high-skilled and high-tech industries. The 25,000 UC MBA graduates who have entered the California workforce since 2000 have worked in a wide array of industries, including manufacturing (26 percent), finance and insurance (20 percent), retail and wholesale trade (19 percent), and internet and computer systems (22 percent).
Over 15,000 graduates of UC health science professional practice programs (e.g., M.D., D.D.S., Pharm.D.) have gone on to work in California since 2000. The majority of these graduates (72 percent) go on to work in the state’s health care and social assistance sector. This highlights UC’s role, per the Master Plan, as the state’s sole public provider of many health science professional practice degrees and validates UC’s success in fulfilling that role. UC health science graduates also play key roles in other areas of public service in the state, including 41 percent who go on to work in the state’s higher education system and 18 percent who work in state government at some point after receiving their degrees.
UC law school graduates go on to work in two main areas — legal services and government. Of the 12,000 UC law school graduates who have worked in California since 2000, about 79 percent eventually find positions in the legal services industry. Another 17 percent go on to work in the public sector as government prosecutors and public defenders, and in other public agency roles. A large percentage of law school graduates start off in legal services initially after receiving their degree (73 percent), but by ten years after graduation this percentage has fallen to about 45 percent. The percent of UC law school graduates in government rises from seven percent to 16 percent over the same period.
1 Includes very small numbers of graduate academic students (e.g., Ph.D. business), which do not affect the overall picture.