Goals
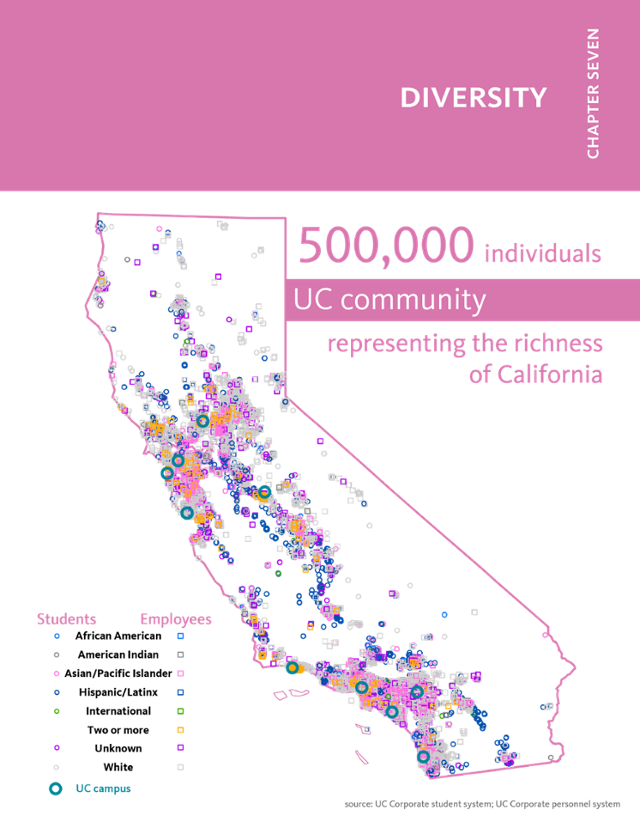
The University of California strives to create diverse, equitable, and inclusive communities for students, faculty, and staff. The University supports initiatives that increase the representation of historically underrepresented populations and foster inclusive living, learning, and working environments.
The University’s diversity goals are established in Regents Policy 4440: University of California Diversity Statement, which states, in part:
- Because the core mission of the University of California is to serve the interests of the State of California, it must seek to achieve diversity among its student bodies and among its employees.
- The State of California has a compelling interest in making sure that people from all backgrounds perceive that access to the University is possible for talented students, staff, and faculty from all groups.
- Therefore, the University of California renews its commitment to the full realization of its historic promise to recognize and nurture merit, talent, and achievement by supporting diversity and equal opportunity in its education, services, and administration, as well as research and creative activity.
The public health, economic, and social crises of the 2020–21 year tested the University’s ability to meet these goals. In addition to reviewing diversity and equity gains and gaps, this introduction includes student survey information about how the COVID-19 pandemic and the shift to remote learning impacted diverse university populations.
Findings
UC is making progress in several key areas related to diversity, equity, and inclusion. These include:
- Increases in the percentage of Underrepresented Group (URG) undergraduates admitted and/or enrolled based on K–12 pipeline.
- Increases in the percentage of First-Generation undergraduate enrollment and persistence.
- Increases in the percentage of URG graduate student enrollment and persistence.
- Increases in the percentage of URG faculty.
- Increase in the percentage of URG staff at campuses/locations and University of California Health.
At the same time, there are challenges and areas in which progress needs to be made. These include:
- Enrollment rates are low for African American and American Indian undergraduates, compared to the actual admission rate.
- Undergraduate African American students are less likely than other ethnic groups to agree that they are respected on campus.
- A graduation gap persists between URG undergraduates and White and Asian American undergraduates (presented in Chapter 3 of this report).
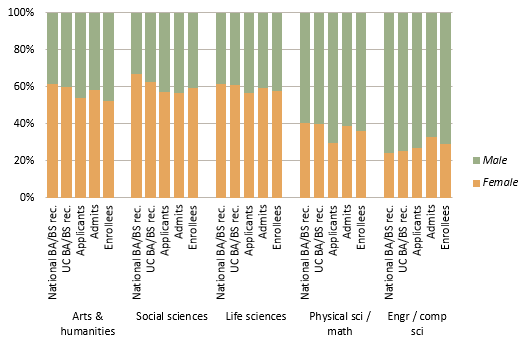
- The proportion of women and URG faculty is low, compared to availability pools in most disciplines (presented in Chapter 5).
- Senior Management (SMG) ranks are lacking in racial/ethnic diversity, compared to entry-level and professional staff ranks at UC.
Evaluating Diversity
UC evaluates its diversity outcomes in a variety of ways: current demographic characteristics and trends of its students, faculty, and staff; analysis of the academic pipeline from entry to exit; and survey data that reveal perceptions of campus climate, experiences of campus life, and remote learning during the COVID-19 pandemic.
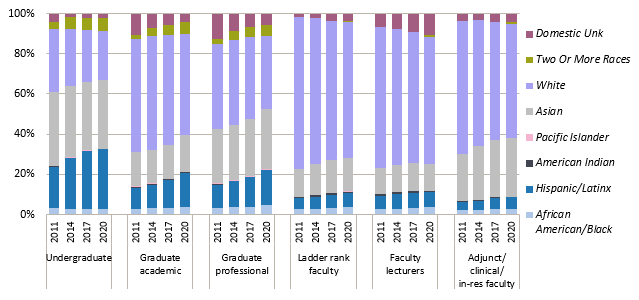
Chapters 1 through 6 present an overview of trends for undergraduate, graduate academic and graduate professional students, faculty, and staff. This feeds into a holistic analysis of University diversity, equity, and inclusion outcomes using the demographic characteristics of race/ethnicity, gender, first-generation college-going status, and international student status.
Pipeline
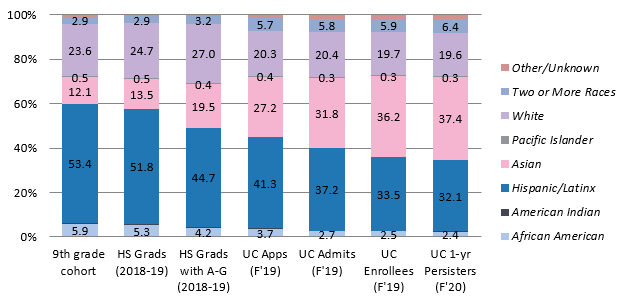
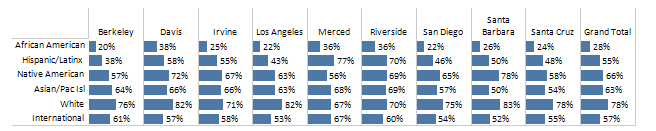
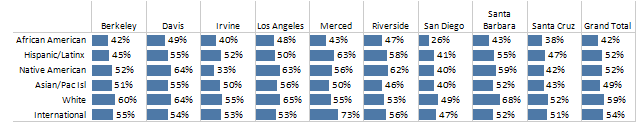
UC diversity outcomes are also assessed by examining the various steps along the academic pipeline. In the undergraduate pipeline from high school graduation to the end of the first year at UC, about six in ten California public high school twelfth-graders come from historically underrepresented groups. However, only less than four in ten of these twelfth-graders who enrolled in UC and persisted past their first year came from underrepresented ethnic groups. This is a strong indication that UC is not retaining the diversity of its students enrolled from California public high schools equitably after the first-year college experience.
The University of California’s multi-year framework — UC 2030 — focuses on expanding the pipeline to and within the University. For example, one part of eliminating timely graduation gaps for underrepresented groups is that a greater proportion will go on to graduate school, and one of the goals of growing graduate enrollment is to increase spaces for these students. UC’s increasing diversity of doctoral students will expand the availability pool of potential faculty hires, supporting efforts to diversify the professoriate.
Surveying Students about Diversity on Campus
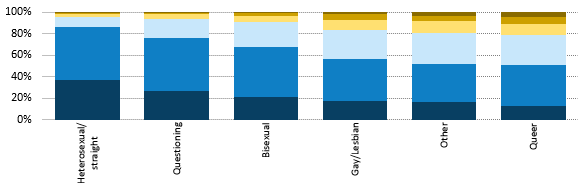
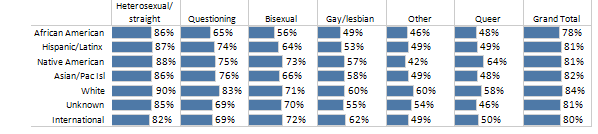
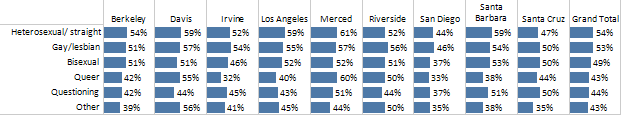
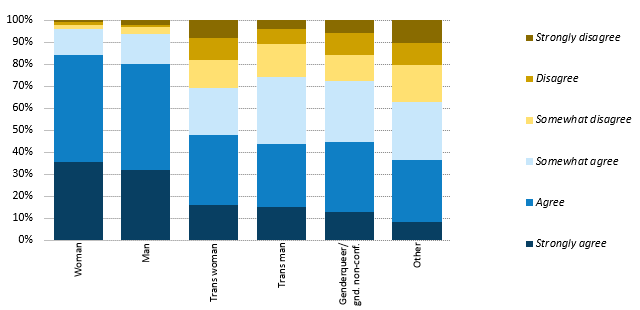
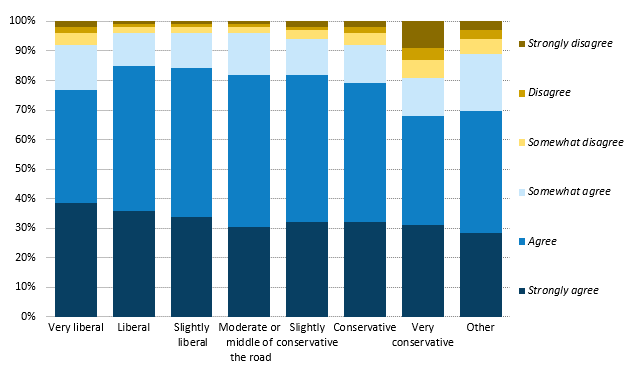
This chapter presents responses to the UC Undergraduate Experience Survey (UCUES), administered every two years to all undergraduates. The University’s goal is to have all its students feel respected on campus, regardless of race/ethnicity, nationality, religious affiliation, gender identity, gender expression, sexual orientation, or political beliefs.
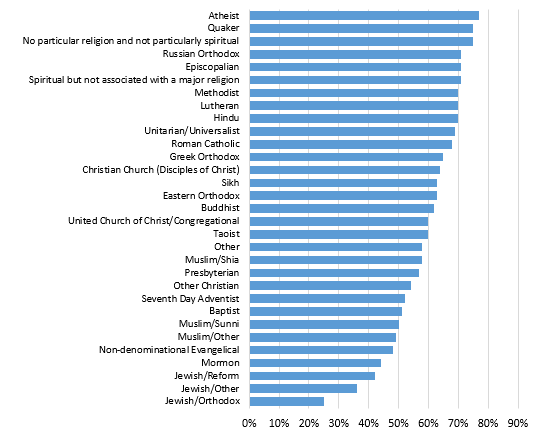
UCUES data show most undergraduates feel students of their race/ethnicity are respected on campus, but the proportion of African American respondents sharing this perspective is lower than other groups. Among religious identifications, Muslim and Jewish students are less likely to feel respected. LGBTQ+ students are also less likely to feel respected, as are students identifying as politically conservative.
Impact of COVID-19 on diverse student populations
Spring 2020 UCUES results showed 64 percent of undergraduates responding had high confidence (somewhat to very high) about using tools for remote learning, with slightly less confidence for first-generation, African American, and Hispanic/Latinx students. First-generation students from underrepresented populations were more likely to lack appropriate equipment and study spaces and to have greater family responsibilities due to COVID-19. With the COVID-19 pandemic, many students returned home. First-generation, Pell Grant recipients, and underrepresented students were less likely to have both adequate access to the internet and appropriate study space, making remote instruction a greater challenge when compared to peers. Thirty-five percent of all undergraduates were very concerned about having access to an appropriate study space, but it was at least ten points higher for first-generation, Pell Grant recipients, and underrepresented students.
UC campuses attempted to assess and meet the technology needs of students by providing laptops and internet hotspots. For example, UC Berkeley conducted a student technology survey to estimate the funds needed to purchase laptops in its Student Technology Equity Program (STEP). Other UC campuses used a range of outreach efforts — communications with deans and department chairs, student service and advising units, and prompts on campus learning management systems — to identify students who needed technology support.
Looking Forward — Diversity Initiatives
UC has made considerable investments in 2020 and 2021 to diversify the faculty, staff, and student body. It has sustained support for programs that promote the recruitment and retention of underrepresented faculty populations; expanded implicit bias training opportunities for student leaders, faculty, staff, and senior administrators; enhanced university information systems and operational processes to more fully recognize historically underserved populations; and rolled out initiatives designed to transform specific campuses and locations to be anti-racist and Black-thriving places to work and learn.
Advancing Faculty Diversity (AFD) — The State of California awarded UC a total of $8.5 million in one-time funds for four fiscal years, from 2016–17 to 2019–20, to develop an innovative and focused program to increase faculty diversity at UC. The Advancing Faculty Diversity program awards these funds on a competitive basis to campus units implementing new measurable interventions in the faculty recruitment process. Some of the successful interventions that correlate with hiring diverse faculty include the use of contributions to diversity statements early in the evaluation process; targeting potential faculty earlier in their careers through support for postdoctoral work; outreach by faculty to actively recruit candidates; revised evaluation practices, including the use of rubrics to guide decision-making; strong leadership and sustained and strategic involvement from unit leaders; introducing new voices, including students, in the recruitment and evaluation process; building of new faculty, equity, and inclusion data dashboards; research on and support for pathways to faculty leadership positions; and examinations of whether service loads differ by gender or race/ethnicity. Since 2019–20, UCOP committed an additional $3 million per year in ongoing funds to support additional projects in faculty recruitment; improve climate and retention to pilot innovative recruitment practices; create academic climates to support UC’s diverse student body and meaningfully engage faculty throughout their UC careers. Since its inception, a total of forty recruitment and improved climate and retention projects have been funded through the AFD program’s competitive process, with all ten campuses receiving at least one award.
President’s Postdoctoral Fellowship Program (PPFP) — Established in 1984, the program recruits top scholars who are committed to underserved and minority communities to pursue faculty careers at UC. Between 2016–17 and 2020–21, 112 fellows were hired as UC ladder-rank faculty at all ten UC campuses. In addition, more than 20 fellows have been successfully recruited for UC faculty positions that will begin in 2021–22, with 19 others still under consideration. Through Presidential support, UC has increased the number of incentives available to departments that hire fellows and expanded eligibility for hiring incentives to include the health sciences and professional schools. The program is nationally recognized and leads a partnership of top universities that participate in recruiting top postdoc talent.
Implicit bias trainings — The 2018 California Budget Act included a one-time appropriation of $1.2 million to contract out and implement an anti-bias training pilot program for administrators, faculty, staff, and student leaders at the campuses of the University of California and the California State University. The pilot program was branded Moving Beyond Bias, and it includes content on racial, gender, and religious bias. Regional trainings took place in Oakland, Sacramento, and Northridge. Due to the COVID-19 pandemic, further trainings and sessions were conducted virtually. The training module was customized and delivered to UC admissions officers and readers, the CSU Chancellor’s Office, and the CSU Academic Senate. Two Moving Beyond Bias ecourses are currently under production, one version for a general staff audience and a second version for UC admissions officers and readers.
UC Gender Recognition and Lived Name Policy — Following the 2019 passage of the Gender Recognition Act (California Senate Bill 179), the University drafted and passed the Gender Recognition and Lived Name Policy on November 17, 2020, which states that the University “must provide the minimum three equally recognized gender options on university-issued documents and IT Resource systems — woman, man and nonbinary — and an efficient process for current students and employees and UC alumni and affiliates to retroactively amend their gender designations and lived names on university-issued documents, including eligible academic documents, and in IT resource systems.” The new change enables the University to collect and report demographic data and visualizations that compare outcomes for individuals whose genders are woman, man, and nonbinary.
Tribal citizenship and affiliation — Enhancements have been made to the undergraduate application to improve recognition of the tribal citizenship, affiliation, and diversity of Native American and Alaska Native applicants. Starting with the 2022 undergraduate application cycle, questions about tribal citizenship will be added to the citizenship and residency section of Apply UC, and additional disaggregated tribal affiliation options will be added to the demographic racial and ethnic section for federal reporting. The new changes, reflecting guidance provided by the President’s Native American Advisory Council, enable the University to collect, report, and compare demographic data on Native American and Alaska Native populations within and across populations with greater nuance and attention to tribal affiliation and sovereignty.
Anti-racism initiatives and resources — In the wake of the George Floyd murder, demand for anti-racism trainings, listening sessions, educational opportunities, resources, and commitments to institutional change increased dramatically across the UC system. Chief diversity officers and other diversity, equity, and inclusion professionals continue to be frontline responders, innovators, and leaders in this climate. A systemwide landing page of anti-racism trainings, webinars, healing sessions, and resources has been created (diversity.universityofcalifornia.edu), and continues to be refreshed and curated. The site also includes resources on anti-Asian racism and highlights long-term initiatives to address gaps in African American representation, outcomes and feelings of belonging and respect such as UC Irvine’s Black Thriving Initiative, UC Merced’s Valuing Black Lives Initiative, and UC San Diego’s Black Academic Excellence Initiative.
For More Information
Undergraduate admissions data
Graduate admissions data
Fall enrollment at a glance
Degrees awarded data
UCUES COVID-19 and remote learning dashboard
UC Regents Accountability Sub-report on Staff Diversity
Moving Beyond Bias
Gender Recognition and Lived Name Policy
UC Anti-racism Resources