Executive Summary
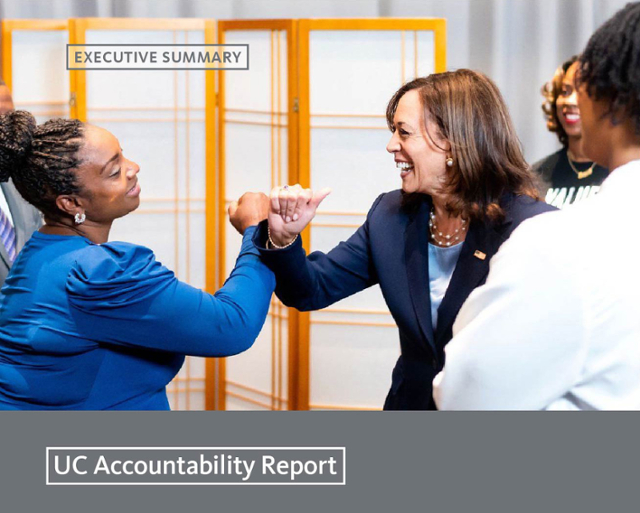
Vice President Kamala Harris visited UCSF April 21 to draw attention to the critical need for addressing disparities nationwide in health care for Black people during pregnancy. In an afternoon event at the UCSF Rutter Center, Harris met with leaders of EMBRACE, a nearly four-year-old clinical program that was developed to provide perinatal care for Black mothers, Black pregnant individuals, and their families from an intentional angle of racial consciousness.
Maternal mortality is not only a health care issue, Harris said: it is also a housing issue, a transportation issue, and an environmental issue.
“We are here today, to lift up the tremendous work that is being done by this group of extraordinary leaders,” she said. “Here at UCSF, at EMBRACE, you have helped build a model of culturally competent care. You include partners and family members in perinatal care…You have brought together extraordinary staff. In being a national model, this is lifting up exactly the design that is necessary to see [across] the planet outcomes that you all have been producing here.”
“Our program is (about) more than just surviving, it’s about thriving,” said Dr. Jackson, a UCSF obstetrician and gynecologist who co-founded EMBRACE. “We celebrate life, we celebrate family, we celebrate joy, Black joy…So when you think to yourself what is their secret sauce, why does EMBRACE work? It’s us.”
As part of its transparency efforts, the University of California produces the UC Accountability Report to provide greater awareness of University operations. This annual report, along with the online UC Information Center (ucal.us/infocenter), allows the public to learn more about the University, and UC leadership to identify areas of strength and opportunities for improvement for the system and UC campuses.
The 2022 UC Accountability Report Executive Summary highlights accountability indicators relevant to goals associated with the University of California’s multi-year plan: UC 2030. The UC 2030 plan is a collective effort of UC leadership — the President, Chancellors, and Board of Regents — to identify campus and systemwide goals that support California, including the need to help the state recover with equity from the COVID-19 pandemic.
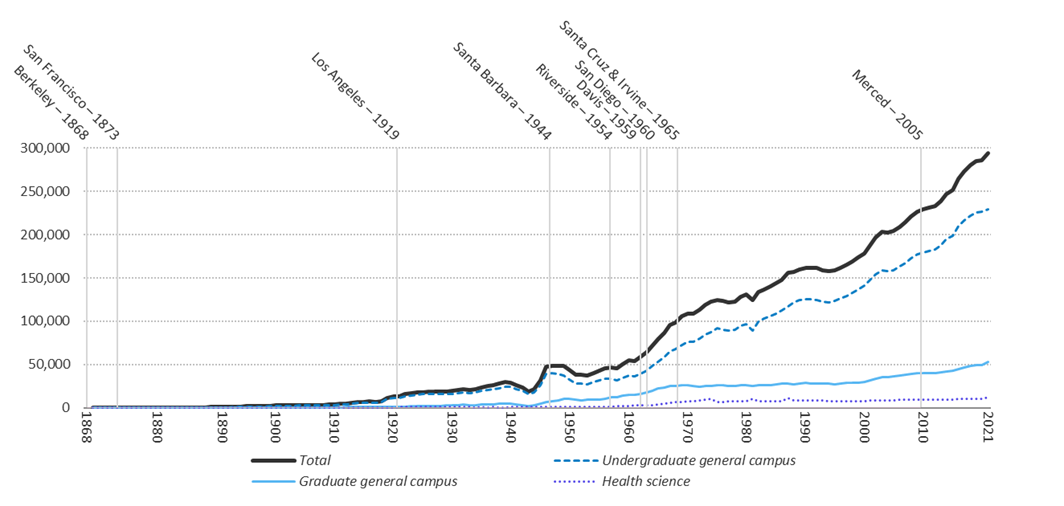
For more than 150 years, UC has helped California flourish. As the state’s public research university, UC has educated generations of students, and its research has provided solutions and policy support to issues facing the state, strengthened existing industries and created new ones, and attracted talent, dollars, and business into California. Educating graduate and undergraduate students within this setting emphasizes an inquiry-based education that expands current research capacity and creates the next generation of faculty and researchers, doctors and lawyers, artists and explorers, business owners and engaged citizens. As California has grown, so has the University.
Undergraduate and graduate enrollment, with campus opening date
California is one of the few states in the U.S. where minority groups make up more than half of the population. Low-income, first generation and underrepresented (African American, American Indian, and Chicano/Latino(a)) students make up the majority of California public high school students – they represent the new generation of California. But these populations have lower levels of educational attainment, less economic opportunity, and greater health disparities – inequities that were further exacerbated during the COVID-19 pandemic.
The University seeks to better reflect California’s diversity and ensure that student, faculty, and staff populations thrive. To promote inclusive access and success requires addressing historic inequities and systemic racism that underserved communities have faced. As one example, the University is committed to recognizing and acknowledging historic wrongs endured by Native Americans. One way it seeks to remedy that past is through the UC Native American Opportunity Plan, which waives tuition and fees for California residents who are members of federally recognized Native tribes.
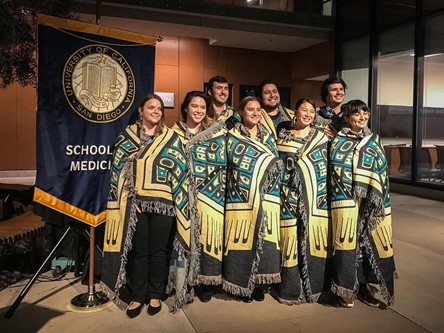
This year’s UC Accountability Report features stories about faculty, students, and staff who reflect UC’s diversity and UC efforts that advance educational equity and strengthen the University’s teaching, research, and public service mission. The photo above is of UC San Diego’s School of Medicine’s inaugural American Indian Medical Student Blessing Ceremony and Blanket Presentation and introduces the University of California Health chapter.
The University established its UC 2030 goals to illustrate how it could meet California’s needs, particularly through expanding opportunities for undergraduate and graduate students across the educational pathway and narrowing achievement gaps, along with growing and diversifying the faculty. This summary will provide a status report detailing progress to the UC 2030 goals. It is important to note the negative impact the pandemic has had on faculty, students, and staff who were personally affected by COVID-19, with individuals often facing personal loss and expanded care giving and family responsibilities. Overcoming those impacts will take time, and are likely to slow UC’s progress in achieving its 2030 goals.
UC 2030: Advancing the California Dream
The University of California multiyear framework – UC 2030 – began with a three-point plan on how the University would strengthen California by:
- producing over 200,000 additional degrees, on top of the one million undergraduate and graduate degrees currently projected by 2030;
- achieving a 90 percent overall graduation rate and eliminating gaps for timely graduation and graduate degree attainment for Pell, first-generation, and underrepresented groups;
- investing in the next generation of faculty and research by adding 1,100 ladder rank faculty by fall 2022 that better represent California’s diversity.
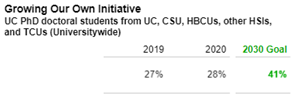
This year, the University added a new goal to have more than 40 percent of UC PhD students coming from UC, California State University (CSU), other Hispanic Serving Institutions (HSI), Historically Black Colleges and Universities (HBCU) and Tribal Colleges and Universities (TCU). By “growing our own” academic doctoral students, UC could expand access for more Californians and support efforts to diversify future faculty.
At the end of this executive summary is a dashboard displaying UC 2030 systemwide goals; and listed below are relevant UC Accountability Report indicators, which set the baseline and highlight existing challenges and opportunities to achieve these goals.
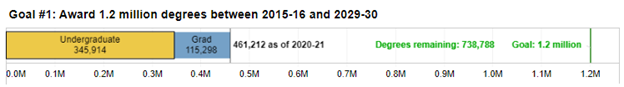
Goal 1: Producing 200,000 more undergraduate and graduate degrees by 2030
The Public Policy Institute of California (PPIC) estimates that California will face a shortfall of 1.1 million workers with at least a bachelor’s degree between 2014 and 2030, in large part due to Baby Boomers leaving the workforce. The University of California has set a goal to add 200,000 degrees over the one million currently projected – or 1.2 million undergraduate and graduate degrees. To date, UC has added over 460,000 undergraduate and graduate degrees or just over 38 percent of the 1.2 million total.
At the undergraduate level, much of this improvement will be made by increasing timely graduation, with all campuses proposing improvements that will yield a systemwide goal to increase four-year freshman graduation rates by eight points, from 68 percent to 76 percent and two-year transfer graduation rates by 13 points, from 57 percent to 70 percent.
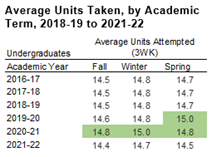
When campuses shifted to remote instruction, undergraduates took more units (i.e., courses) and there was also a significant increase in students enrolling in the summer. As a result, there was an increase in graduation rates, particularly four-year freshman and two-year transfer graduation rates, at the system and on most campuses which helped make progress to degree attainment goals.
However, there are some early indicators the pandemic may hinder future progress to achieving degree attainment goals. The University is tracking some concerning trends seen with the return to in-person instruction, including a decline in average units taken. In 2021-22, the average units taken across each term was lower when compared to the remote instruction period (shaded in green) and pre-pandemic levels. If continued, it could impact a student’s ability to make timely progress to completing a degree.
Of the additional 200,000 degrees UC will produce, over 40,000 will be graduate degrees, and this growth will primarily be achieved through increased graduate enrollment across the system. While UC undergraduate enrollment has grown funding for graduate enrollment has not kept pace, which both restricts the opportunity for bachelor degree recipients to get a graduate degree and UC’s ability to meet graduate degree attainment goals.
Graduate enrollment growth would increase mentorship and teaching assistant support for undergraduates, along with expand research capacity for campuses. For academic doctoral students, more than half remain in California and the majority work in higher education – 25 percent of UC faculty and 20 percent of California State University faculty have a UC Ph.D. – and these graduate students become the future professoriate.
Half of UC academic doctoral and master’s graduates who stay in California work in higher education. UC's systemwide impact on gross state product (value added) per capita
4.3.6 Industry of employment of UC graduate academic students in CA, by year after graduation,
Universitywide
2000 to 2018 graduating cohorts
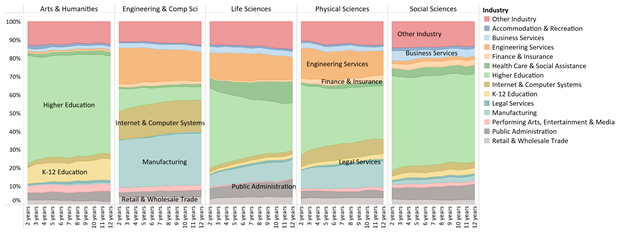
Source: California Employment Development Department and UC Corporate Student System
For UC PhDs who do not choose a career in academia, many conduct research and provide expertise that strengthen California’s businesses and high-skilled and high tech industries. UC’s professional degree recipients span disciplines such as law, medicine, nursing, business, education, architecture, public policy, and the arts and in many growing fields in California. Graduate student growth is needed to address the California Futures Foundation projection of a shortfall of 21,000 advanced-degree holders by 2030 for jobs in health care, technology, and other fields.
Goal 2: Ensuring the California Dream is for everyone
For undergraduates, the emphasis of this goal is currently two-fold: ensuring that nine out of ten freshman and transfer entrants leave UC with a degree, and eliminating timely graduation gaps for first-generation, Pell grant recipients, and underrepresented students.
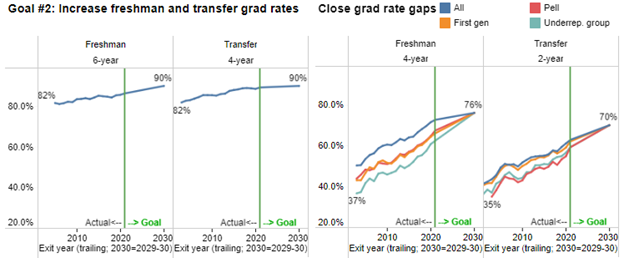
Over the last 15 years, UC graduation rates have improved, particularly four-year freshman and two-year transfer graduation rates. Over that time, UC has been unable to close double digit gaps in timely graduation for Pell, first-generation, and underrepresented groups, particularly for freshman entrants. There was some short-term progress during the pandemic: Students took more units and degree completion rates improved, including among Pell first-generation and underrepresented student groups.
UC’s gap in timely graduation for Pell and non-Pell recipients closed during the remote instruction period.
3.1.6 Freshman graduation rates by Pell Grant recipient status
Universitywide
Cohorts entering fall 2015, 2016, and 2017
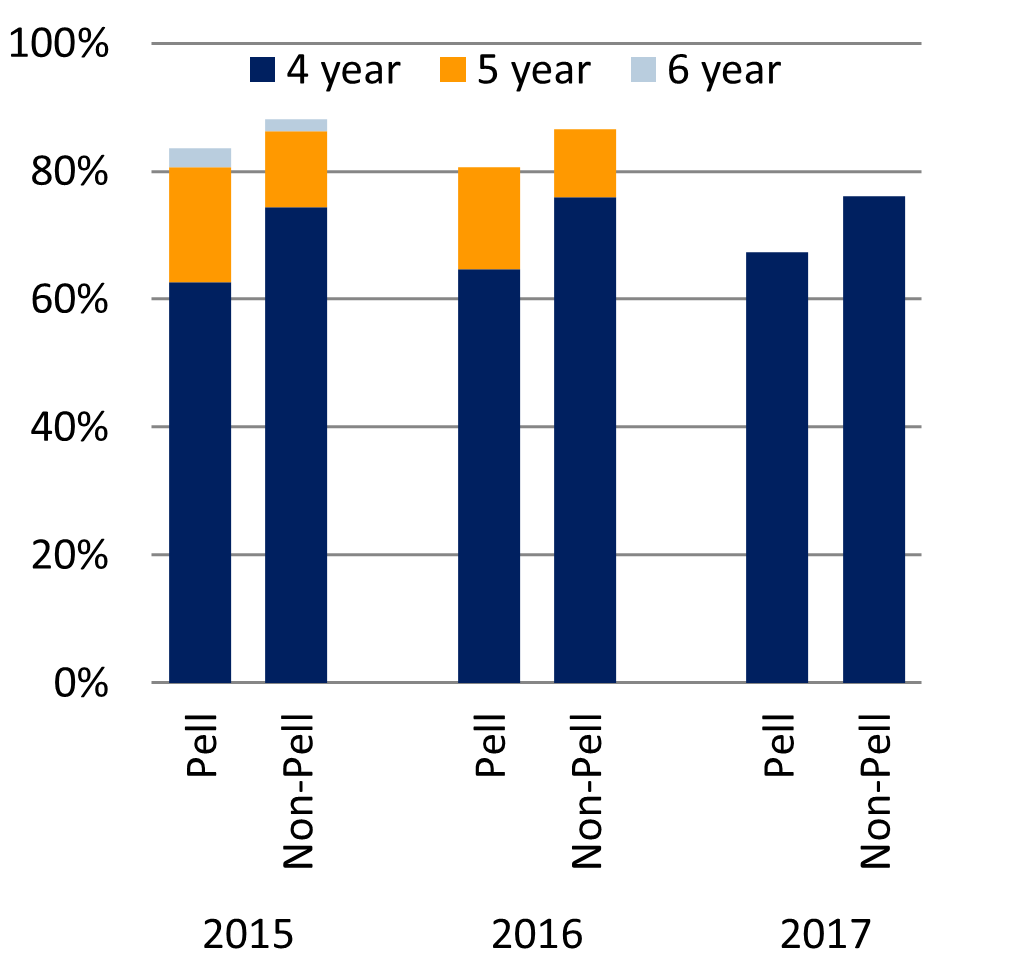
Source: UC Data Warehouse. Pell Grant recipients are those who received a Pell Grant at any point during their time at UC.
3.1.7 Transfer graduation rates by Pell Grant recipient status
Universitywide
Cohorts entering fall 2017, 2018, and 2019
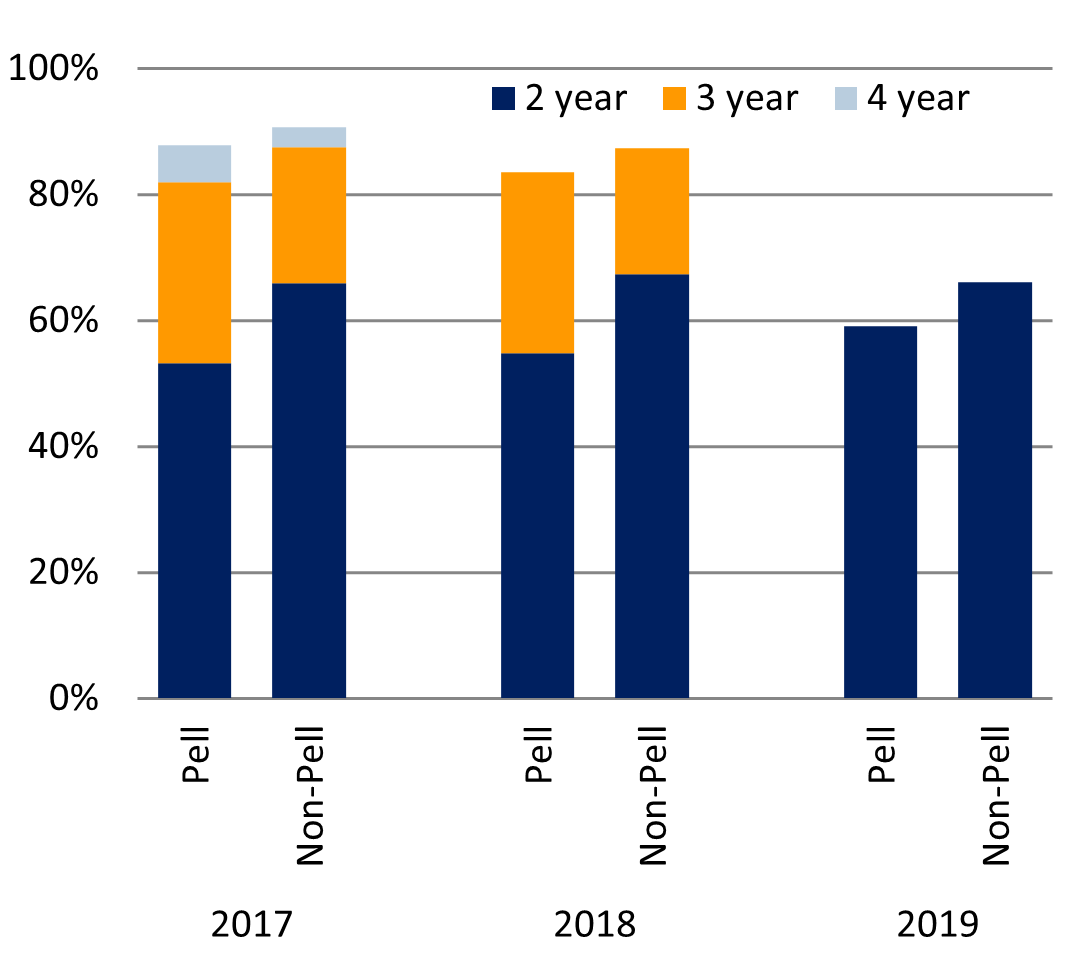
Source: UC Data Warehouse. Pell Grant recipients are those who received a Pell Grant at any point during their time at UC.
However, these gains may be short-lived with recent declines in first-year retention and even greater declines for Pell, first generation, and underrepresented students. For example, first-year freshman retention rates dropped 3.6 points for Pell grant recipients, 3.3 points for first generation students, and 3.2 points for URG students (.7 points for African American, .3 for American Indian, and 3.6 points for Hispanic/Latino(a).
UC’s first-year retention rates declined with the return to in-person instruction.
3.2.1 First-year retention rates
UC systemwide
Cohorts entering fall 2010 to fall 2020
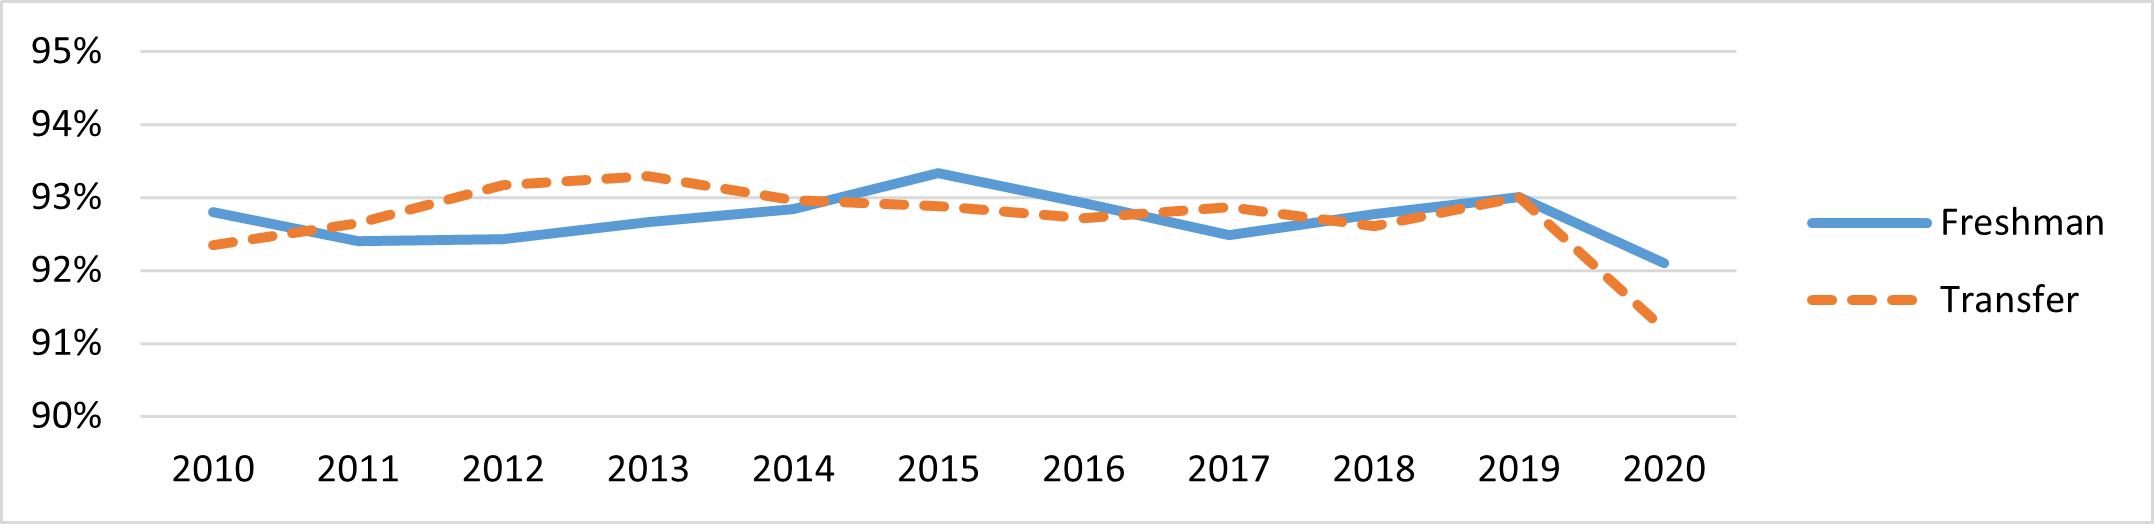
Source: UC Data Warehouse
Missed learning for K-12 and California Community College (CCC) students due to the pandemic are resulting in greater declines in incoming academic preparation, which is one likely contributor to the decline in first-year retention. UC research has found that larger differences in graduation rates can be explained by high school unweighted grade point average (GPA) which is used as a proxy measure for academic preparation for entering freshmen. Gaps in graduation rates between the lowest GPA category (“bottom third”) and highest GPA category (“top third”) are much wider than the gaps between groups (e.g., African American and White) when comparing the same GPA categories. The same is true for incoming transfers (see indicator 3.1.11).
Academic preparation explains more of the difference in freshman graduation rates than race/ethnicity, Pell recipient status, or first-generation status alone.
3.1.10 Freshman graduation rates by HS GPA (top, middle, and bottom thirds) and race/ethnicity, Pell Grant recipient status, and first-generation status
Universitywide
Cohort entering fall 2015
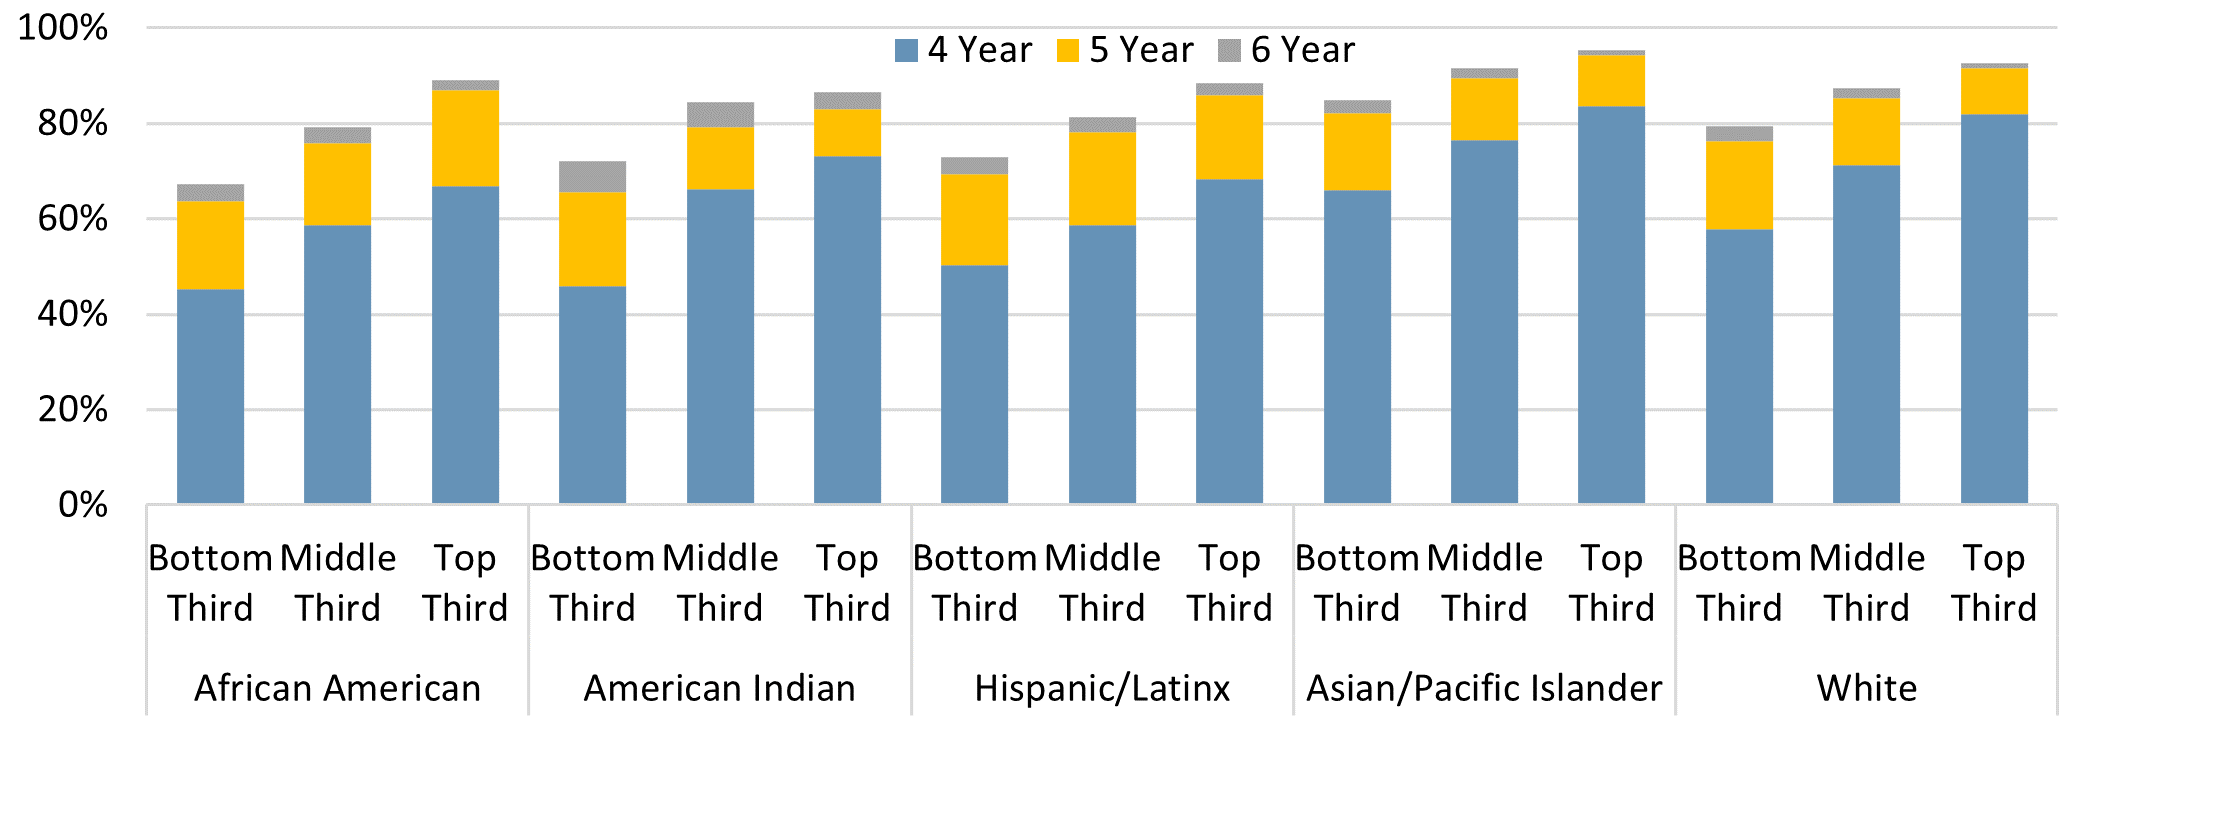
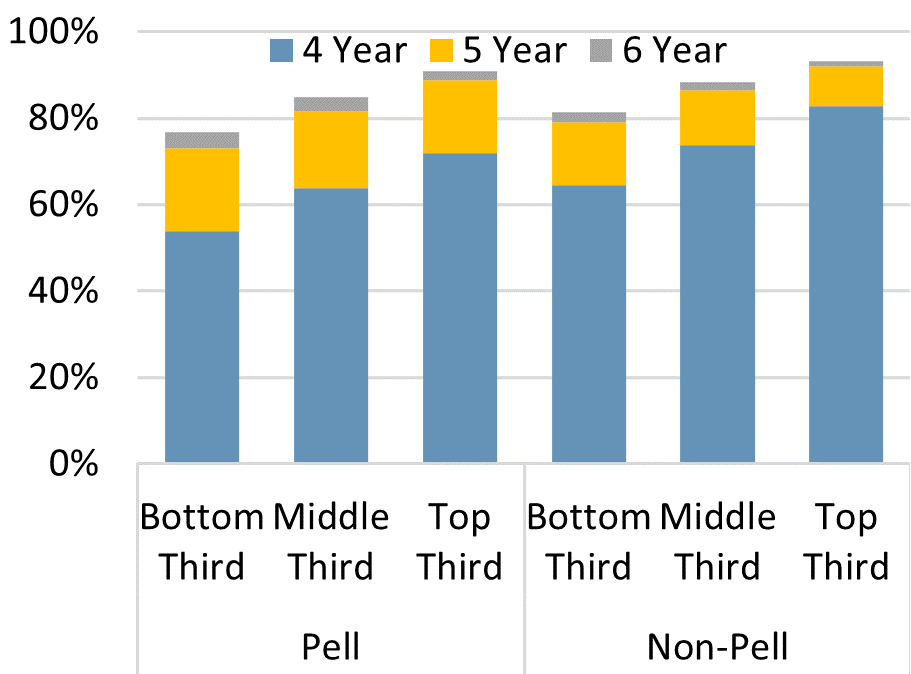
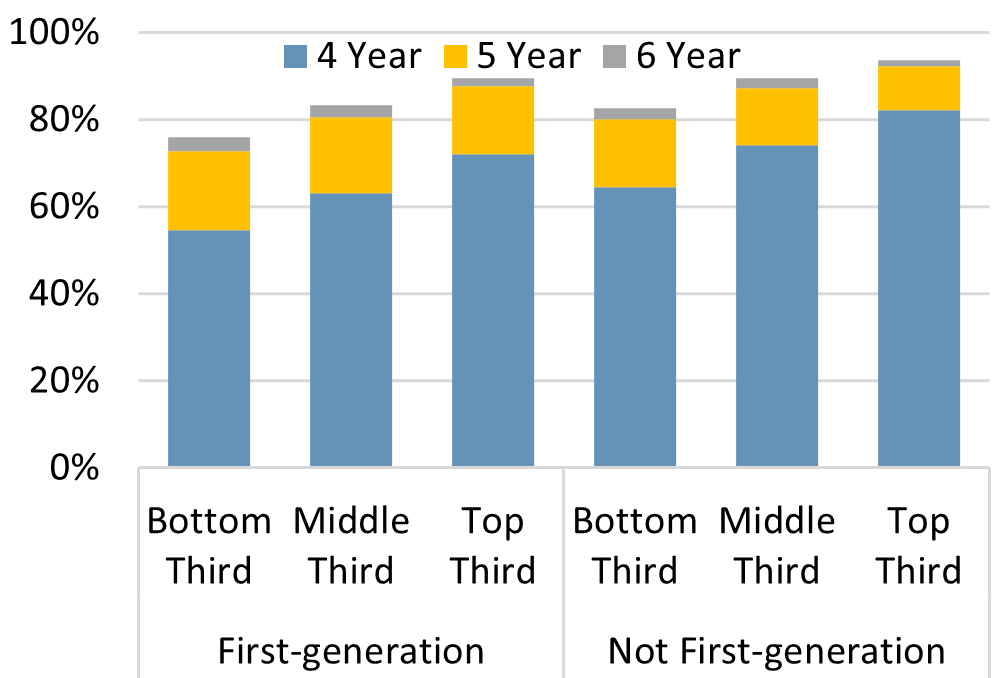
Source: UC Data Warehouse
As a result, UC campus are increasing efforts to expand pre-matriculation and first-year programming for freshman and transfer entrants, including expanding summer bridge/transfer edge opportunities and living-learning communities, along with increased curricular support, including redesigning gateway courses to eliminate equity gaps. With an expected increase in student coming in with lower levels of academic preparation and other pandemic-related challenges (e.g., caring for family members, need to work), UC may have greater challenges improving timely graduate and is at risk of not being able to eliminate equity gaps.
For graduate students, the emphasis of this goal is to increase the proportion of incoming UC PhD students that received their undergraduate degree from UC, CSU, HBCU, other HSI, and TCU institutions from 27 to over 40 percent. By expanding outreach efforts to these institutions that are more diverse than the current UC PhD population, it will support UC efforts to diversify the future professoriate.
Entering academic doctoral students from UC, CSU, HBCUs, HSIs, and TCUs are more racially/ethnically diverse than students from other undergraduate institutions.
4.2.2 Academic doctoral entering student enrollment by undergraduate institution and race/ethnicity
Universitywide
Fall 2017 - 2021
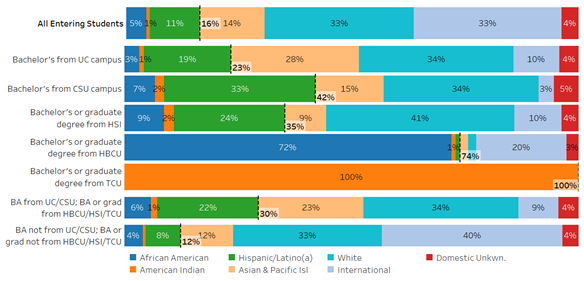
Note: rounding may account for differences in URG subtotals.
Source: UC Corporate Student System. HSIs exclude UC HSI and CSU HSI campuses
Goal 3: Investing in the next generation of faculty and research
UC needs to grow and diversify the faculty to strengthen the University’s teaching, research, and public service mission and support UC undergraduate and graduate students. Based on campus input, the University set a goal to add 1,100 net new faculty by 2022. As of 2021, UC has added around 340 faculty (just over 30 percent of the 1,100 goal).
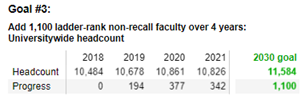
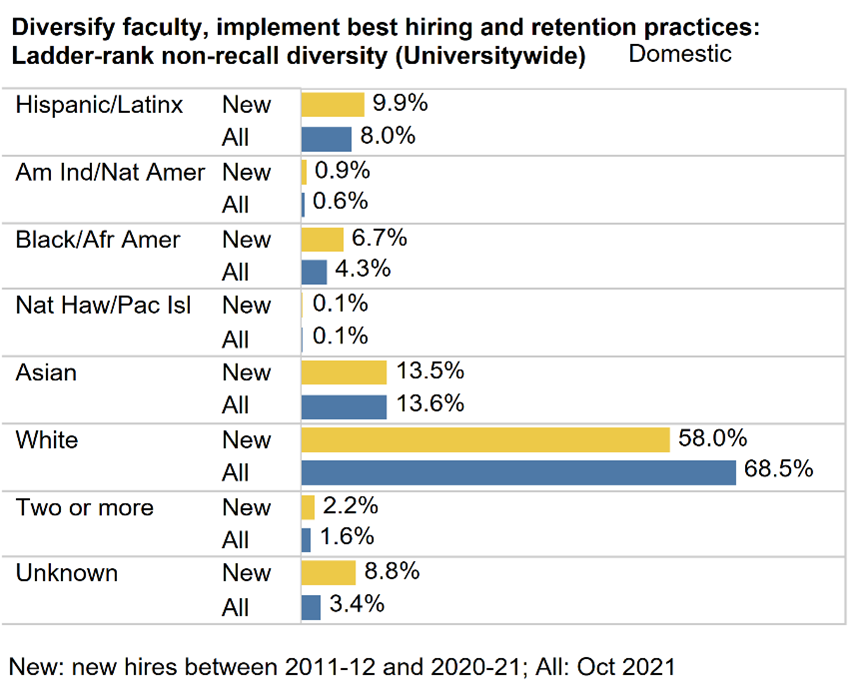
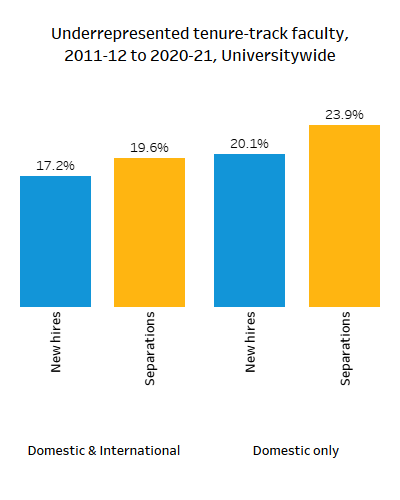
In 2021, the faculty headcount declined over the prior year, with campuses scaling back faculty recruitment with the economic uncertainty caused by the COVID-19 pandemic and an increase in faculty separations and retirements. As with other populations, UC faculty faced increased workload and stress during the pandemic, struggling to shift courses to remote instruction, stalled research and scholarship, and increased anxiety due to work-life balance issues, health concerns, and dependent care responsibilities. Newer, more diverse faculty were hit particularly hard with the pandemic making it increasingly difficult to make progress to tenure and some choosing to leave the University. As the following figures show, while UC hires are more diverse than incoming students, the proportion of underrepresented faculty separating from the institution is even greater, which will stall UC efforts to grow and diversify the faculty. A Joint Academic Senate-Administration Mitigating COVID-19 Impacts on the Faculty Working Group issued a final report with five recommendation on ways to address COVID-19 impacts on the faculty. The highest-priority recommendations focused on how to fairly account for these impacts in the academic advancement process and, important to the University of California’s mission, proposed campus approaches to give faculty the resources and time necessary to recover from disruptions to research and scholarship.
UC’s new faculty are more diverse than existing faculty, but the share of tenure-track faculty separations who are URG exceeds the share of URG faculty in tenure-track new hires.
To reach the faculty hiring goal by 2022 goal, UC would need to add an additional 758 faculty. UC is not on pace to meet this faculty hiring goal.
The California Governor and University Join in a Compact to Advance Key UC 2030 Goals
The University and Gov. Gavin Newsom have mutually agreed to prioritize advancement of student-focused, shared goals, including closing equity gaps and growing undergraduate and graduate students. Under a compact agreed upon in the 2022-23 state budget, UC will receive annual 5 percent increases to its core budget over each of the next five years, with the understanding that it will focus resources on achieving UC’s 2030 goals, including growing and diversifying the faculty and narrowing student achievement gaps.
This dashboard highlights key goals of the UC 2030 framework.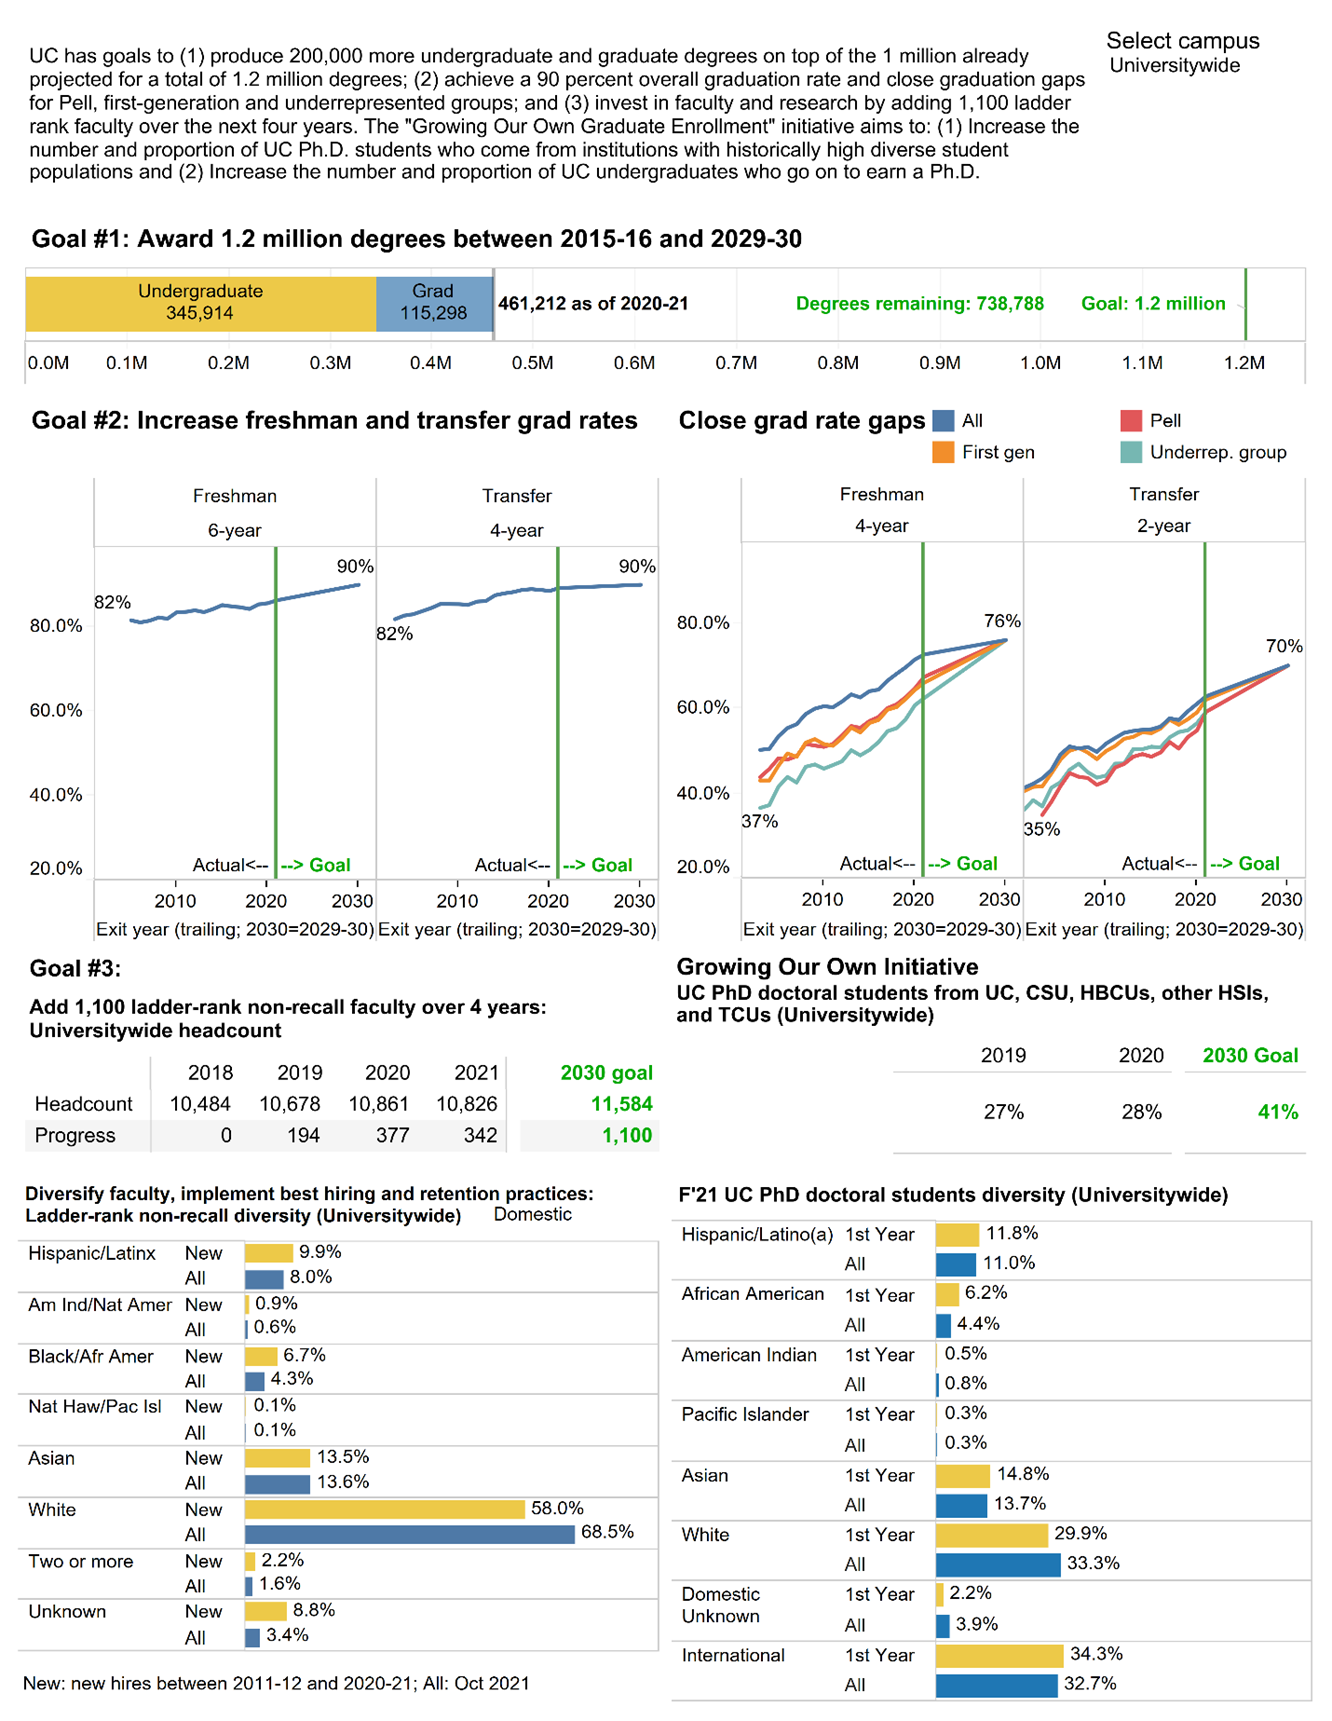
Dashboard Notes and Data Sources
UC historical fall enrollment, 1869 to present provides enrollment trends for undergraduate, graduate, and health science students by campus.
Degrees awarded include the leading summer and the full academic year. universityofcalifornia.edu/infocenter/degrees-awarded-data.
Graduation rates are based on entering cohorts but labeled by the exit academic year, which is a leading year. For example, the six-year graduation rate for 2019 in the graph reflects students who entered in fall 2014 and graduated in the 2019–20 year (including the trailing summer). universityofcalifornia.edu/infocenter/ug-outcomes.
Ladder-rank non-recall faculty are October payroll snapshot headcounts.