Over time, UC's varied sources of revenue have grown at different rates.
12.1.1 Revenues by source, Universitywide, Fiscal year 2021–22
![]()
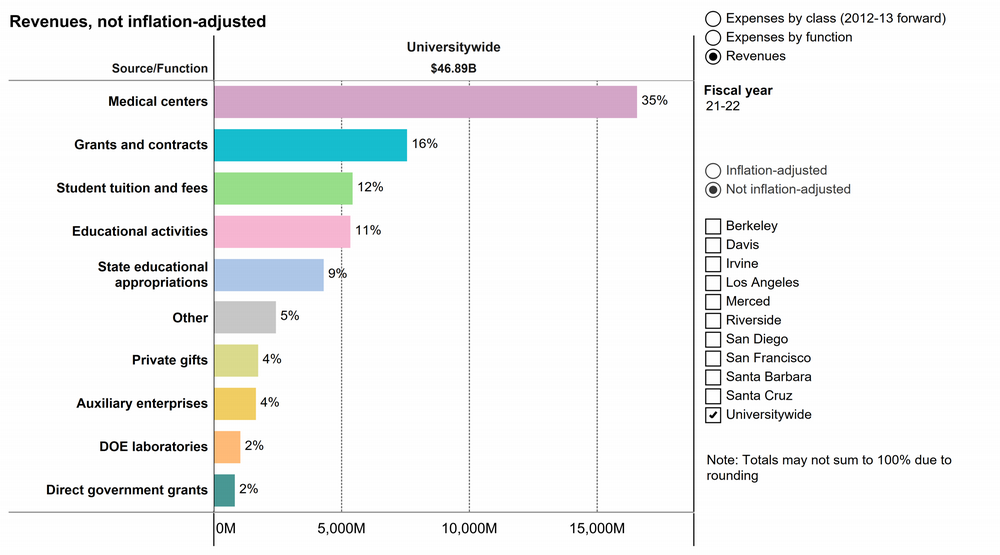
Revenue and expense data dashboard
Overview
UC requires significant resources and planning to support its instruction, research, and public service missions. This chapter provides insight into the financial health of the University, the state of capital and space resources, and the environmental sustainability of campus operations. This chapter also includes information on the UC Community Safety Plan, which re-envisions safety at University of California locations.
Indicators in this chapter provide updates on the following topics:
Over time, UC's varied sources of revenue have grown at different rates.
12.1.1 Revenues by source, Universitywide, Fiscal year 2021–22
![]()
Revenue and expense data dashboard
Ninety-eight percent of all gift funds are restricted by donors in how they may be used.
12.1.2 Current giving by purpose, Universitywide, 2000–01 to 2021–22
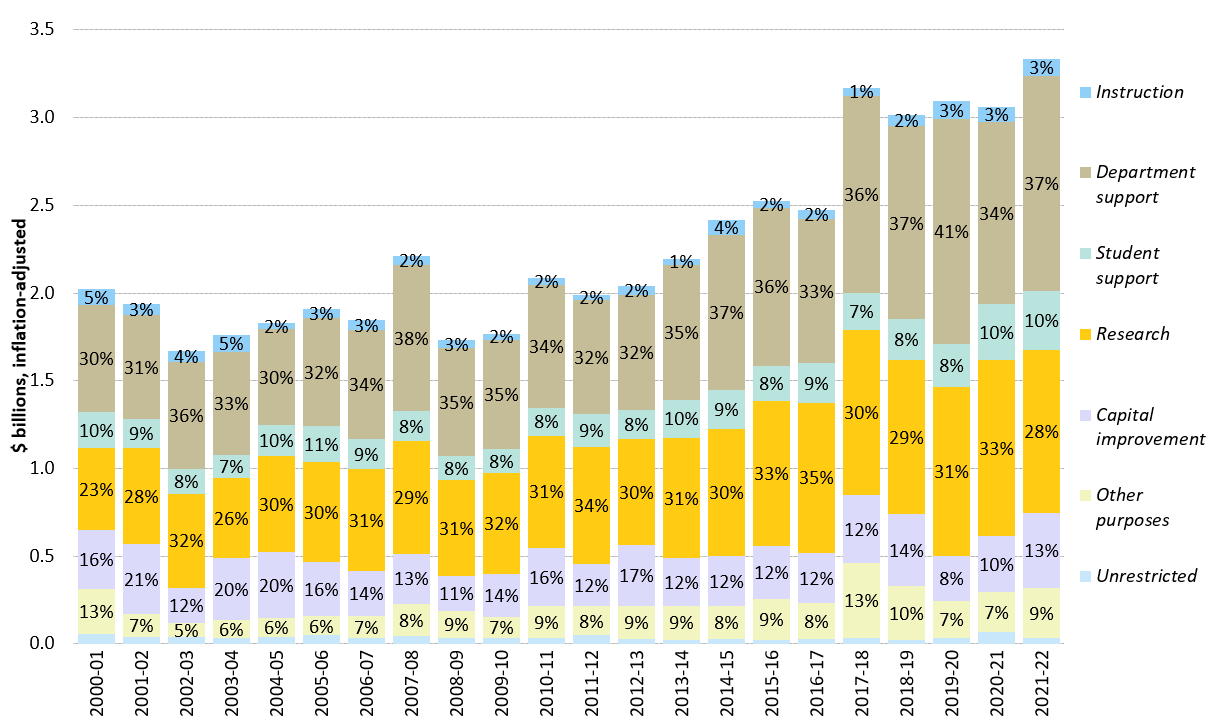
Source: UC Institutional Advancement
Gift funds have become increasingly important to the University as a means to help address budget shortfalls and expand student financial aid. In 2021–22, new gifts to the University totaled over $3.3 billion. However, virtually all of these funds are restricted for specific purposes and are not available to support general operating costs. In addition, approximately $806 million was designated for endowment, where only the income/payout is available for expenditure.
Private giving varies significantly by campus and relates to the campus’ age, number of alumni, and the presence of health science programs.
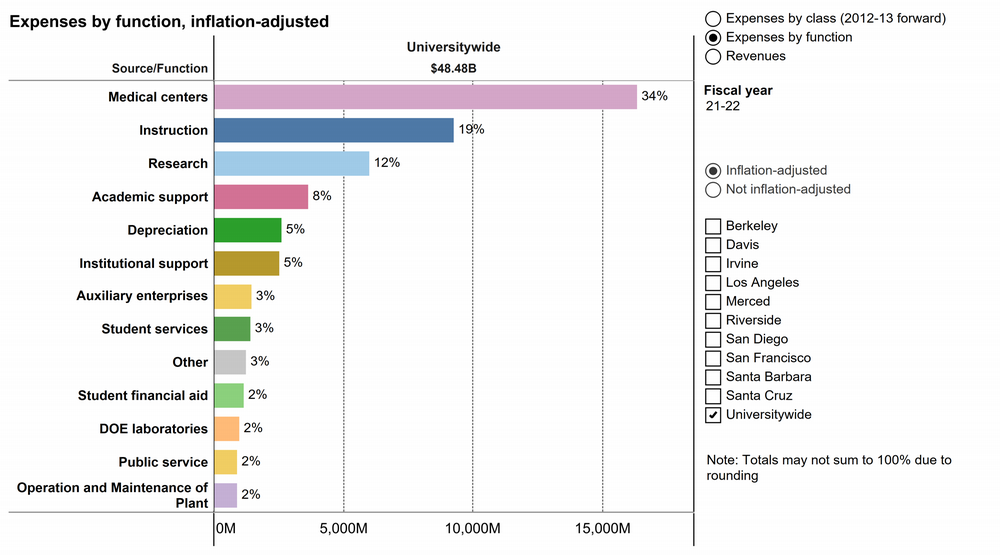
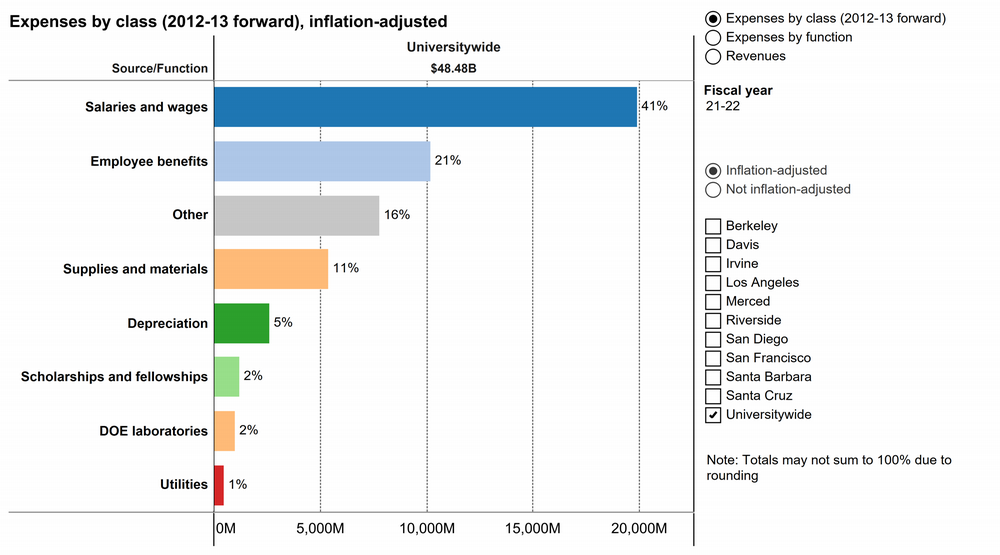
Medical centers are the largest single functional expense, and their share has grown over time.
12.1.3 Expenditures by function and class, Universitywide, Fiscal year 2021–-22
![]()
Revenue and expense data dashboard
Revenue and expense data dashboard
Since 2000–01, average instructional expenditures per UC student have declined by 20 percent, yet students and their families bear a greater share of the cost.
12.1.4 Average general campus core fund expenditures for instruction per student , 2000–01 to 2021–22
![]()
University of California Budget for Current Operations 2023-24 report
Source: UC Budget Office
*These statistics are presented on page 19 of the University of California Budget for Current Operations report.
Ninety-two percent of UC’s capital project funding over the last ten years was derived from non-State fund sources. In 2013–14, changes to the California Education Code allowed UC to direct a portion of its existing State operating funds support to capital.
12.2.1 Sources of capital project funding by year of approval, Universitywide, 2012–13 to 2021–22
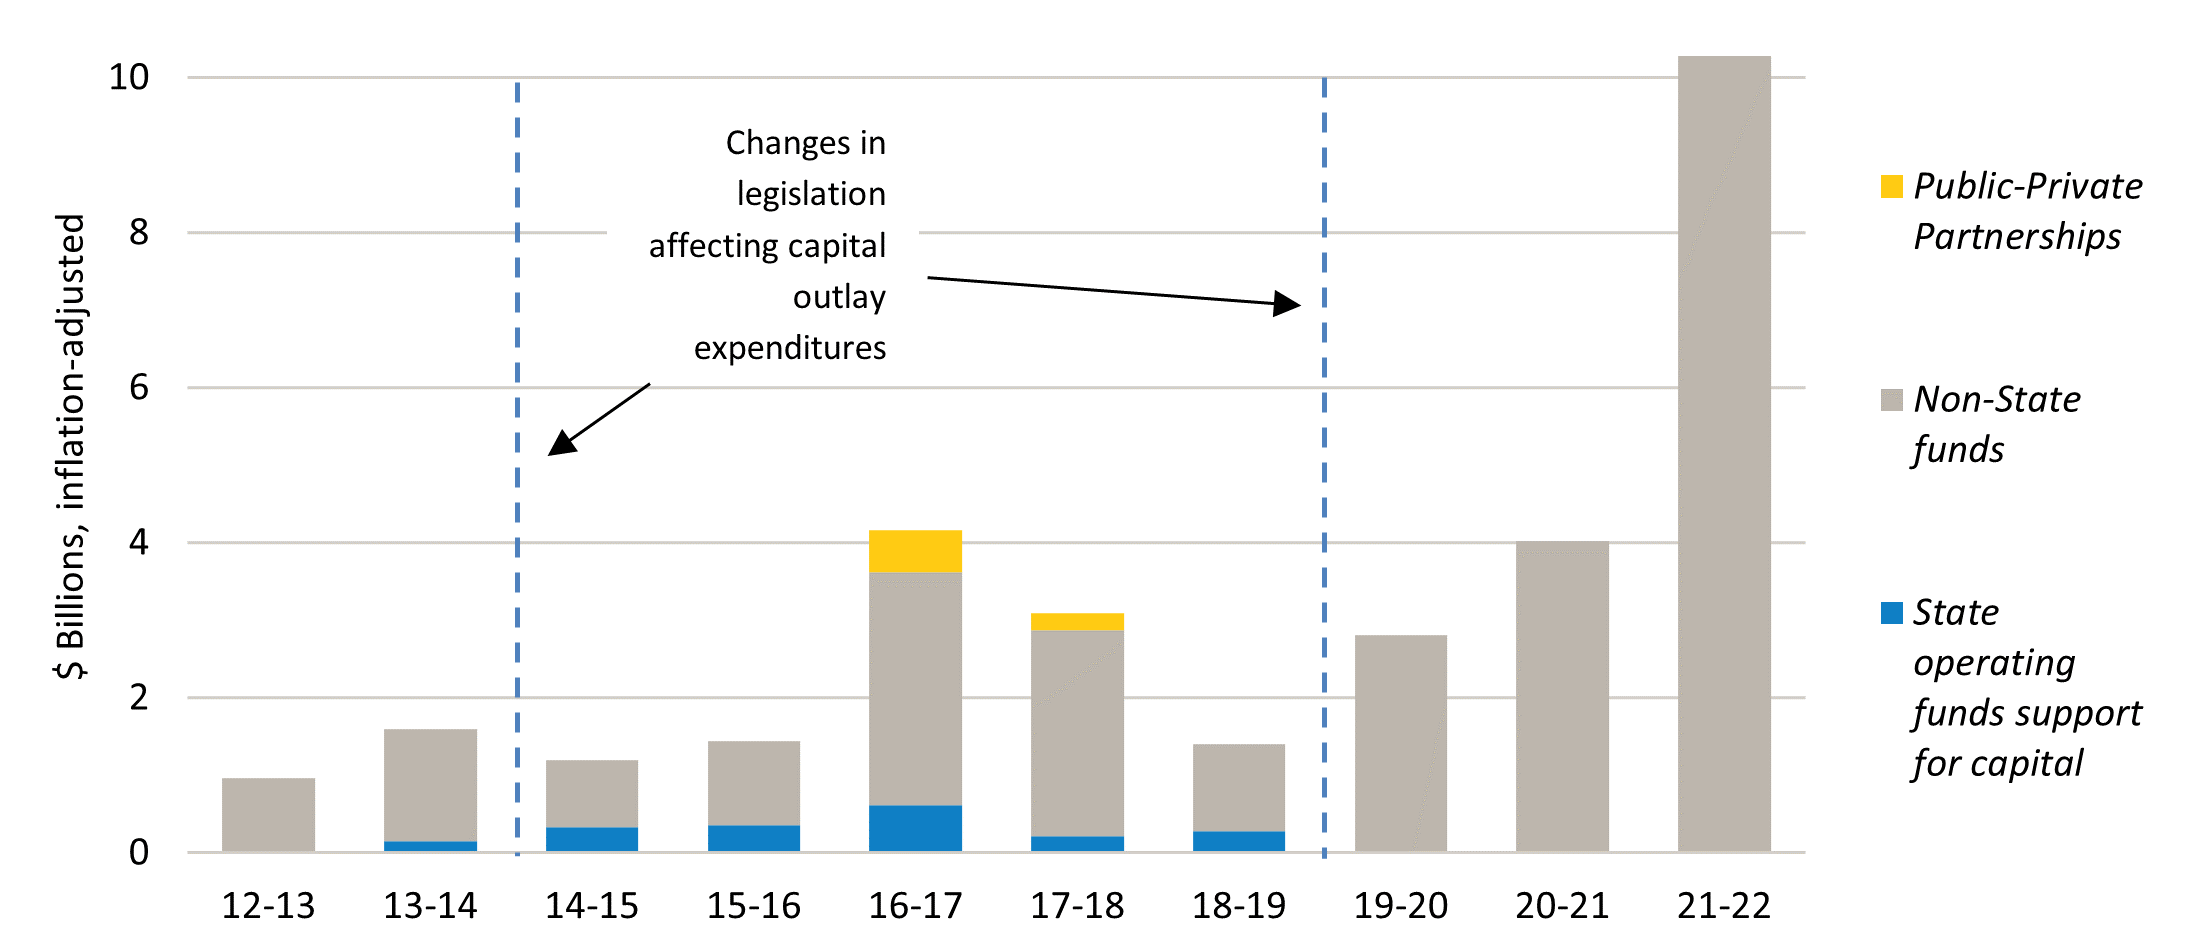
Source: UC Capital Asset Strategies
The University’s capital program is driven by the campuses’ and medical centers’ strategic plans. UC’s capital program is funded by a combination of State and non-State funds, with non-State sources funding most of UC’s State-eligible capital needs and all self-supporting enterprises, such as housing, parking, athletics, and medical centers. To the extent that non-State funds are used to support core academic capital needs, less funding is available to support other high-priority needs such as deferred maintenance, seismic, and enrollment growth.
The 2021–22 capital project program is heavily supported by external financing.
12.2.2 Sources of capital project spending detail, Universitywide, Project budgets approved in 2021–22
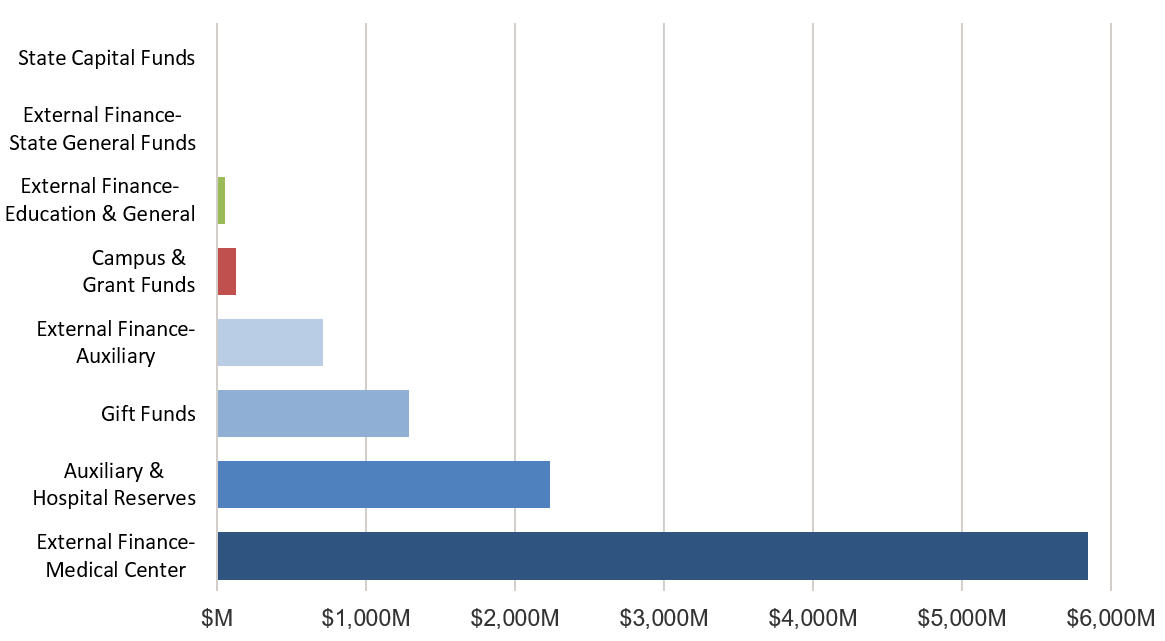
Source: UC Capital Asset Strategies
External financing plays an important role in funding capital needs. Sixty-four percent of capital project funding in 2021–22 came from non-State supported external financing. The majority of financing supported medical center construction. The remainder of non-State financing supports student housing projects (auxiliary) as well as renewal and modernization of instructional and research space and program improvements (education and general).
The remainder of UC’s capital program is funded by gift funds, campus funds, and other non-State sources. These campus funds are derived from various sources, including indirect cost recovery and investment earnings.
Ninety-nine percent of capital funds approved for expenditure in 2021–22 supported program improvements and projects addressing enrollment growth.
12.2.3 Types of capital projects, based on budgets approved by year, Universitywide, 2012–13 to 2021–22
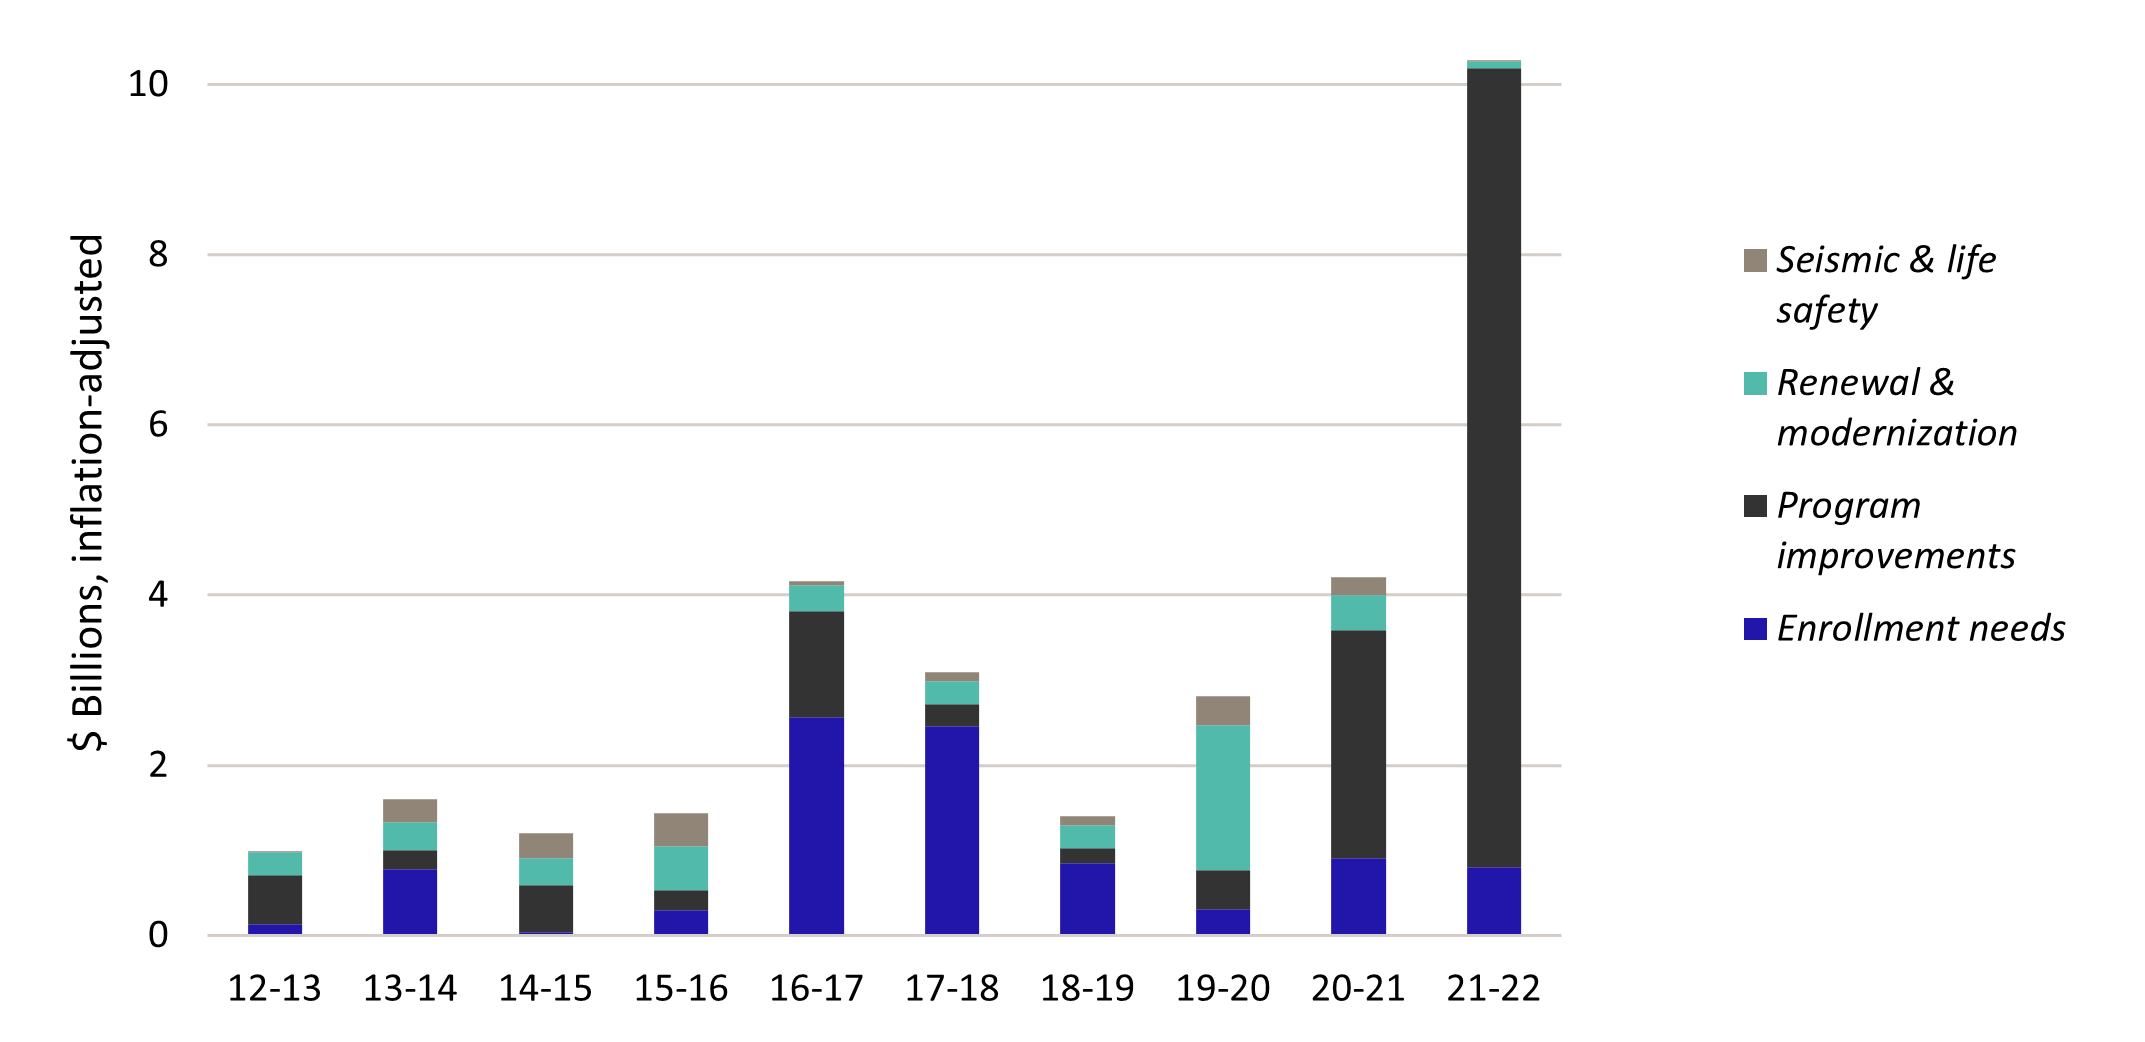
Source: UC Capital Asset Strategies
Program improvements and modern program initiatives require state-of-the-art space, often necessitating the repurposing of existing facilities or new construction. During 2021–22, UC approved capital project budgets totaling $10 billion.
UC devoted $9.4 billion for program improvements in 2021–22. Eighty-two percent of these improvements supported two medical center projects (UCD California Hospital Tower and a new hospital at UCSF Helen Diller Medical Center at Parnassus).
In 2021–22, UC approved $799 million for projects that address enrollment needs, most notably, housing for the Berkeley and San Diego campuses.
UC space has increased by 17 percent in the past decade, with most of the growth targeted for instruction and research and residential uses.
12.2.4 Assignable square footage (ASF), Universitywide, 2012–2022
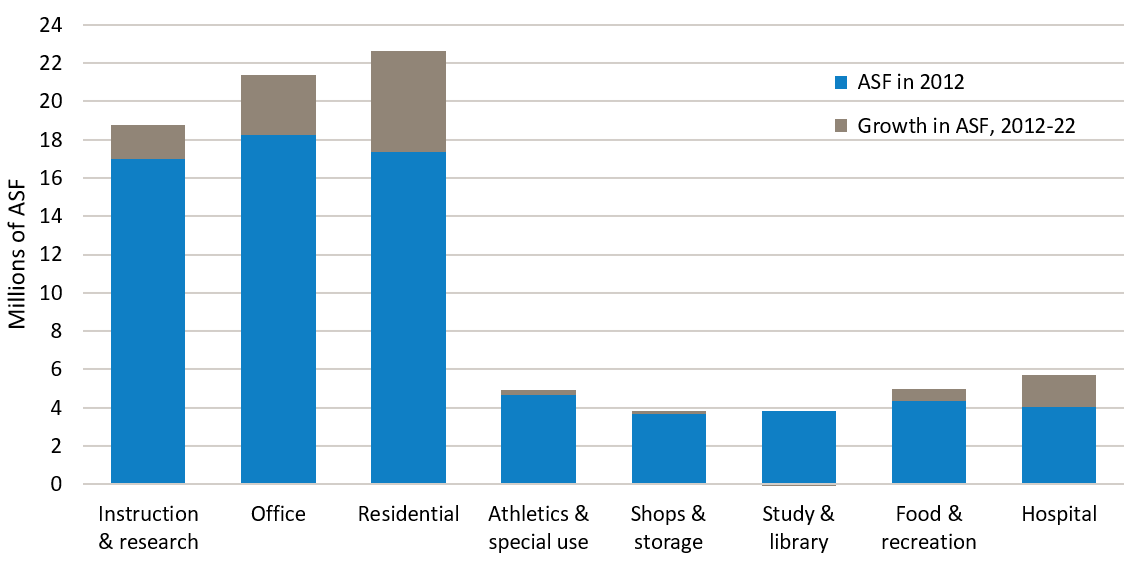
Source: UC Capital Asset Strategies
Assignable square footage (ASF) is the space available for programs or assigned to specific uses. It does not include corridors, bathrooms, or building infrastructure.
Indicator 12.2.4 illustrates the growth in space over the last decade, according to categories for assignable space. Since 2010, space has increased by 13.1 million ASF to 84.8 million ASF.
In the past decade, instructional and research space increased by about 1.9 million ASF, office space by 3.8 million ASF, and residential space by 4.7 million ASF. The space increase for these areas (20 percent) has not kept pace with the increase in fall enrollment (27 percent) for the same period. Residential space has grown as campuses strive for more on-campus student housing to improve student life in living/learning communities and to reduce environmental impacts from commuting. Increases in the student population have also required additional athletic, recreational, and food service space.
Hospital space has grown in the past decade. All five medical centers experienced growth, but most of the growth in hospital space can be attributed to UCSF Medical Center at Mission Bay (2015) and Ron Conway Family Gateway Medical Building (2015), and the Jacobs Medical Center (2016) and Koman Family Outpatient Pavilion (2018) at UC San Diego Health.
UC has made consistent progress toward its greenhouse gas emission goals.
12.3.1 Greenhouse gas emissions compared to climate goals, Universitywide, 2009–2050
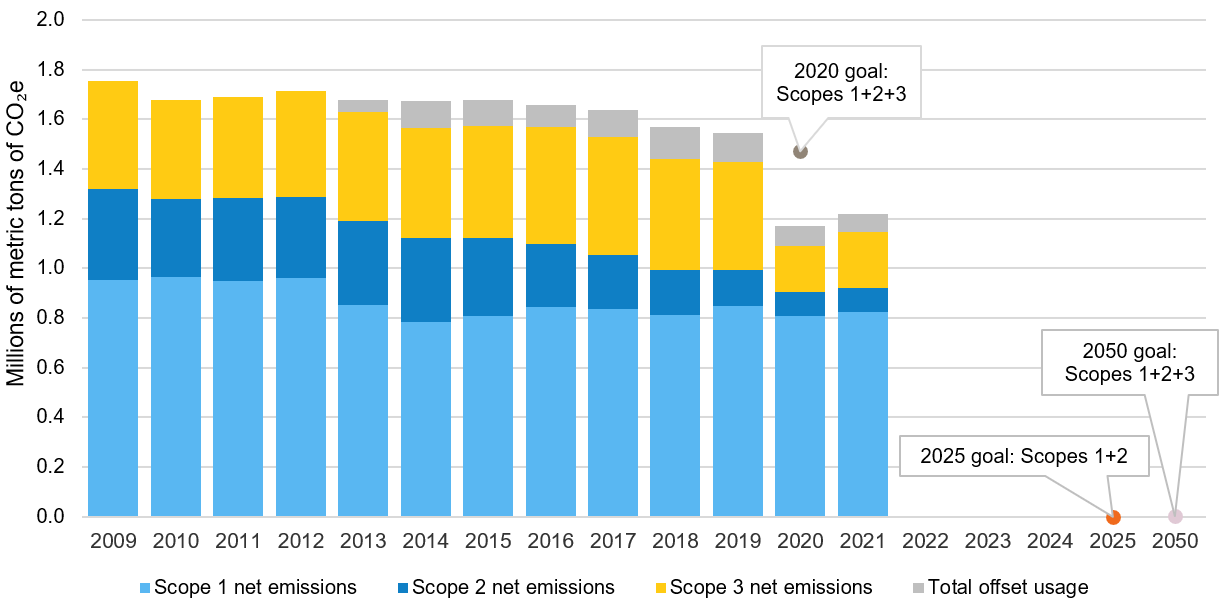
Source: UCOP Energy and Sustainability Office
Most campuses, including their health systems, continue to achieve the University’s climate policy goal of reducing greenhouse gas emissions to 1990 levels. Campuses purchased compliance and voluntary offsets that contribute to their emissions reductions. The magnitude of emissions reductions in 2020, especially for scope 3 air travel and commute emissions, reflect the impact of COVID-19. Travel-related emissions increased by about 21 percent in 2021 compared to 2020. All campuses have plans in place for moving toward carbon neutrality by 2025 that rely on a variety of strategies
Energy efficiency upgrades resulted in cumulative net avoided costs for the University of $378 million by the end of 2022.
12.3.2 Cost avoidance from energy efficiency projects, Universitywide, 2005–2022
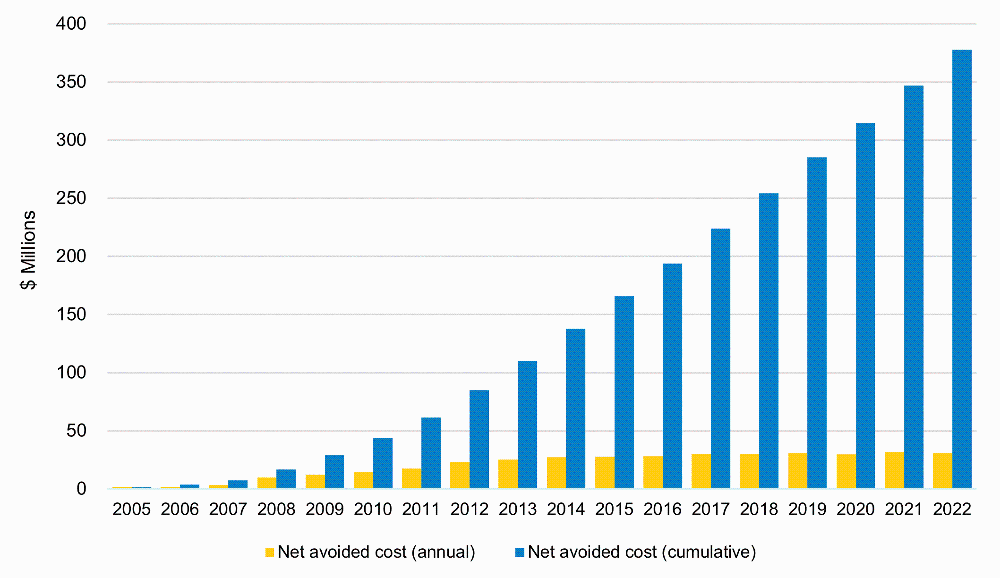
Source: UCOP Energy and Sustainability Office
In 2004, the University formed a statewide energy efficiency partnership program with California State University and the state’s four investor-owned utilities to improve the energy performance of higher education facilities. The partnership has provided funding for equipment retrofits and monitoring-based commissioning. Since its inception, more than 1,100 energy efficiency and new construction projects have been completed under the program. These projects will have received approximately $100 million in incentive payments and avoided more than $30 million in annual energy costs, net of debt service.
By the end of 2022, UC had achieved 408 LEED® certifications.
12.3.3 LEED® certifications, Universitywide, 2005–2022 (cumulative)
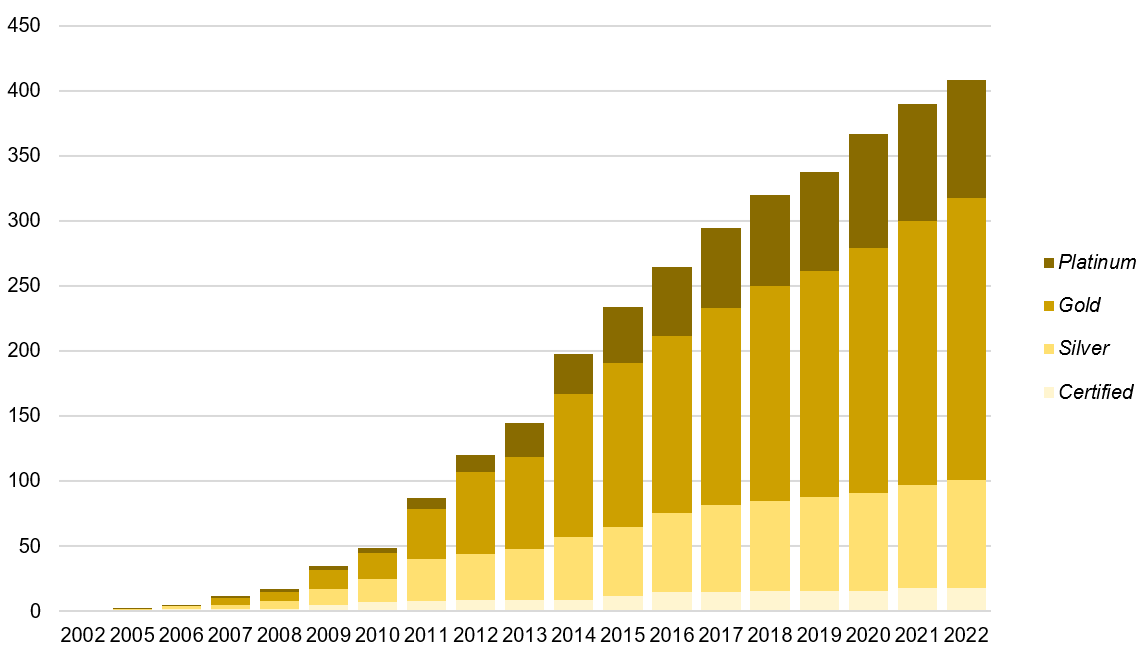
Source: UCOP Energy and Sustainability Office
The University’s sustainable practices policy requires that all new buildings and renovations are designed and constructed to a minimum LEED® (Leadership in Energy and Environmental Design) for New Construction Silver rating. UC has 408 LEED certifications systemwide, representing 35 million square feet of certified green building space. During fiscal year 2021–22, UC added 25 new LEED certifications, including five LEED Silver and 20 LEED Gold buildings.
UC LEED® certifications are listed at a link found at the Green Building webpage of UC Sustainability website.
As shown in the dashboard linked below, UC police departments made over 14,700 stops in 2022.
12.4.1 Number and circumstances of UCPD stops by month, Universitywide, 2022
![]()
Community safety: Stops dashboard
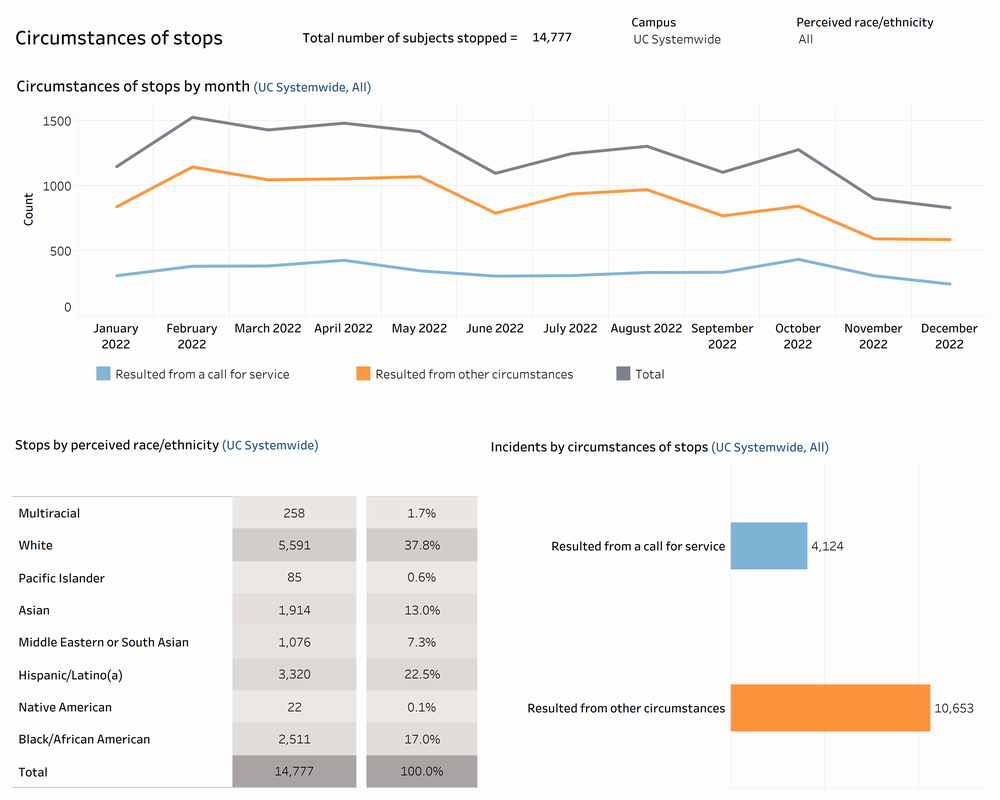
The majority of stops originated from a traffic violation and the majority of all stops resulted in a warning. The dashboard linked above provides additional information on the reason for and result of UC police department stops by campus and perceived race/ethnicity.
As displayed in the dashboard linked below, there were 112 incidents of use of force in 2022.
12.4.2 Number of UCPD use of force incidents by month, Universitywide, 2022
![]()
Community safety: Use of force dashboard
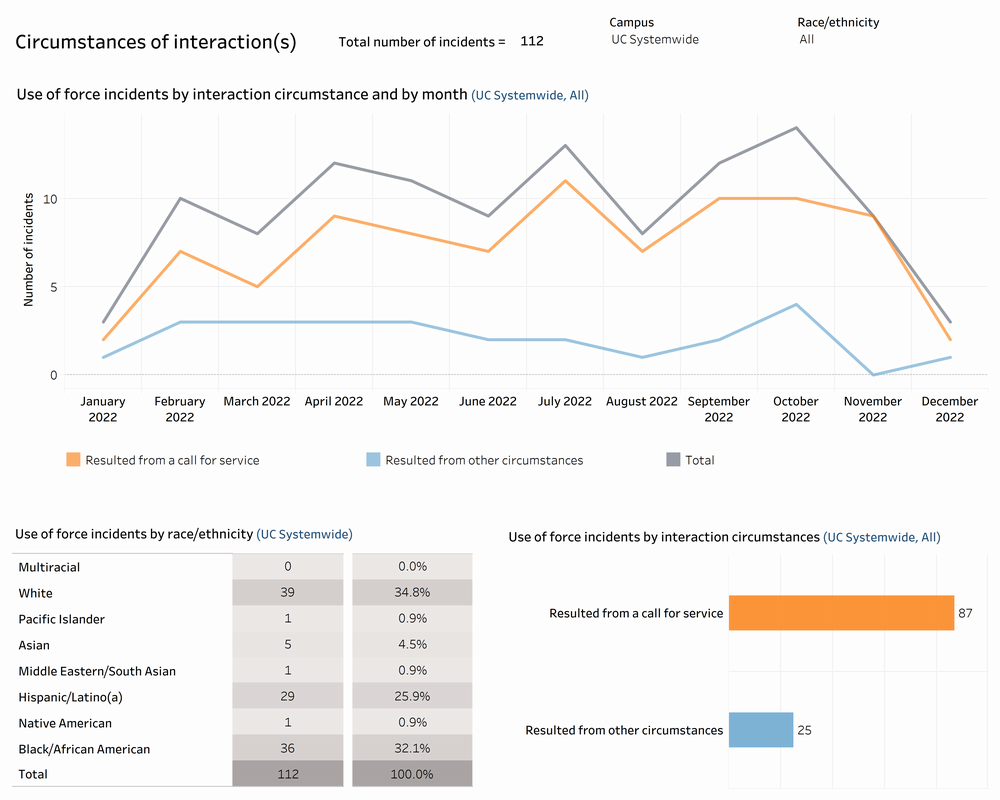
The majority of use of force incidents were preceded by a call for service. The majority of these incidents also resulted in the use of a physical technique. The dashboard linked above provides additional information about use of force incidents by campus and race/ethnicity.
As shown in the dashboard linked below, there were over 759,000 calls for service to UC police departments throughout 2022.
12.4.3 Number of UCPD calls for service by call category, Universitywide, 2022
![]()
Community safety: Calls for service dashboard
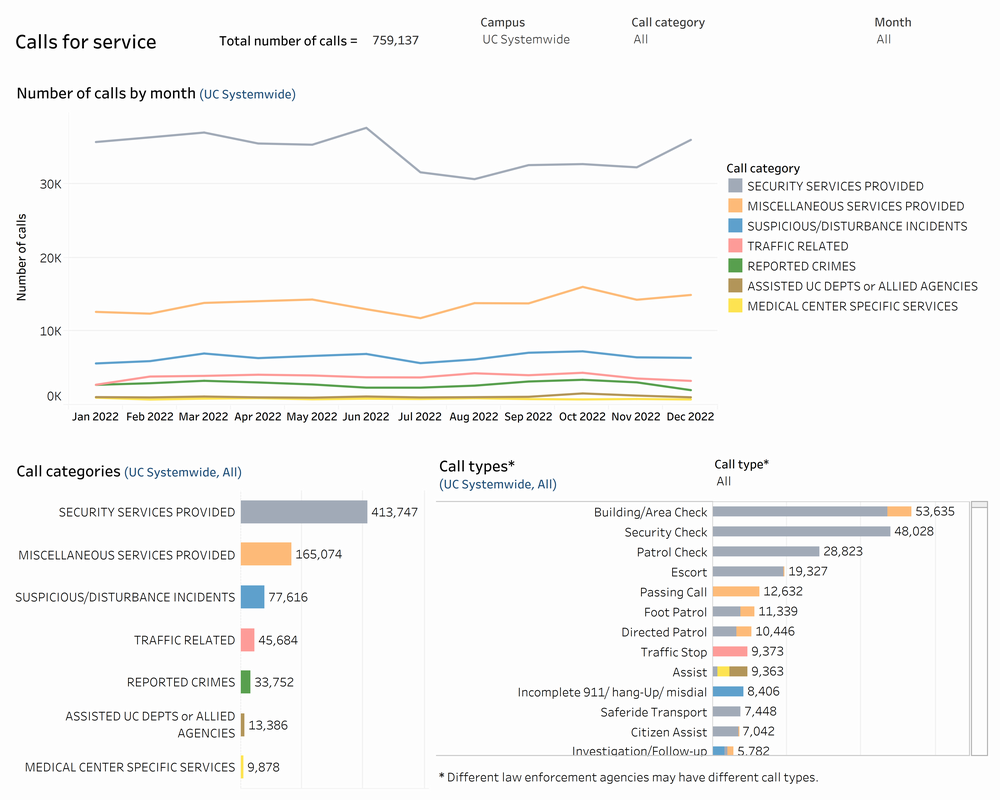
The majority of calls for service were for security services such as building check, security check, patrol check, escorts, etc. The dashboard linked above provides additional information about calls for service by campus.
As shown in the dashboard linked below, there were over 11,500 reports of criminal activities/offences and over 2,100 arrests in 2022.
12.4.4 Number of UCPD criminal activity reports/offenses by month, Universitywide, 2022
![]()
Community safety: Crimes dashboard
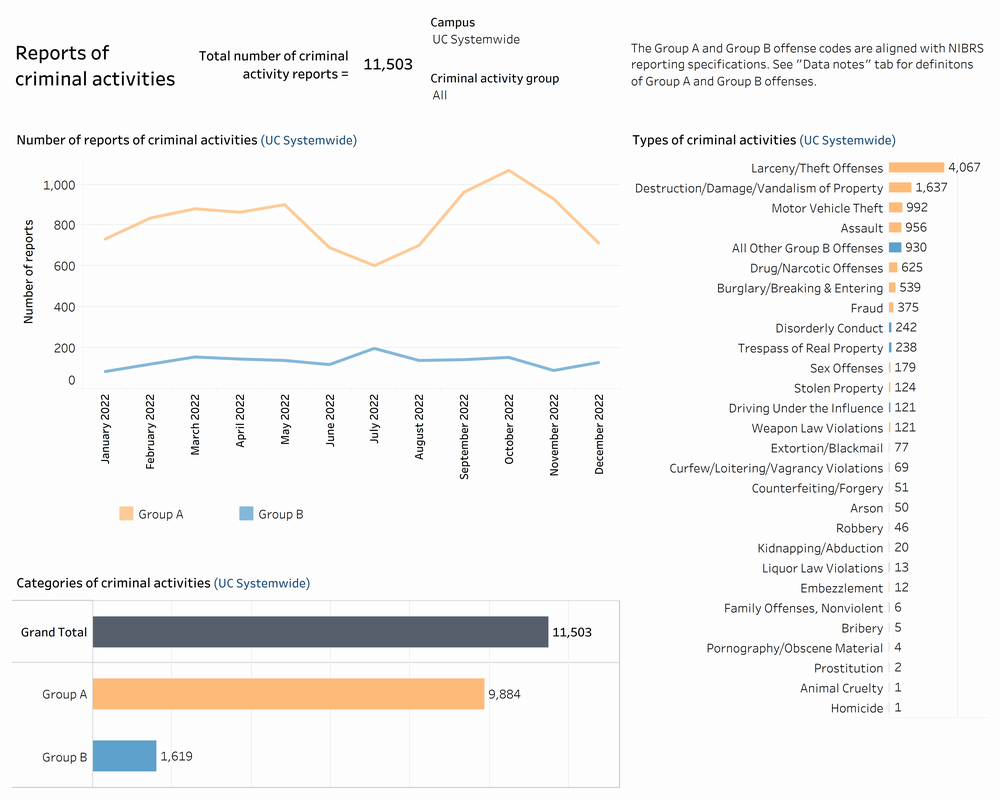
The majority of criminal activity reports were for group A offenses such as larceny/theft, vandalism, motor vehicle theft, assault, etc. The dashboard linked above includes additional data on criminal activity reports by type of criminal activity and campus.
As shown in the dashboard linked below, there were nine civilian complaints against UC police officers in 2022.
12.4.5 Number of UCPD civilian complaints by month, Universitywide, 2022
![]()
Community safety: Civilian complaints dashboard
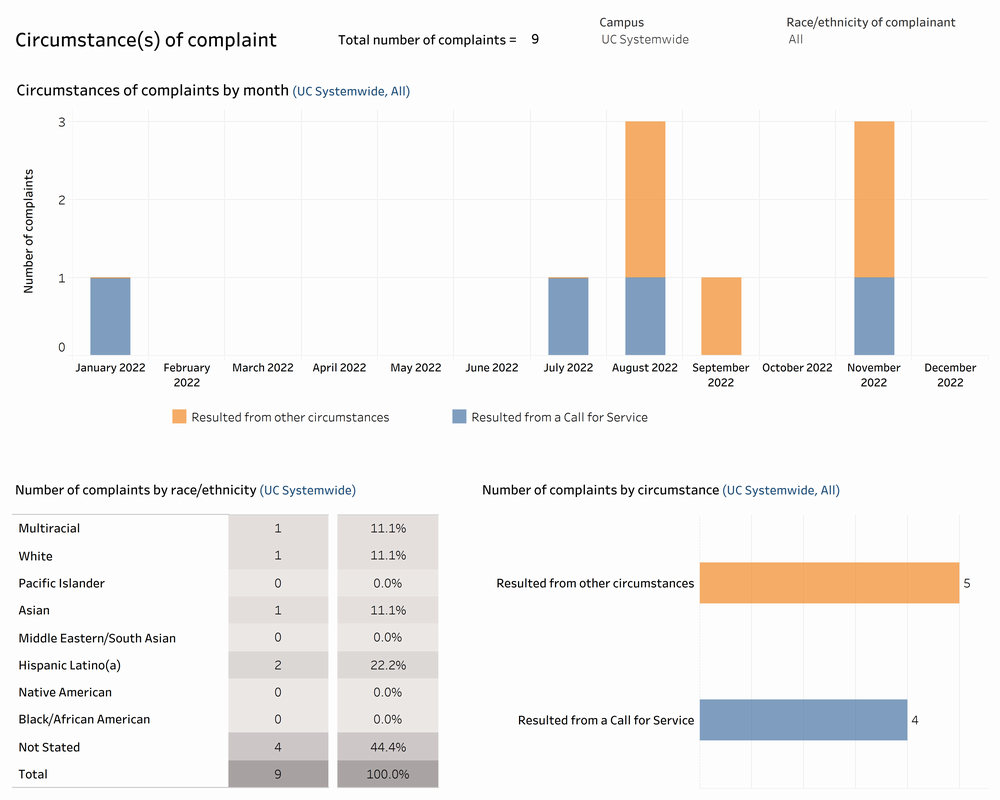
The majority of civilian complaints stemmed from allegations of unprofessional conduct. The dashboard linked above provides additional information on the circumstances and results of civilian complaints by campus.
As demonstrated by the dashboard linked below, the UC community safety budget has remained flat over the last few years.
12.4.6 UCPD budget usage by fiscal year, Universitywide, FY 2018-19 to FY 2021-22
![]()
Community safety: UCPD budget and workforce dashboard
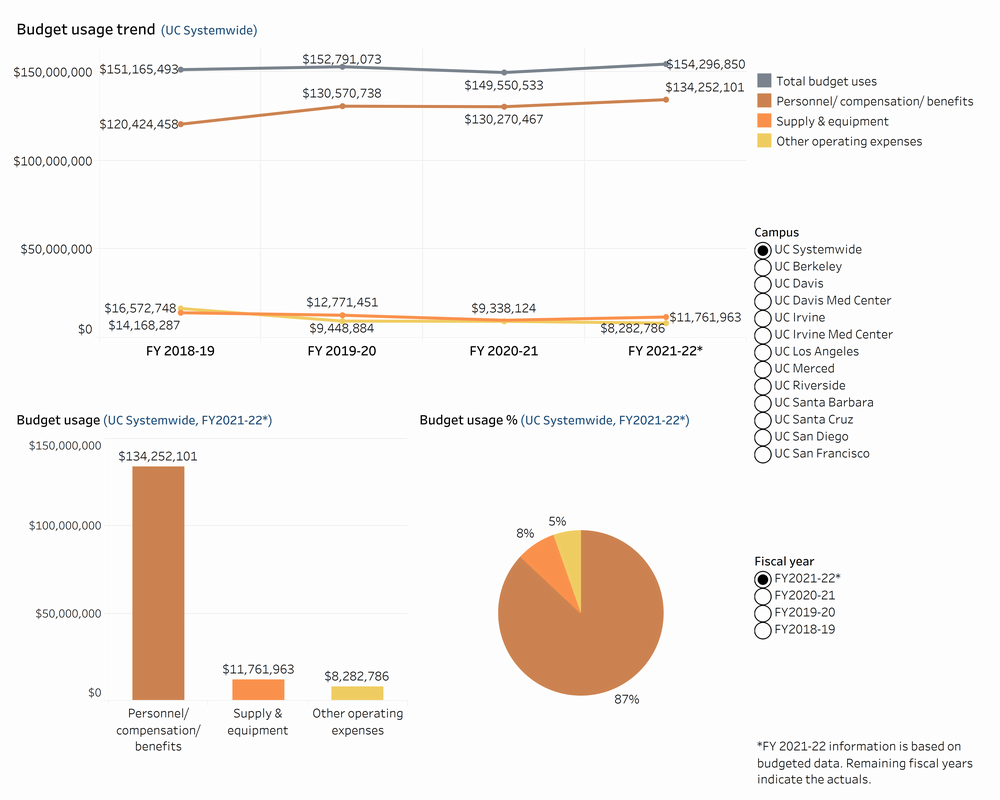
Base funding to UC police departments has remained flat over the last few years. The largest budget usage category in the UCPD budget has been personnel compensation and benefits. The dashboard linked above provides additional information about UC Community Safety budget sources/usage and workforce trends by campus.
Finances
Annual Financial reports (website)
Annual Financial reports (Medical Centers) (website)
Annual reports on University private support (website)
UC’s Operating Budget (website)
Capital Projects
Annual Major Capital Projects report (website)
Ten-Year Capital Financial Plan (website)
UC’s capital programs (website)
Sustainability
Annual Sustainability reports (website)
2022 Annual Sustainability report – Policy Progress (website)
Information on UC’s sustainability (website)
UC Community Safety
UC Community Safety Plan (website)
Update on the implementation progress of the UC community Safety Plan (November 2022) (pdf)
![]()
The complete UC Information Center Institutional measures subject area.
The complete UC Information Center UC 2030 goals subject area.
The complete UC Information Center UC by the numbers subject area.
Download data tables for chapter 12 indicators (Excel format)